16 X (Twitter) Analytics Tools for 2026

X (Twitter) Analytics Tool Shortlist
Here’s my shortlist of the best X (Twitter) analytics tools:


A Twitter analytics tool is software that tracks, measures, and reports on your X (formerly Twitter) account’s performance, audience, and content engagement. If you’re searching for the best X (Twitter) analytics tool, you’re likely looking to understand what’s working, spot trends, and make data-driven decisions that move your marketing forward.
With so many options and features to compare, it’s tough to know which tool will actually help you prove ROI, manage multiple accounts, or dig into audience insights. This list will help you quickly compare top Twitter analytics tools, so you can find the right fit for your team’s goals and reporting needs.
Why Trust Our Software Reviews
Best Twitter Analytics Tool Summary
This comparison chart summarizes pricing details for my top Twitter analytics tool selections to help you find the best one for your budget and business needs.
| Tool | Best For | Trial Info | Price | ||
|---|---|---|---|---|---|
| 1 | Best for managing multiple accounts | Free demo available | From $30/month (billed annually) | Website | |
| 2 | Best for scheduling with engagement insights | 14-day free trial + free plan available | From $5/channel/month (billed annually) | Website | |
| 3 | Best for real-time hashtag monitoring | 7-day free trial | From $79/user/month | Website | |
| 4 | Best for visual analytics features | Free demo available | Pricing upon request | Website | |
| 5 | Best for media monitoring integration | Free demo available | Pricing upon request | Website | |
| 6 | Best for audience research insights | Free plan available | From $38/month (billed annually) | Website | |
| 7 | Best for campaign performance tracking | Free to use | Free to use | Website | |
| 8 | Best for in-depth profile analytics | Free plan available | From $19/month | Website | |
| 9 | Best for audience segmentation | Free plan available | Pricing upon request | Website | |
| 10 | Best for follower growth analysis | Free plan available | From $39/month | Website |
-

Demandbase
Visit WebsiteThis is an aggregated rating for this tool including ratings from Crozdesk users and ratings from other sites.4.4 -
6sense
Visit WebsiteThis is an aggregated rating for this tool including ratings from Crozdesk users and ratings from other sites.4.3 -
AnswerThePublic
Visit Website


X (Twitter) Analytics Tool Reviews
Below are my detailed summaries of the best X (Twitter) analytics tools that made it onto my shortlist. My reviews offer a detailed look at the features, best use cases, and integrations of each tool to help you find the best one for you.
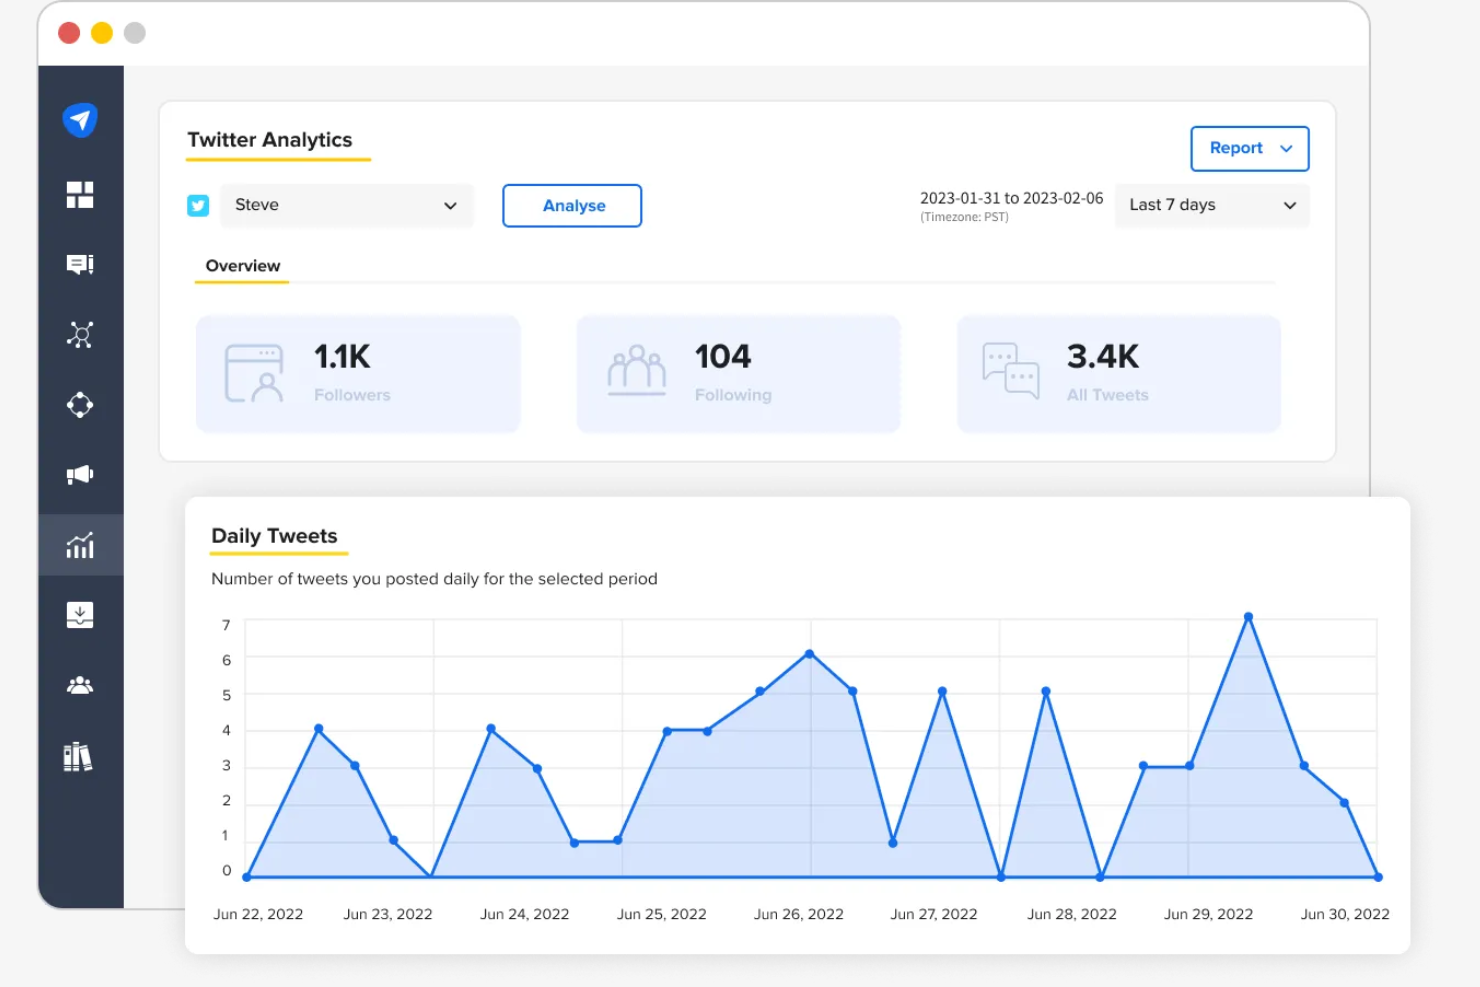
If you’re juggling several X accounts for clients or brands, SocialPilot is built to help you keep everything organized. The platform appeals to agencies, consultants, and social media managers who need to schedule, analyze, and report on multiple profiles at once. With features designed for bulk management and analytics across accounts, SocialPilot addresses the complexity of multi-account X strategies.
Why I Picked SocialPilot
Managing analytics for several X accounts can get complicated, which is why SocialPilot’s multi-account capabilities stand out. I picked SocialPilot because it lets you track performance metrics, engagement, and audience growth for each account from a single dashboard. The tool also supports bulk scheduling and reporting, so you can compare results across clients or brands without switching between profiles. For agencies and teams handling multiple X presences, these features make SocialPilot a practical analytics solution.
SocialPilot Key Features
Some other features that make SocialPilot useful for X (Twitter) analytics include:
- Content Calendar View: Visualize all scheduled and published tweets in a calendar format.
- Team Collaboration Tools: Assign roles and manage permissions for team members working on X (Twitter) accounts.
- Custom Report Builder: Create and export tailored analytics reports for different clients or campaigns.
- RSS Feed Automation: Automatically share content from selected RSS feeds to X (Twitter) accounts.
SocialPilot Integrations
Integrations include Facebook, Instagram, LinkedIn, X (Twitter), TikTok, Pinterest, Google Business Profile, Tumblr, and more.
Pros and Cons
Pros:
- Includes team roles for account management
- Manages analytics for unlimited accounts
- Efficient bulk scheduling
Cons:
- No free plan
- Limited social listening
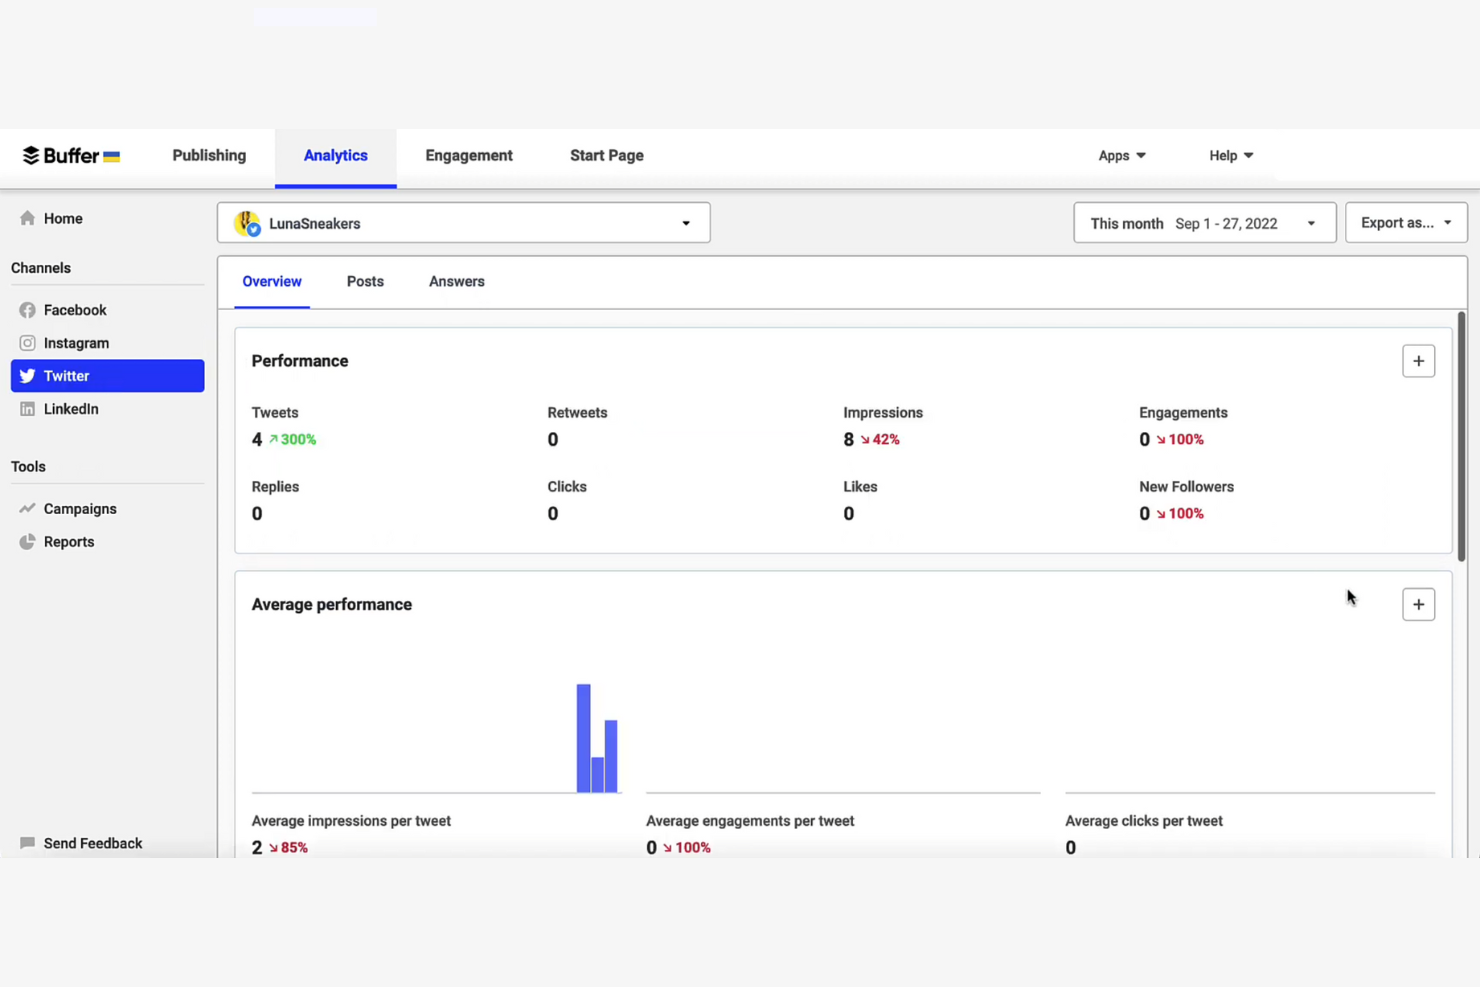
Buffer stands out for teams and solo marketers who want to schedule X posts and track engagement in one place. The platform combines publishing tools with analytics that highlight which tweets drive the most interaction. If you need to plan content and measure performance without juggling multiple tools, Buffer brings both together in a single workflow.
Why I Picked Buffer
Buffer’s combination of scheduling and engagement insights makes it a strong choice for anyone managing X content and performance. I picked Buffer because it lets you queue tweets in advance and then review analytics on likes, retweets, and replies for each post. The engagement dashboard highlights the best time to post and top-performing trends, so you can quickly see what’s resonating. For marketers who want to connect content planning with real-time results, Buffer’s analytics features are a practical fit.
Buffer Key Features
Some other Buffer features that are useful for X analytics include:
- Multi-Account Management: Connect and manage multiple Twitter profiles from a single dashboard.
- Team Collaboration Tools: Assign roles and permissions for team members to coordinate content and analytics.
- Post Approval Workflow: Set up an approval process for tweets before they are published.
- Hashtag Performance Tracking: Monitor how specific hashtags perform across your scheduled and published tweets.
Buffer Integrations
Integrations include Instagram, Facebook, LinkedIn, Pinterest, Google Business Profiles, Shopify, Dropbox, Google Drive, and more.
Pros and Cons
Pros:
- Offers a post-by-post engagement breakdown
- Reliable mobile app
- Includes team collaboration
Cons:
- Does not track hashtag performance
- Single queue limitation
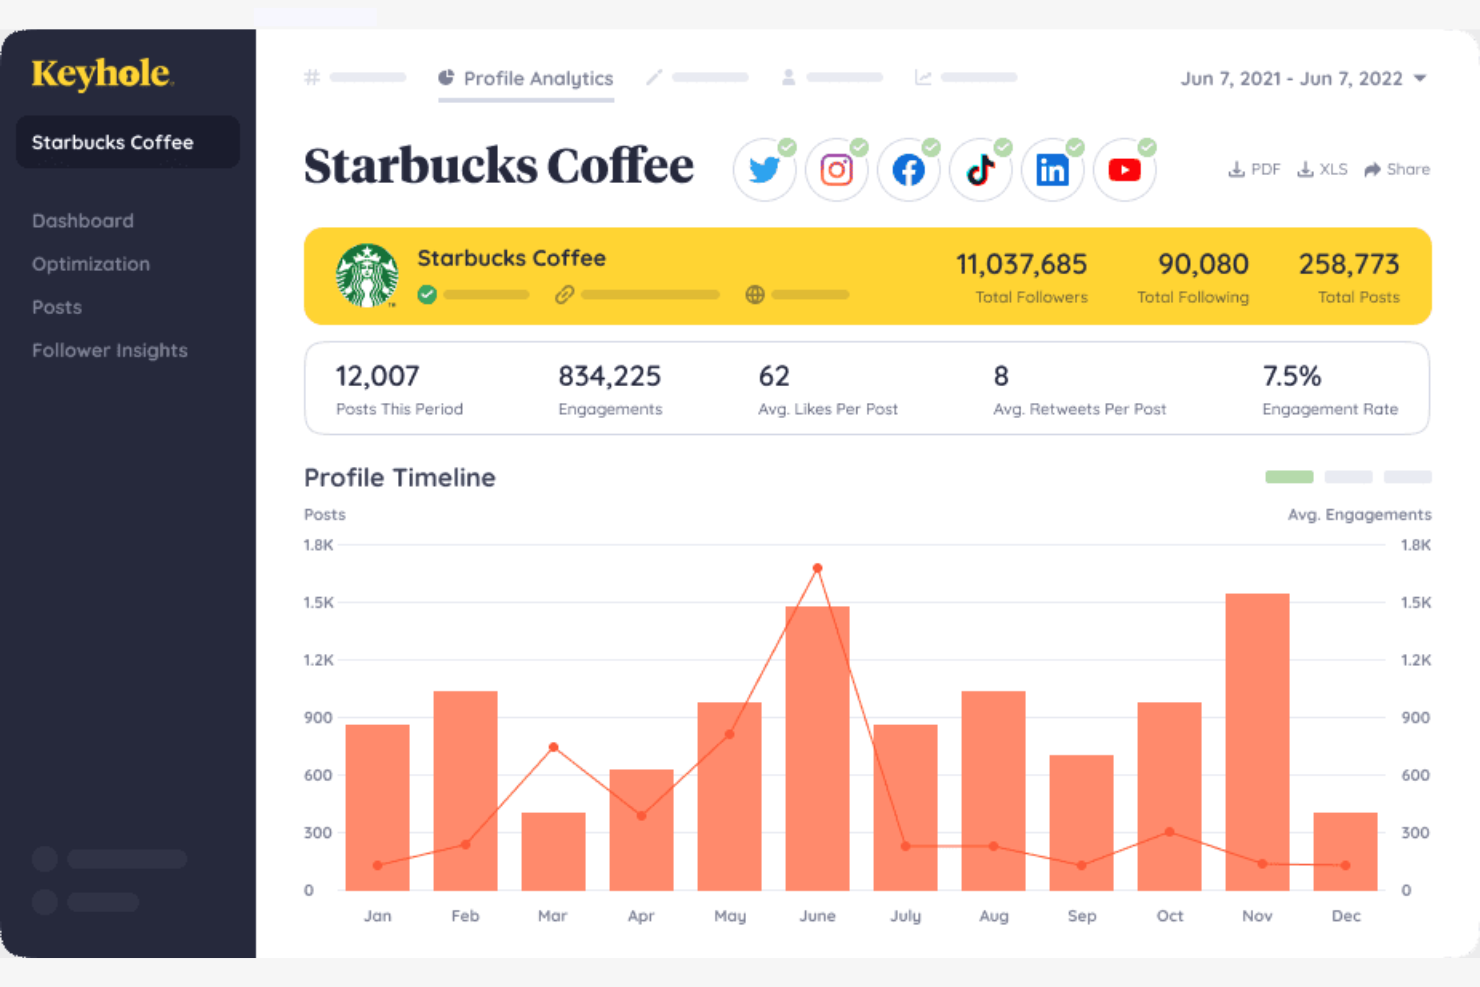
For teams tracking X (Twitter) campaigns in real time, Keyhole offers instant hashtag and keyword analytics. This tool is especially useful for organizers who need social media analytics to monitor conversations and measure campaign impact in real time. Keyhole’s real-time data helps you spot trends, track reach, and adjust your strategy on the fly.
Why I Picked Keyhole
When you need to track hashtags and keywords as they trend, Keyhole’s real-time monitoring stands out. I picked Keyhole because it delivers live data on hashtag performance, reach, and engagement, which is essential for campaign tracking and event coverage. The platform also visualizes conversation spikes and sentiment shifts as they happen, so you can quickly respond or adjust your strategy. For marketers and teams who rely on up-to-the-minute insights, these features make Keyhole a strong fit for X analytics.
Keyhole Key Features
Some other features that make Keyhole valuable for X analytics include:
- Influencer Identification: Find and analyze top influencers engaging with your tracked hashtags.
- Automated Reporting: Schedule and generate custom analytics reports for stakeholders.
- Competitor Tracking: Monitor and compare competitor hashtags and keyword performance.
- Historical Data Access: Access and analyze past X data for long-term trend analysis.
Keyhole Integrations
Integrations include Slack, Microsoft Power BI, and Google Sheets. Keyhole also offers an API for custom integrations.
Pros and Cons
Pros:
- Detailed competitor benchmarking
- In-depth hashtag tracking
- Real-time sentiment analysis
Cons:
- No ad campaign analytics
- Limited post scheduling

If you need an all-in-one solution to analyze X data through visuals and rich media, Talkwalker offers advanced visual analytics features that go beyond standard metrics. This platform is well-suited for brands, agencies, and social media teams that want to track images, logos, and video content alongside text-based mentions. With Talkwalker, you can uncover trends and brand exposure in visual content that traditional analytics tools often miss.
Why I Picked Talkwalker
Talkwalker stands out for its visual analytics capabilities. I picked this tool because it can identify and track images, logos, and even video content shared on X, not just text-based mentions. Talkwalker’s image recognition and visual listening features help you monitor brand exposure and campaign reach in visual media. If you need to understand how your brand appears in photos and videos across X, Talkwalker offers a level of insight that text-focused tools can’t match.
Talkwalker Key Features
Some other features that make Talkwalker useful for X analytics include:
- Real-Time Social Listening: Monitor X conversations and trends as they happen.
- Sentiment Analysis: Automatically detect and categorize sentiment in tweets and mentions.
- Customizable Dashboards: Build dashboards to visualize and track the metrics that matter most to your team.
- Automated Alerts: Set up notifications for spikes in activity or specific keyword mentions.
Talkwalker Integrations
Integrations are not publicly listed.
Pros and Cons
Pros:
- Extensive global source coverage
- Customizable interactive data widgets
- Advanced visual recognition tools
Cons:
- Limited native integrations for data export
- Can be complex for basic analytics needs
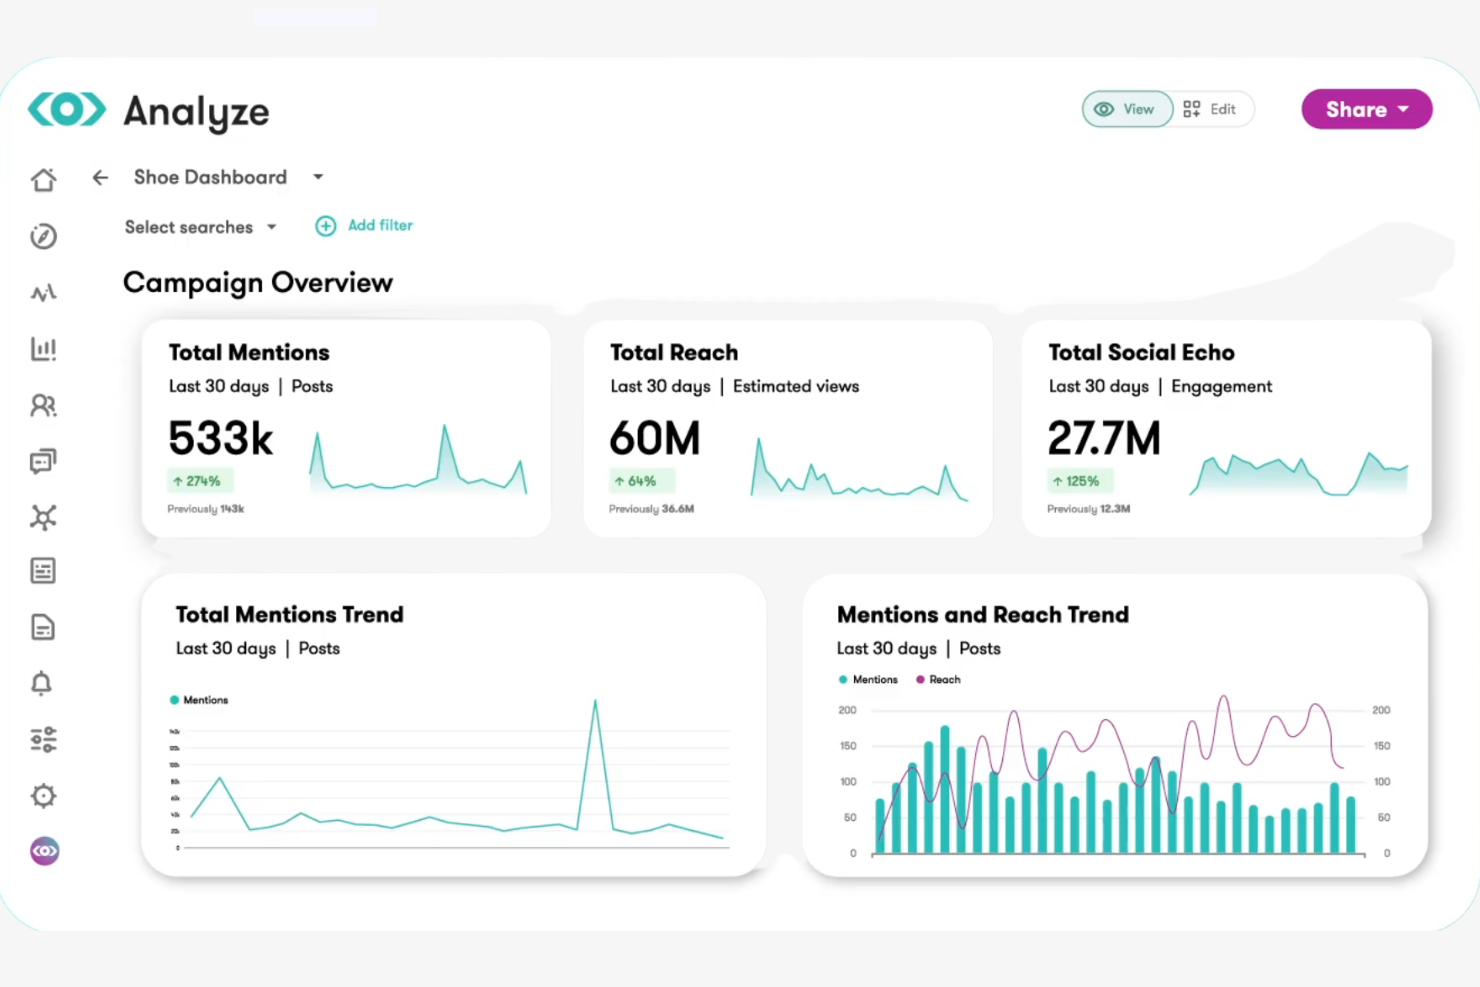
If you need to connect X (Twitter) analytics with broader media monitoring, Meltwater brings social and news data together in one platform. This tool is a strong fit for PR teams, agencies, and brands that want to track conversations alongside news coverage and online mentions. Meltwater helps you see how your X activity fits into the larger media landscape, making it easier to measure impact and manage reputation.
Why I Picked Meltwater
Meltwater stands out for its ability to integrate social data with media monitoring across news, blogs, and broadcast. I picked Meltwater because it lets you track conversations in the context of wider media coverage, which is especially useful for PR and communications teams. The platform’s unified dashboard brings together real-time X analytics, sentiment analysis, and media mentions, so you can see how your brand or campaign is being discussed across channels. This level of integration helps you connect social activity to broader reputation and media impact.
Meltwater Key Features
Some other features that make Meltwater useful for X analytics include:
- Customizable Dashboards: Build dashboards to track specific Twitter metrics and KPIs.
- Automated Alerts: Set up real-time notifications for spikes in Twitter activity or mentions.
- Influencer Discovery: Identify and analyze influential Twitter accounts relevant to your brand or campaign.
- Content Performance Tracking: Monitor engagement and reach for individual tweets and campaigns.
Meltwater Integrations
Integrations include Salesforce, Microsoft Teams, Slack, Google Analytics, HubSpot, Hootsuite, WordPress, NICE, and an API for custom integrations.
Pros and Cons
Pros:
- Advanced media contact lists
- Deep sentiment analysis filters
- Allows cross-channel monitoring
Cons:
- No granular follower analytics
- Occasional data export limits
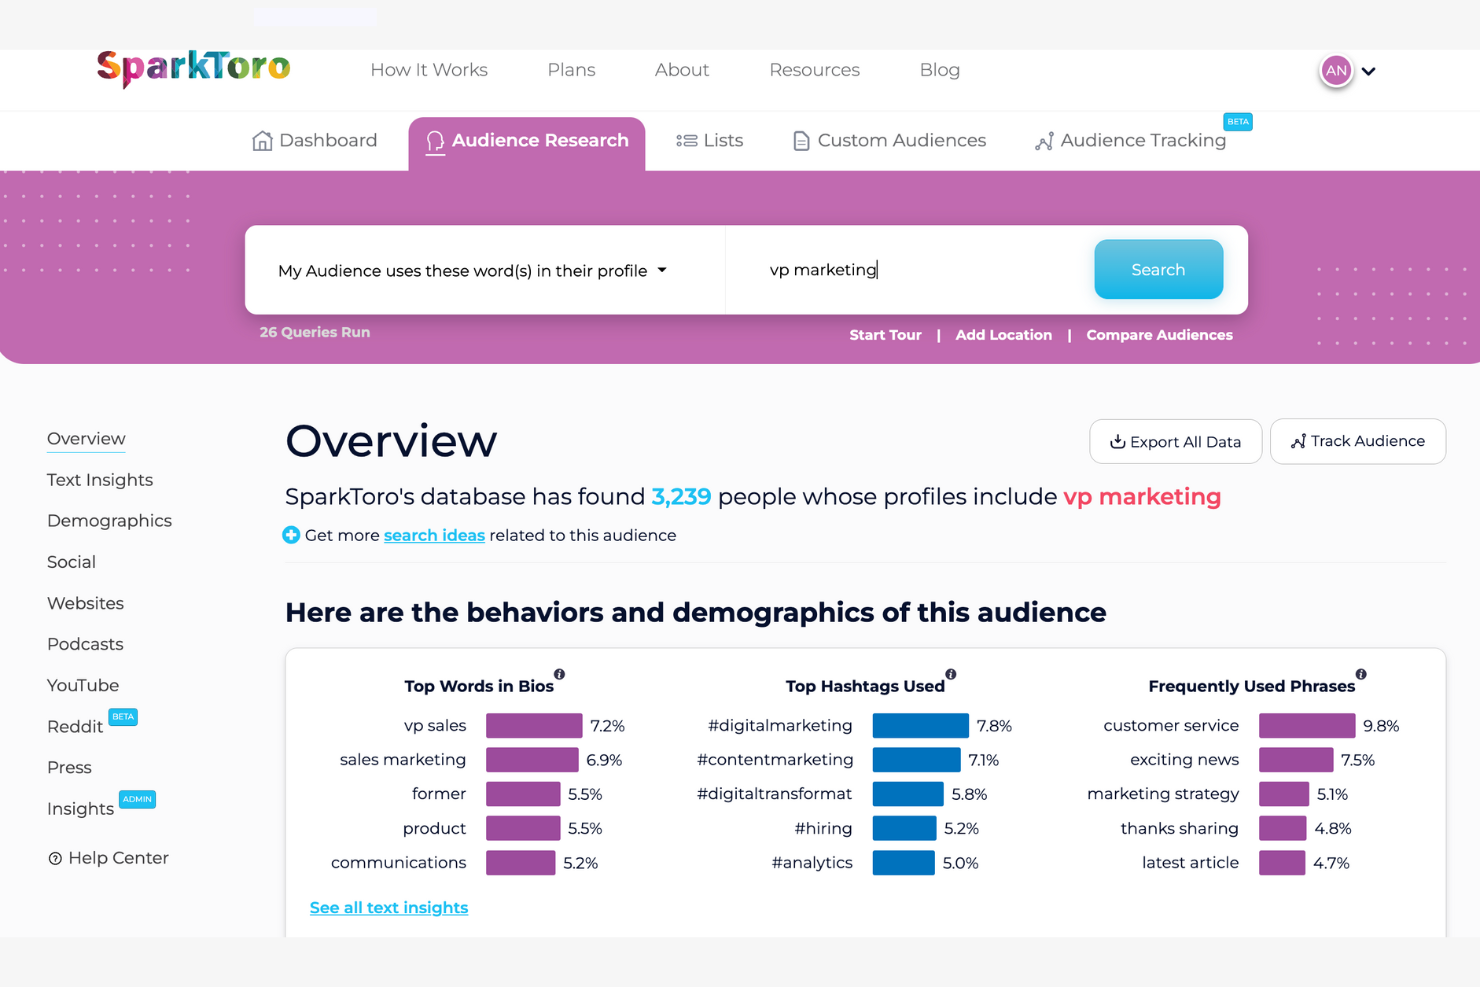
SparkToro gives you a different angle on X (Twitter) analytics by focusing on audience research and behavior. It’s a strong choice for marketers, strategists, and agencies who want to understand what their X audience reads, follows, and talks about beyond basic metrics. With SparkToro, you can uncover the sources, hashtags, and accounts that influence your target audience, helping you shape smarter content and outreach strategies.
Why I Picked SparkToro
What sets SparkToro apart is its focus on uncovering deep audience insights rather than just surface-level X metrics. I picked SparkToro because it helps you see what your audience actually pays attention to—like which accounts they follow, hashtags they use, and websites they visit. The tool’s audience search and analysis features let you identify influential voices and trending topics within your niche. This approach gives you a clearer picture of your audience’s interests, so you can make more informed decisions about your X content and engagement strategies.
SparkToro Key Features
Some other features that make SparkToro valuable for X analytics include:
- Demographic Breakdown: View audience data by location, job title, and other demographic filters.
- Social Account Overlap: Analyze which other social accounts your audience follows.
- Frequent Phrases and Hashtags: Discover the most common phrases and hashtags used by your audience.
- Exportable Reports: Download audience insights and data for further analysis or sharing.
SparkToro Integrations
Integrations are not publicly listed.
Pros and Cons
Pros:
- Zero-click search behavior insights
- Unique hidden influencer discovery
- Precise audience demographic data
Cons:
- Doesn’t provide post-level analytics
- No direct post scheduling
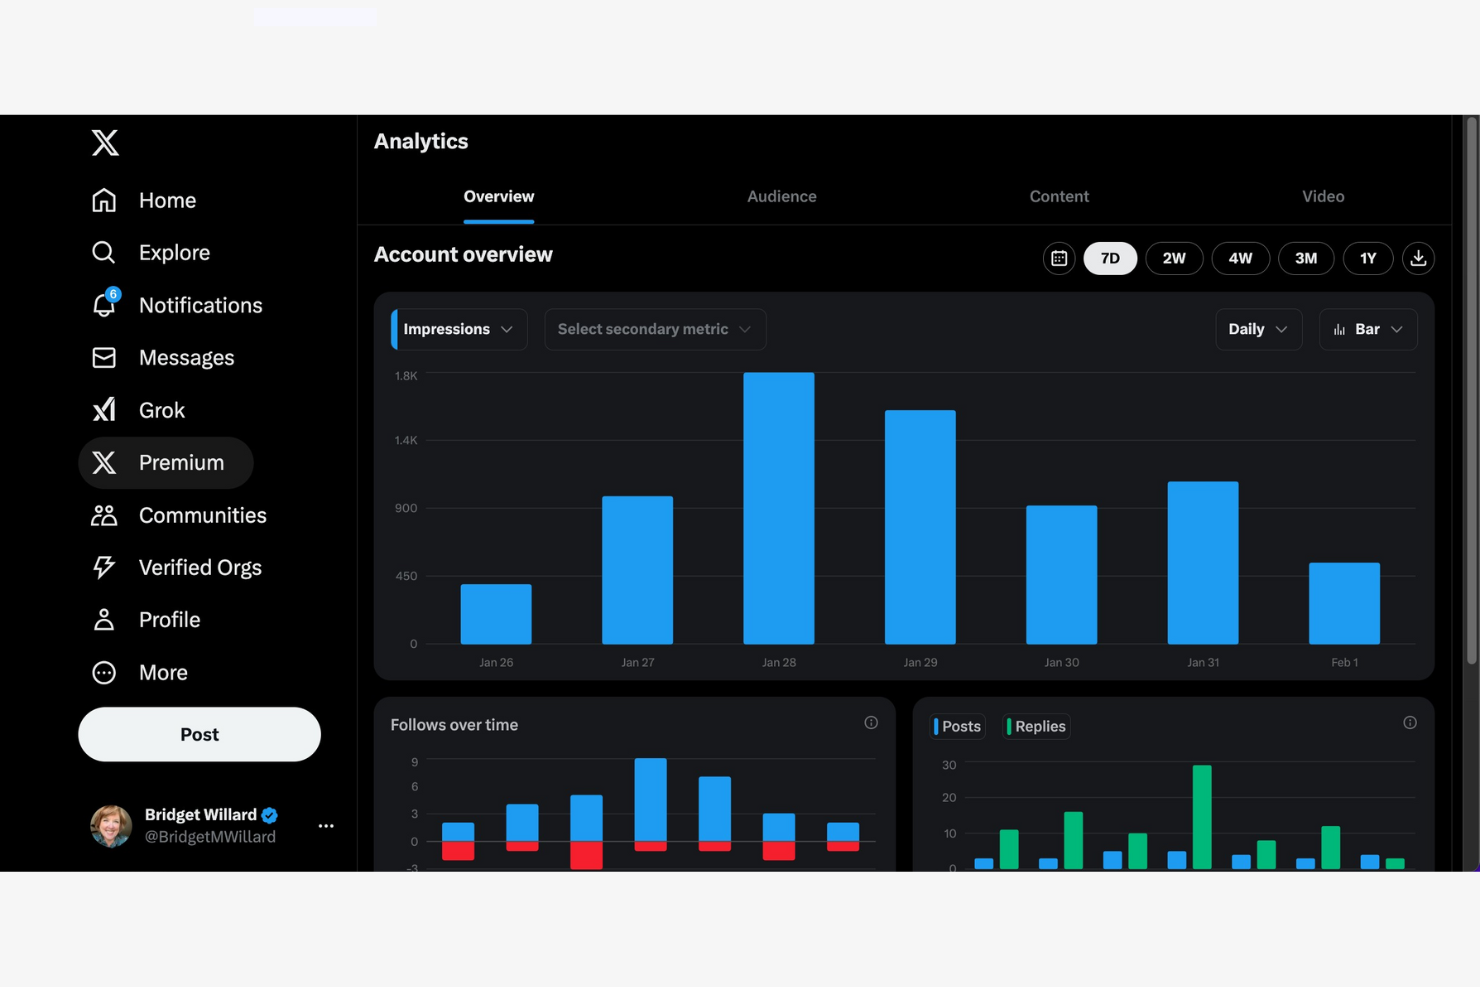
X Analytics is the native analytics tool offered by X. It offers detailed metrics on ad reach, engagement, and conversion, making it useful for businesses focused on a paid marketing strategy. If you want to measure ROI for your social media marketing and adjust campaigns in real time, this tool gives you the data you need.
Why I Picked X Analytics
For teams focused on campaign performance tracking, X Analytics stands out because it delivers granular data on X ad campaigns. I picked this tool for its native analytics that break down impressions and conversion events, which are essential for optimizing paid campaigns. This analytics platform also offers real-time reporting, so you can quickly spot trends and adjust your Twitter strategy as needed. These features make it a strong choice for marketers who need to prove ROI and fine-tune their X advertising efforts.
X Analytics Key Features
Some other features in X Analytics that are useful for X (Twitter) analytics include:
- Audience Demographics: View detailed breakdowns of your audience by age, gender, location, and interests.
- Custom Report Builder: Create tailored reports with the specific metrics and visualizations your team needs.
- Scheduled Reporting: Set up automated delivery of analytics reports to your inbox or team members.
- Comparative Campaign Analysis: Compare multiple campaigns side by side to identify trends and performance differences.
X Analytics Integrations
Integrations are not publicly listed.
Pros and Cons
Pros:
- Zero setup required
- Real-time impression tracking
- Native data accuracy
Cons:
- Limited historical data
- Lacks organic tweet analytics
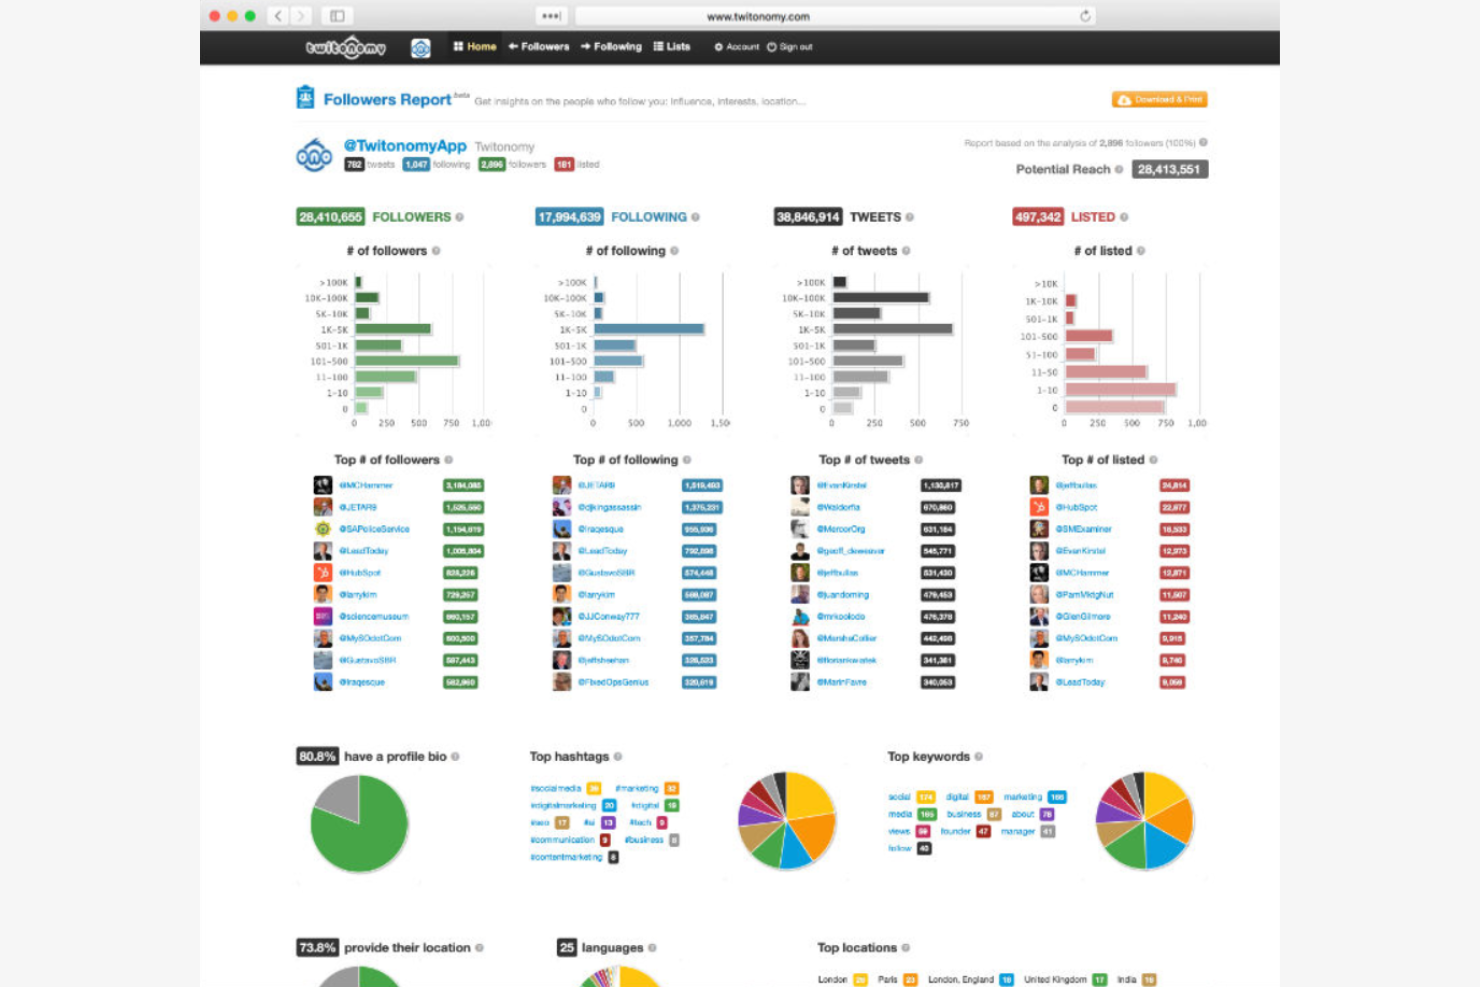
Twitonomy gives social media managers and analysts a detailed look at individual X profiles, making it useful for anyone who needs to audit or benchmark account activity. The platform highlights tweet patterns, engagement rates, and follower insights that go beyond standard analytics dashboards. If you want to dig into profile-level data for competitive research or account optimization, Twitonomy offers the depth you need.
Why I Picked Twitonomy
What sets Twitonomy apart is its focus on in-depth profile analytics, which is something many X analytics tools only touch on lightly. I picked this tool because it lets you drill down into tweet history, engagement metrics, and follower growth for any public profile. You can also analyze mentions, reposts, and hashtags at the profile level, which is valuable for benchmarking and competitive analysis. For marketers and analysts who need to go beyond surface-level stats, Twitonomy offers the kind of granular insights that make a real difference.
Twitonomy Key Features
Some other features in Twitonomy that are helpful for X analytics include:
- Exportable Analytics Reports: Download detailed analytics in Excel or PDF format for further analysis or sharing.
- List Monitoring: Track and analyze activity from specific X lists you create or follow.
- Geolocation Mapping: Visualize where tweets and mentions are coming from on an interactive map.
- Keyword and Hashtag Tracking: Monitor the performance and reach of specific keywords or hashtags over time.
Twitonomy Integrations
Integrations are not publicly listed.
Pros and Cons
Pros:
- Easy follower scrubbing
- Granular data interrogation
- Offers a versatile free tool
Cons:
- No ads performance analysis
- No team collaboration tools
For teams that need to dig deep into their audience, Followerwonk specializes in advanced segmentation and follower analysis. It’s a strong fit for marketers, agencies, and researchers who want to identify, categorize, and understand different audience segments. Followerwonk helps you search bios, compare users, and map out detailed audience profiles to inform targeting and engagement strategies.
Why I Picked Followerwonk
What sets Followerwonk apart is its focus on audience segmentation for X (Twitter) analytics. I picked this tool because it lets you search and filter bios, making it easy to identify specific audience groups based on keywords, location, or influence. Followerwonk also provides side-by-side comparisons of different user accounts, so you can analyze overlaps and gaps in your audience. If you need to break down your following into actionable segments, Followerwonk is purpose-built for that task.
Followerwonk Key Features
In addition to its segmentation capabilities, I also found these features useful:
- Follower Mapping: Visualize where your followers are located around the world.
- Engagement Analytics: Track when your followers are most active on the platform.
- Account Tracking: Monitor changes in follower counts over time for any public account.
- Social Graph Comparison: Analyze how your followers overlap with other accounts in your niche.
Followerwonk Integrations
Integrations are not publicly listed.
Pros and Cons
Pros:
- Efficient bio keyword searching
- Detailed social authority scoring
- Powerful follower overlap comparison
Cons:
- No tweet sentiment analysis features
- Limited to X analytics
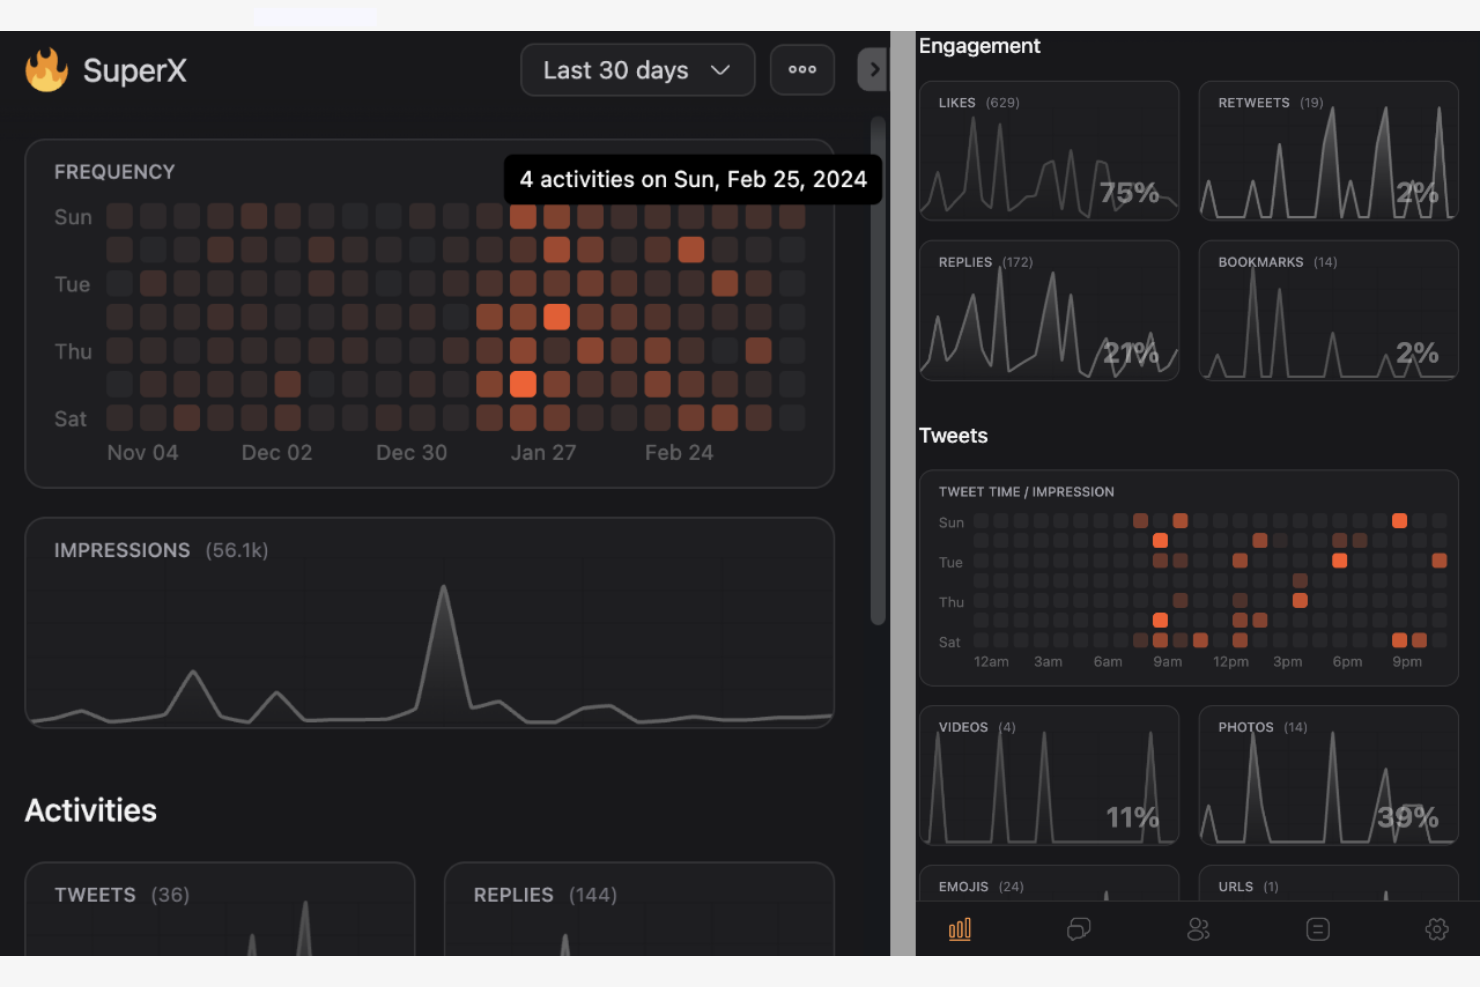
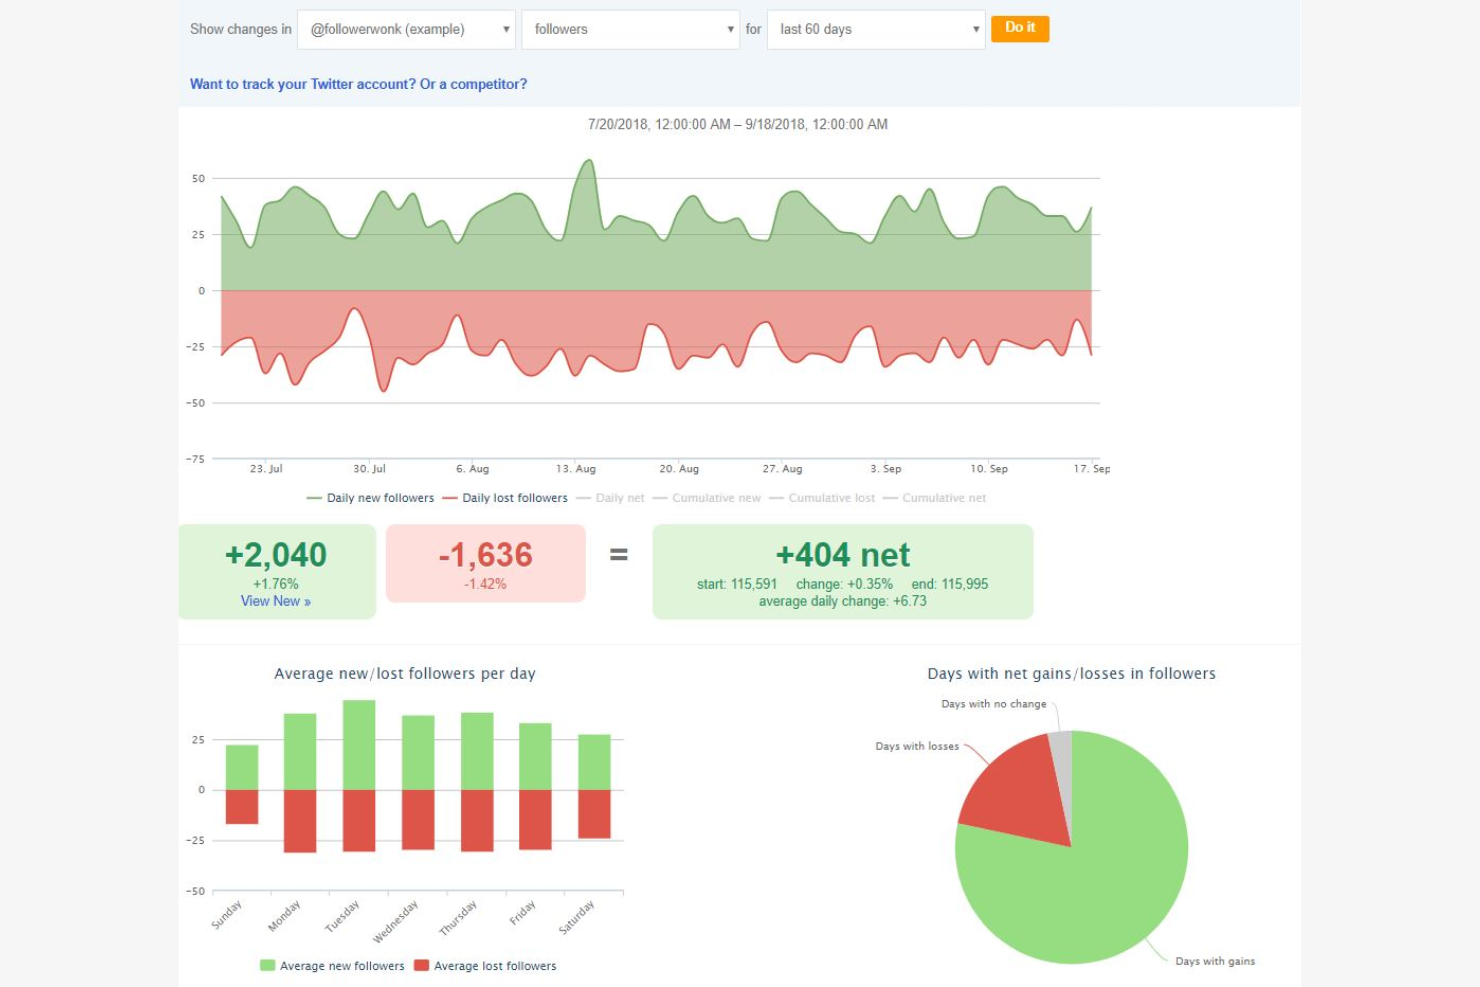
If you want a social media tool focused on accelerating your follower growth, SuperX offers analytics built for that purpose. It’s designed for social media managers, creators, and brands who want to pinpoint what drives audience gains and losses. SuperX helps you analyze growth patterns, track competitor performance, and identify which content or campaigns are most effective at attracting new followers.
Why I Picked SuperX
SuperX stands out for its focus on analyzing and visualizing follower growth on X (Twitter). I picked this tool because it gives you detailed breakdowns of daily, weekly, and monthly follower changes, so you can see exactly when spikes or drops happen. SuperX also lets you compare your follower growth to competitors, which is useful for benchmarking your performance in context. If you want to understand what’s driving your audience numbers and how your growth stacks up, SuperX is built for that purpose.
SuperX Key Features
Some other features that make SuperX useful for X (Twitter) analytics include:
- Content Performance Tracking: Measure how individual tweets contribute to follower changes.
- Competitor Account Monitoring: Track and compare growth metrics for multiple competitor profiles.
- Audience Demographics Insights: View breakdowns of follower locations, interests, and activity patterns.
- Automated Growth Reports: Schedule and receive regular reports summarizing key growth analytics.
SuperX Integrations
Integrations are not publicly listed.
Pros and Cons
Pros:
- Efficient daily engagement audits
- High-speed real-time data fetching
- Offers a Chrome extension
Cons:
- No native export options for raw analytics data
- Lacks support for direct engagement
Other X (Twitter) Analytics Tools
Here are some additional X (Twitter) analytics tool options that didn’t make it onto my shortlist, but are still worth checking out:
- Brand24
For brand mention tracking
- Zoho Analytics
For customizable reporting
- Agorapulse
For team collaboration workflows
- Hootsuite
For unified social analytics
- Twilert
For custom email alert setup


Twitter Analytics Tool Selection Criteria
When selecting the best Twitter analytics tools to include in this list, I considered common buyer needs and pain points like tracking real-time engagement metrics and reporting on campaign performance. I also used the following framework to keep my evaluation structured and fair:
Core Functionality (25% of total score)
To be considered for inclusion in this list, each solution had to fulfill these common use cases:
- Track follower growth and engagement rates
- Monitor tweet performance and reach
- Analyze hashtag and keyword trends
- Export analytics reports for sharing
- Visualize data with charts and graphs
Additional Standout Features (25% of total score)
To help further narrow down the competition, I also looked for unique features, such as:
- AI-powered insights and recommendations
- Customizable dashboard layouts
- Multi-channel analytics blending
- Automated scheduled reporting
- White labeling for client-facing reports
Usability (10% of total score)
To get a sense of the usability of each system, I considered the following:
- Clean and intuitive dashboard design
- Logical navigation between analytics sections
- Customizable widgets and views
- Responsive performance with large datasets
- Accessibility for users with different skill levels
Onboarding (10% of total score)
To evaluate the onboarding experience for each platform, I considered the following:
- Step-by-step setup guides or product tours
- Availability of training videos and documentation
- Pre-built report templates for a quick start
- Access to live chat or onboarding webinars
- In-app tips and contextual help
Customer Support (10% of total score)
To assess each software provider’s customer support services, I considered the following:
- Availability of live chat or phone support
- Response times for support tickets
- Quality of help center resources
- Access to user communities or forums
- Proactive outreach and follow-up
Value For Money (10% of total score)
To evaluate the value for money of each platform, I considered the following:
- Transparent and flexible pricing tiers
- Features included at each price point
- Free trial or free plan availability
- Cost compared to similar tools
- Scalability for growing teams
Customer Reviews (10% of total score)
To get a sense of overall customer satisfaction, I considered the following when reading customer reviews:
- Consistency of positive feedback across platforms
- Reported reliability and uptime
- Praise or complaints about specific features
- Feedback on customer support experiences
- User sentiment about ongoing product updates
How to Choose an X (Twitter) Analytics Tool
It’s easy to get bogged down in long feature lists and complex pricing structures. To help you stay focused as you work through your unique software selection process, here’s a checklist of factors to keep in mind:
| Factor | What to Consider |
|---|---|
| Scalability | Will the tool handle increased data volume as your X presence grows or as you add more accounts? |
| Integrations | Does the tool connect natively to your existing marketing stack, such as CRM, ad platforms, or BI tools? |
| Customizability | Can you tailor dashboards, reports, and metrics to match your team’s specific KPIs and workflows? |
| Ease of use | Will your team be able to navigate and use the tool without extensive training or technical support? |
| Implementation and onboarding | How long will it take to get up and running, and what resources or support does the vendor provide during setup? |
| Cost | Are the pricing tiers clear, and do they align with your expected usage and required features? |
| Security safeguards | Does the tool offer data encryption, user access controls, and compliance with your organization’s security standards? |
| Support availability | What support channels are offered, and are they available during your business hours or in your region? |
What Are X (Twitter) Analytics Tools?
An X (Twitter) analytics tool is software that collects, tracks, and visualizes data from X accounts to help users understand performance and audience engagement. As an analysis tool, these platforms provide insights into metrics like tweet reach, follower growth, hashtag trends, and content interactions. Marketing teams, agencies, and social media managers use X analytics tools to measure campaign impact, optimize content strategies, and report on key social media outcomes.
Features
When selecting an X (Twitter) analytics tool, keep an eye out for the following key features:
- Tweet performance tracking: Monitors metrics like impressions, clicks, retweets, and replies for each tweet to help you evaluate content effectiveness.
- Follower analytics: Tracks follower growth, demographics, and activity patterns so you can better understand and segment your audience.
- Hashtag analysis: Measures the reach, popularity, and engagement of specific hashtags to inform campaign and content strategy.
- Engagement metrics: Aggregates data on likes, replies, mentions, and shares to show how users interact with your content.
- Competitor analysis: Compares your account’s performance against competitors or industry averages to identify strengths and gaps.
- Custom report generation: Allows you to create and export tailored reports with selected metrics and visualizations for stakeholders.
- Data export options: Provides the ability to download raw or processed data in formats like CSV or PDF for further analysis or sharing.
- Multi-account management: Lets you track and analyze data from multiple accounts within a single dashboard.
- Scheduled reporting: Automates the delivery of analytics reports to your team or clients at set intervals.
- Visualization tools: Offers charts, graphs, and dashboards to help you interpret and present data clearly.
Benefits
Implementing an X (Twitter) analytics tool provides several benefits for your team and your business. Here are a few you can look forward to:
- Data-driven decision making: Access to real-time metrics and historical trends helps your team make informed choices about content and campaigns.
- Improved audience understanding: Follower analytics and engagement metrics reveal who your audience is and how they interact with your brand.
- Campaign performance measurement: Detailed tracking of tweets and hashtag performance allows you to assess the impact of marketing efforts.
- Efficient reporting workflows: Custom report generation and scheduled reporting save time and ensure stakeholders receive timely updates.
- Competitive benchmarking: Comparing your account to competitors highlights opportunities for growth and areas needing attention.
- Resource optimization: Multi-account management and data export features help you allocate resources and analyze results across teams or clients.
- Clear data visualization: Built-in dashboards and visualization tools make it easier to interpret complex Twitter data and share insights.
Costs & Pricing
Selecting an X (Twitter) analytics tool requires an understanding of the various pricing models and plans available. Costs vary based on features, team size, add-ons, and more. The table below summarizes common plans, their average prices, and typical features included in X analytics tool solutions:
Plan Comparison Table for X (Twitter) Analytics Tool
| Plan Type | Average Price | Common Features |
|---|---|---|
| Free Plan | $0 | Basic tweet analytics, limited data history, single account support, and basic export options. |
| Personal Plan | $10-$25/user/month | Advanced tweet metrics, hashtag tracking, custom reports, and support for multiple accounts. |
| Business Plan | $50-$150/month | Team collaboration tools, scheduled reporting, competitor benchmarking, and priority support. |
| Enterprise Plan | $300-$1000+/month | API access, advanced security controls, custom onboarding, dedicated account manager, and SLA support. |
X (Twitter) Analytics Tool FAQs
Here are some answers to common questions about X (Twitter) analytics tools:
Can I track multiple X (Twitter) accounts with one analytics tool?
Yes, most X (Twitter) analytics tools support tracking multiple accounts from a single dashboard. This is useful for agencies, brands with several profiles, or teams managing different campaigns. Always check account limits, as some plans restrict the number of profiles you can monitor.
How often is X (Twitter) data updated in analytics tools?
Data refresh rates vary by tool and plan. Some updates are near real-time, while others refresh every few hours or daily. If you need up-to-the-minute insights for live campaigns, confirm the update frequency before choosing a solution.
Are there privacy or security risks when connecting an X (Twitter) account?
Yes, connecting an X (Twitter) account to a third-party tool involves granting access permissions. Choose tools that use secure authentication, offer user access controls, and comply with your organization’s security standards to minimize risk.
What types of reports can I generate with an X (Twitter) analytics tool?
Most tools let you create reports on tweet performance, audience growth, engagement trends, and hashtag analytics. Many also offer custom report builders so you can tailor metrics and visualizations for different stakeholders.
Do X (Twitter) analytics tools work with other social media platforms?
Some X (Twitter) analytics tools are part of broader social media suites that support platforms like Facebook, Instagram, and LinkedIn. If you need cross-channel analytics, look for tools with multi-platform integration capabilities.
What’s Next:
If you're in the process of researching an X (Twitter) analytics tool, connect with a SoftwareSelect advisor for free recommendations.
You fill out a form and have a quick chat where they get into the specifics of your needs. Then you'll get a shortlist of software to review. They'll even support you through the entire buying process, including price negotiations.