10 Best Video Analytics Software Picked for 2026

Video Analytics Software Shortlist


Video analytics software helps you track, measure, and analyze how viewers interact with your video content across platforms. If you’re searching for the best video analytics software, you’re likely aiming to understand audience behavior, prove ROI, and make smarter decisions about your video strategy. With so many options, each offering different features for engagement tracking, reporting, and integration, it’s tough to know which tool fits your needs. This list will help you compare top solutions, so you can confidently choose the right platform to support your marketing goals and deliver actionable insights.
Why Trust Our Software Reviews
We’ve been testing and reviewing marketing software since 2022. As marketing experts ourselves, we know how critical and difficult it is to make the right decision when selecting software.
We invest in deep research to help our audience make better software purchasing decisions. We’ve tested more than 2,000 tools for different marketing use cases and written over 1,000 comprehensive software reviews. Learn how we stay transparent & our software review methodology.
Best Video Analytics Software Summary
This comparison chart summarizes pricing details for my top video analytics software selections to help you find the best one for your budget and business needs.
| Tool | Best For | Trial Info | Price | ||
|---|---|---|---|---|---|
| 1 | Best for branded video engagement insights | Free plan available | From $79/month (billed annually) | Website | |
| 2 | Best for creator-focused audience metrics | Free trial + free plan available | From $12/month (billed annually) | Website | |
| 3 | Best for sales and marketing video tracking | 14-day free trial + free demo available | From $59/seat/month (billed annually) | Website | |
| 4 | Best for education sector reporting | Free trial + free demo available | Pricing upon request | Website | |
| 5 | Best for live event performance monitoring | Free trial + free demo available | From $39/month (billed annually) | Website | |
| 6 | Best for enterprise-level content distribution | Free demo available | Pricing upon request | Website | |
| 7 | Best for privacy controls in video reporting | 30-day free trial available | From $10/month | Website | |
| 8 | Best for internal training content analysis | Free demo available | Pricing upon request | Website | |
| 9 | Best for OTT platform analytics | Free demo available | Pricing upon request | Website | |
| 10 | Best for cross-platform audience measurement | Free demo available | Pricing upon request | Website |
-

Demandbase
Visit WebsiteThis is an aggregated rating for this tool including ratings from Crozdesk users and ratings from other sites.4.4 -
6sense
Visit WebsiteThis is an aggregated rating for this tool including ratings from Crozdesk users and ratings from other sites.4.3 -
AnswerThePublic
Visit Website


Video Analytics Software Reviews
Below are my detailed summaries of the video analytics software that made it onto my shortlist. My reviews offer a detailed look at the features, best use cases, and integrations of each platform to help you find the best one for you.
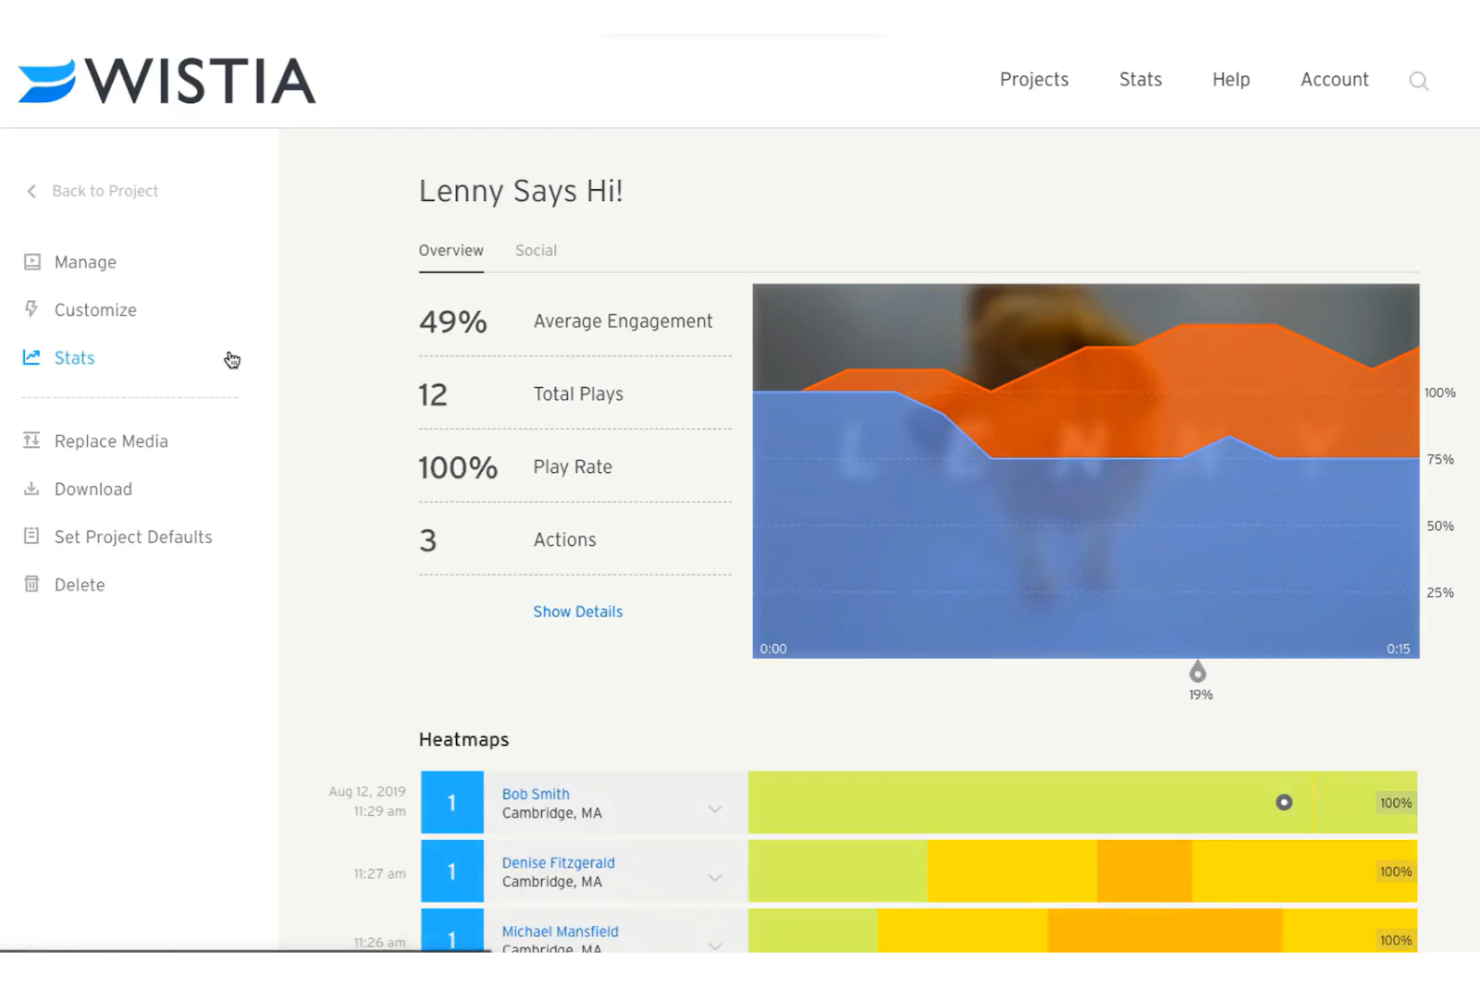
Wistia is built for marketers and content teams who want to measure branded video engagement across their owned channels. It’s especially useful for businesses focused on lead generation, audience retention, and understanding how viewers interact with their video content. If you need detailed engagement analytics to optimize your video marketing strategy, Wistia offers specialized tools for tracking and interpreting viewer behavior.
Why I Picked Wistia
What sets Wistia apart is its focus on branded video engagement insights, which is essential for marketers who want to understand how their content performs. I picked Wistia because it offers features like heatmaps that show exactly where viewers are most engaged or drop off, and detailed viewer tracking that connects video activity to individual leads. These analytics help you see which parts of your videos drive the most interest and which viewers are most likely to convert. For teams prioritizing brand storytelling and lead generation, Wistia’s analytics are purpose-built to deliver actionable engagement data.
Wistia Key Features
In addition to its engagement-focused analytics, Wistia offers several other features that support video marketing and measurement:
- Channel Customization: Lets you design branded video channels with your own colors, logos, and layouts.
- Lead Capture Forms: Allows you to embed customizable forms directly into your videos to collect viewer information.
- Integrations With Marketing Platforms: Connects with tools like HubSpot, Marketo, and Hootsuite for syncing video data with your marketing workflows.
- Video SEO Tools: Optimizes your videos for search engines by automatically generating video sitemaps and metadata.
Wistia Integrations
Integrations include HubSpot, Adobe Marketo Engage, ActiveCampaign, Drip, Keap, Hootsuite, and more.
Pros and Cons
Pros:
- Provides viewer-level analytics
- Embed lead capture forms in videos
- Heatmaps show exactly where viewers engage or drop off
Cons:
- Lacks real-time activity analytics
- Restricted video hosting limits
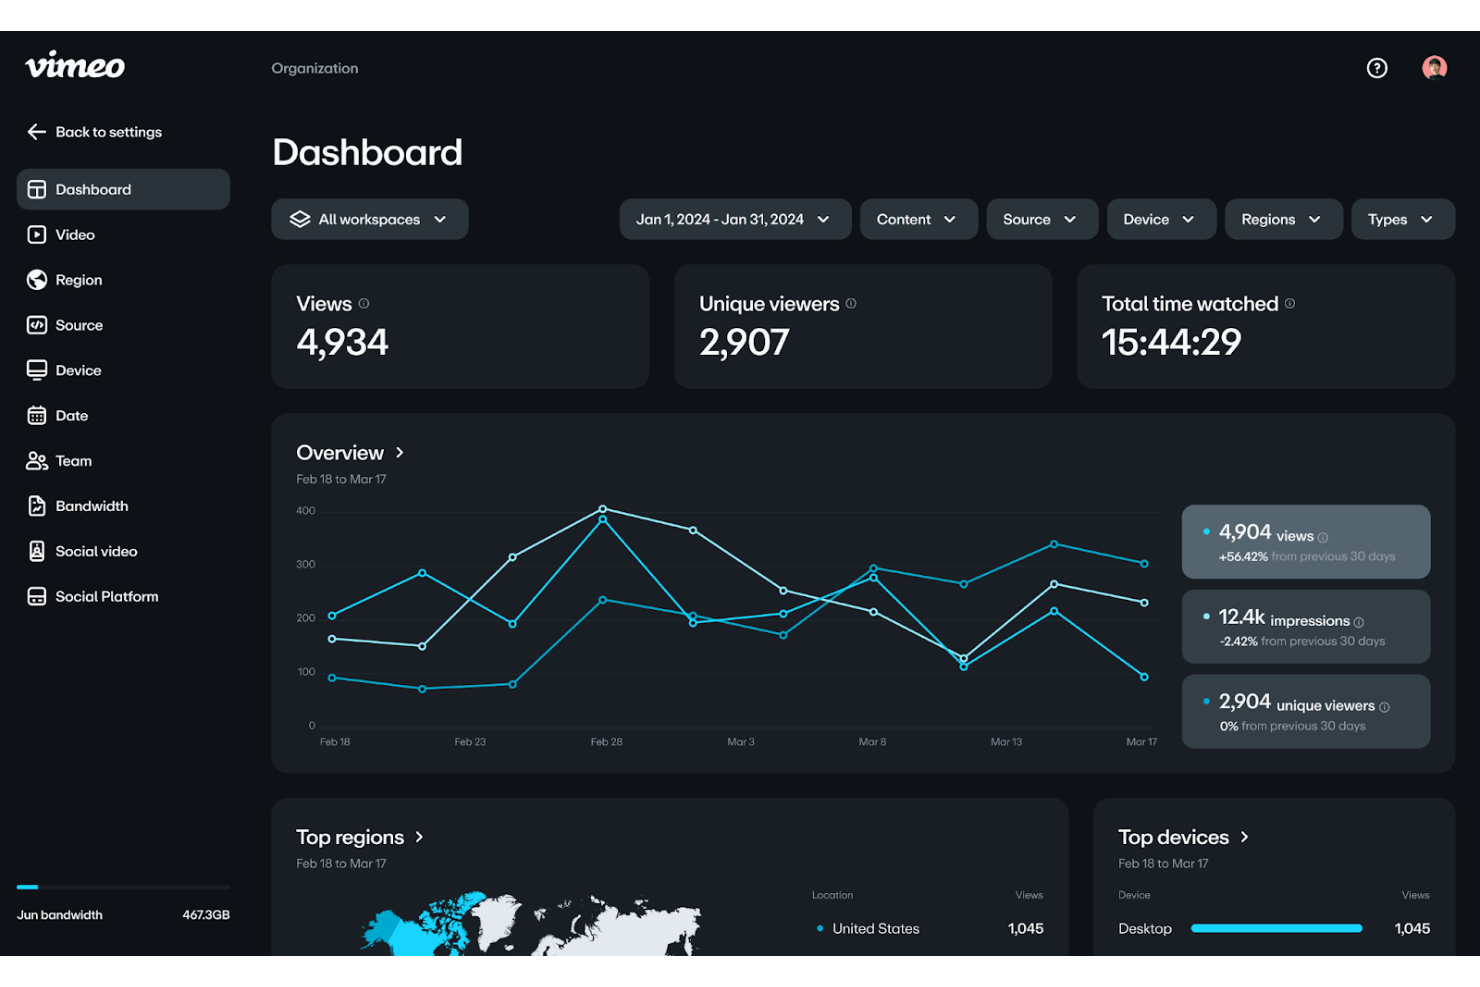
Vimeo is designed for creators, marketers, and businesses who want to dig into audience behavior and content performance. It’s especially useful for those who need detailed insights on viewer demographics, engagement, and playback locations across multiple channels. If you’re looking to optimize your video strategy with creator-focused metrics, Vimeo offers tools that help you understand exactly how your content resonates with different audiences.
Why I Picked Vimeo
Vimeo stands out for its focus on creator-centric audience metrics, which is especially valuable for content teams and independent creators. I picked Vimeo because it provides granular data on viewer demographics, playback locations, and device usage, helping you see exactly who’s watching and how they’re engaging. The platform also tracks engagement over time, so you can spot trends and adjust your content strategy based on real audience behavior. For anyone who wants to tailor their video content to specific audiences and measure impact across channels, Vimeo’s analytics are built to deliver those insights.
Vimeo Key Features
Some other features that make Vimeo useful for teams and creators include:
- Video Comparison Reports: Lets you compare performance metrics across multiple videos side by side.
- Engagement Graphs: Visualizes viewer drop-off points and average watch times for each video.
- Geographic Heatmaps: Shows where your viewers are located around the world.
- Exportable Analytics: Allows you to download detailed reports for further analysis or sharing.
Vimeo Integrations
Integrations include Tableau, Power BI, Google Analytics, Dropbox, HubSpot CRM, and more.
Pros and Cons
Pros:
- Exportable analytics for offline sharing
- Detailed per-viewer engagement data
- Can track the playback device
Cons:
- Slow analytics updates after publishing videos
- Real-time analytics for live events aren’t available
Vidyard is designed for sales and marketing teams that need to track how prospects and customers engage with their videos. It’s especially useful for B2B organizations and revenue teams that want detailed viewer insights to inform follow-up and campaign strategy. With a focus on video tracking for sales and marketing, Vidyard helps you see exactly who’s watching, for how long, and what actions they take next.
Why I Picked Vidyard
What sets Vidyard apart for sales and marketing video tracking is its ability to deliver detailed viewer-level analytics that go beyond basic engagement metrics. I picked Vidyard because it lets you see exactly who watched your videos, how much they watched, and when they dropped off—information that’s crucial for sales follow-up and lead scoring. The tool also offers video heatmaps and notifications when prospects engage, so your team can act on real-time insights. For anyone focused on using video to drive pipeline and revenue, Vidyard’s analytics are purpose-built for those needs.
Vidyard Key Features
In addition to its sales-focused tracking capabilities, I also found these features valuable:
- Custom Video Hubs: Create branded video libraries for sharing with prospects or customers.
- A/B Video Testing: Test different video versions to compare engagement and performance.
- CRM Integration: Connect video analytics directly to platforms like Salesforce and HubSpot.
- Automated Video Transcriptions: Generate searchable text transcripts for every uploaded video.
Vidyard Integrations
Integrations include Salesloft, HubSpot, Salesforce, Pipedrive, Gmail, Outplay, and more.
Pros and Cons
Pros:
- Personalized video thumbnail creation tools
- Real-time viewer behavior push notifications
- Direct CRM and HubSpot data syncing
Cons:
- Limited mobile application functionality
- Basic native video editing capabilities
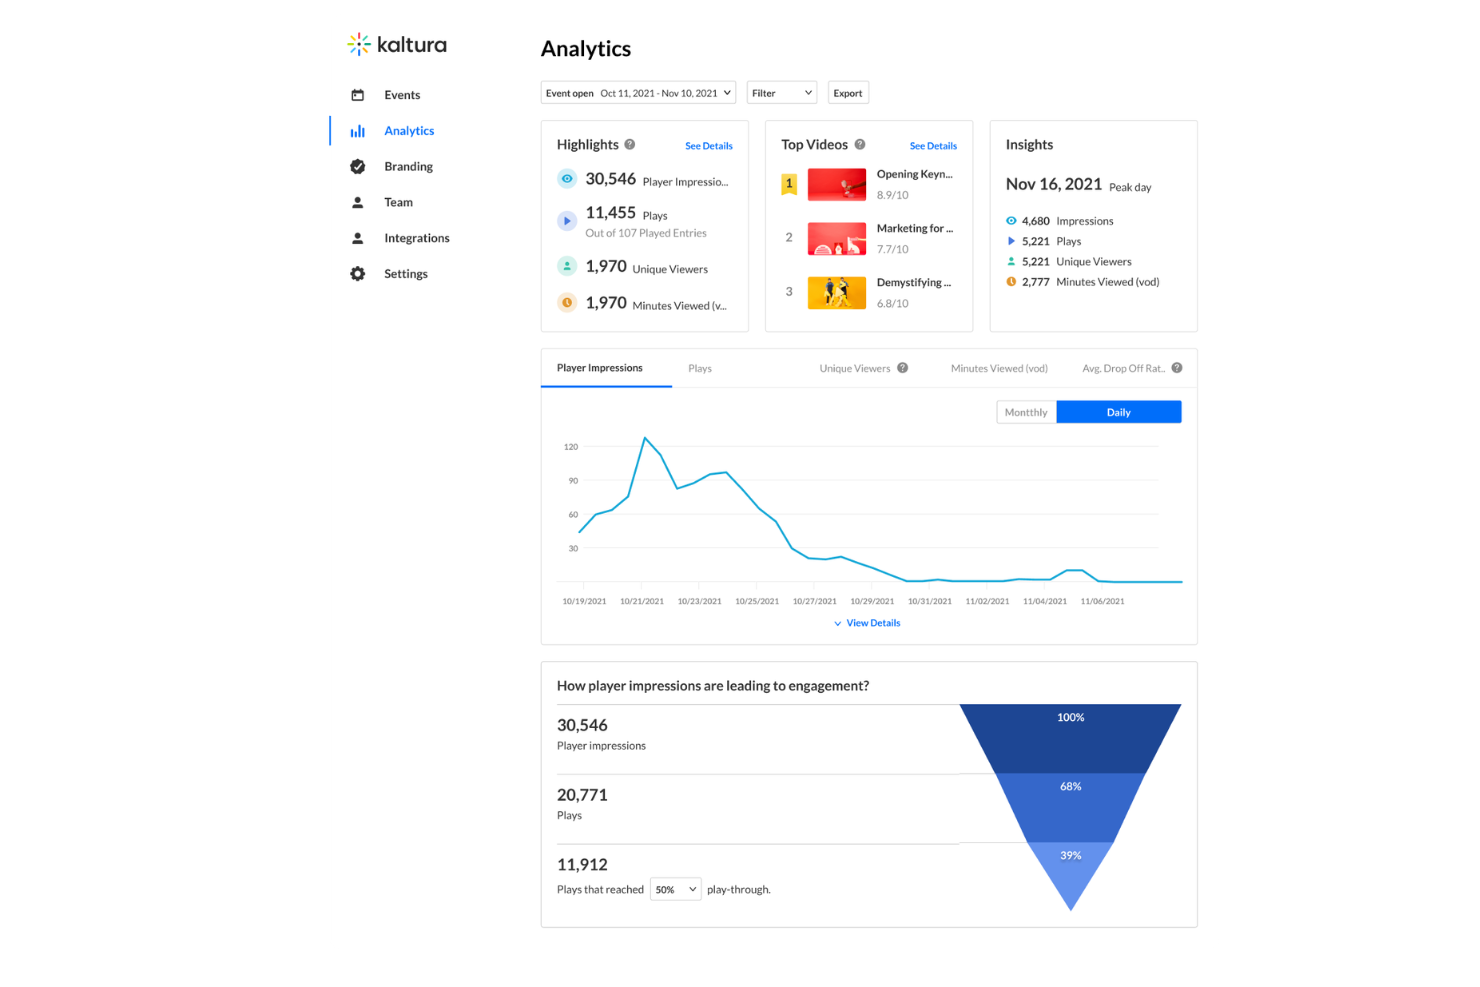
Designed with the needs of educational institutions in mind, Kaltura offers advanced video analytics tailored for schools, universities, and online learning platforms. It’s especially useful for academic administrators and instructional designers who need to track student engagement and content effectiveness. Kaltura’s reporting tools help you measure learning outcomes and optimize video-based teaching strategies.
Why I Picked Kaltura
Kaltura caught my attention because of its focus on education sector reporting and analytics. The platform offers granular engagement metrics, letting you track student participation, video drop-off points, and content completion rates. I appreciate how Kaltura’s analytics dashboard is designed to help educators and administrators measure learning outcomes and identify areas for instructional improvement. These features make Kaltura a strong choice for schools and universities that need actionable insights from their video content.
Kaltura Key Features
Some other features that make Kaltura useful for video analytics include:
- Interactive Video Quizzing: Add quizzes directly into videos to assess learner understanding in real time.
- Automated Captioning and Transcription: Generate searchable captions and transcripts for all video content.
- Role-Based Access Controls: Assign permissions to users based on their role within your organization.
- Live Streaming Analytics: Monitor real-time engagement and viewer statistics during live events.
Kaltura Integrations
Integrations include InPlayer, Kollective, Hive, Oracle, Microsoft Teams, WordPress, 3Play Media, and more.
Pros and Cons
Pros:
- Cross-event engagement analytics dashboards
- Granular user activity and interaction reports
- Deep integration with learning platforms
Cons:
- Buffering issues during file uploads
- Cumbersome initial platform setup process
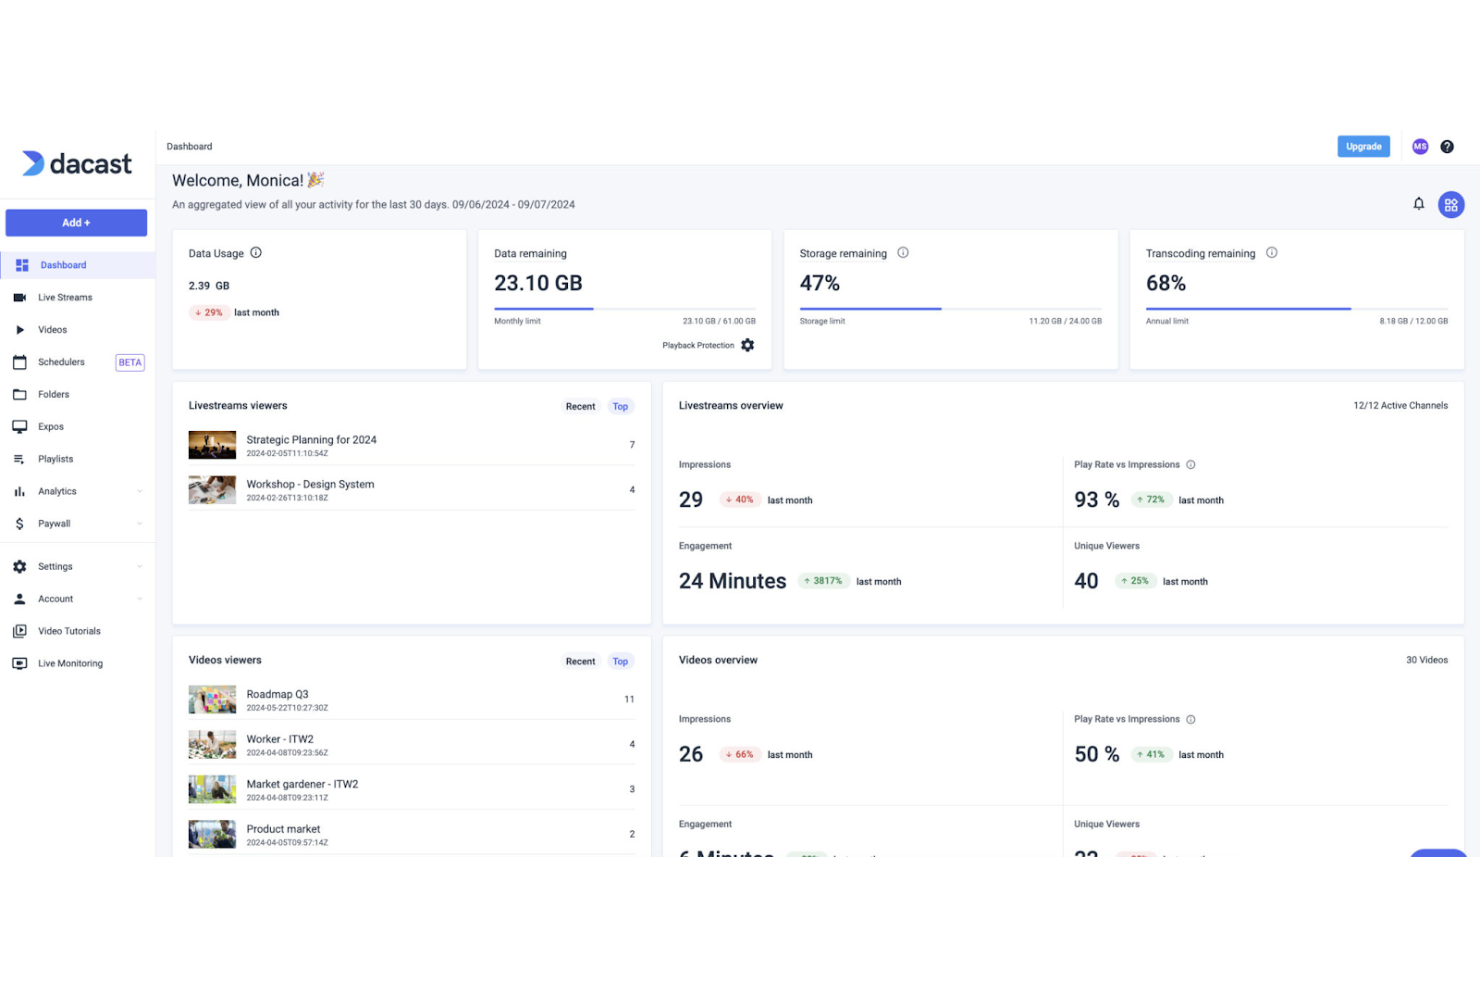
Dacast is designed for teams that need to monitor live event performance in real time. It’s especially useful for broadcasters, event organizers, and media companies who rely on uninterrupted streaming and actionable analytics during live broadcasts. With Dacast, you can track audience engagement, stream health, and viewer locations as your event unfolds.
Why I Picked Dacast
What sets Dacast apart is its focus on live event performance monitoring, which is essential for anyone running high-stakes broadcasts. I picked Dacast because it provides real-time analytics on stream health, viewer count, and geographic distribution, so you can respond quickly if issues arise during a live event. The platform also offers bitrate and device tracking, helping you optimize the viewing experience for your audience as the event unfolds. These features make Dacast a strong choice for organizations that can’t afford downtime or blind spots during live streaming.
Dacast Key Features
Some other features that make Dacast useful for video analytics include:
- Monetization Tools: Enable pay-per-view, subscriptions, or ad-supported streaming for your live and on-demand content.
- White-Label Player: Use a customizable video player that removes Dacast branding for a branded viewing experience.
- API Access: Integrate Dacast’s analytics and streaming capabilities into your own applications or workflows.
- Geo-Restriction Controls: Limit access to your streams based on viewer location for added content security.
Dacast Integrations
Integrations include InPlayer, Akamai, vMix, Edgio, and more.
Pros and Cons
Pros:
- Reliable live-to-VOD recording capabilities
- Integrated paywall for direct monetization
- Centralized audience and revenue analytics
Cons:
- High latency in certain regions
- Lack of session-level playback data
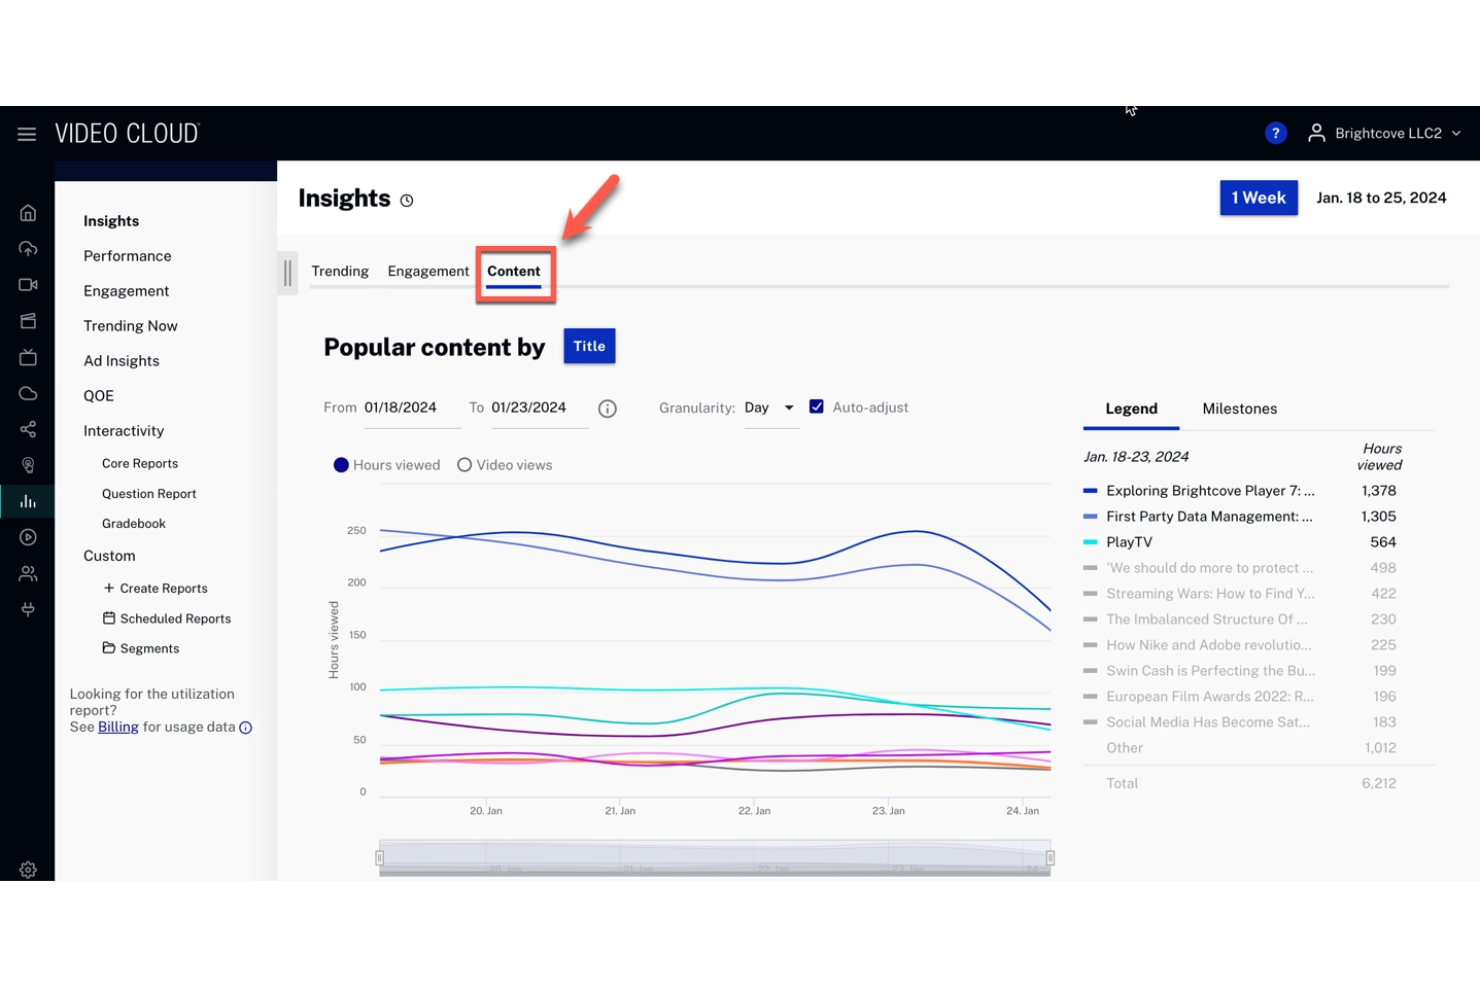
Brightcove Analytics is built for enterprises and large organizations that need to manage and measure video content at scale. It’s especially relevant for media companies, broadcasters, and global brands looking to track distribution and audience engagement across multiple channels. With a focus on enterprise-level content distribution, Brightcove helps teams understand how their video strategy performs in complex, high-volume environments.
Why I Picked Brightcove Analytics
For organizations distributing video content at an enterprise scale, Brightcove Analytics offers the depth and flexibility needed to manage complex video ecosystems. I picked Brightcove because it provides advanced audience segmentation and real-time analytics, which are essential for tracking performance across multiple channels and regions. The platform also supports granular content performance reporting, so you can drill down into specific assets or campaigns. If your team needs to monitor large-scale video distribution and make data-driven decisions, Brightcove’s analytics are designed to handle those demands.
Brightcove Analytics Key Features
Some other features that make Brightcove Analytics valuable for enterprise teams include:
- Customizable Dashboards: Lets you tailor analytics views to match your team’s reporting needs.
- Ad Performance Tracking: Measures ad impressions, click-through rates, and revenue from video ads.
- Viewer Retention Analysis: Shows how long audiences stay engaged with your content.
- Content Syndication Reporting: Tracks video performance across third-party platforms and partner sites.
Brightcove Analytics Integrations
Integrations include Acquia DAM, Adobe Commerce, Accedo One, Frammer AI, Stripe, Aptitude, and more.
Pros and Cons
Pros:
- Integrates with marketing technology stack
- Advanced scheduled performance reporting tools
- AI-powered automated video metadata generation
Cons:
- Support response times can vary
- Occasional bugs in text editing
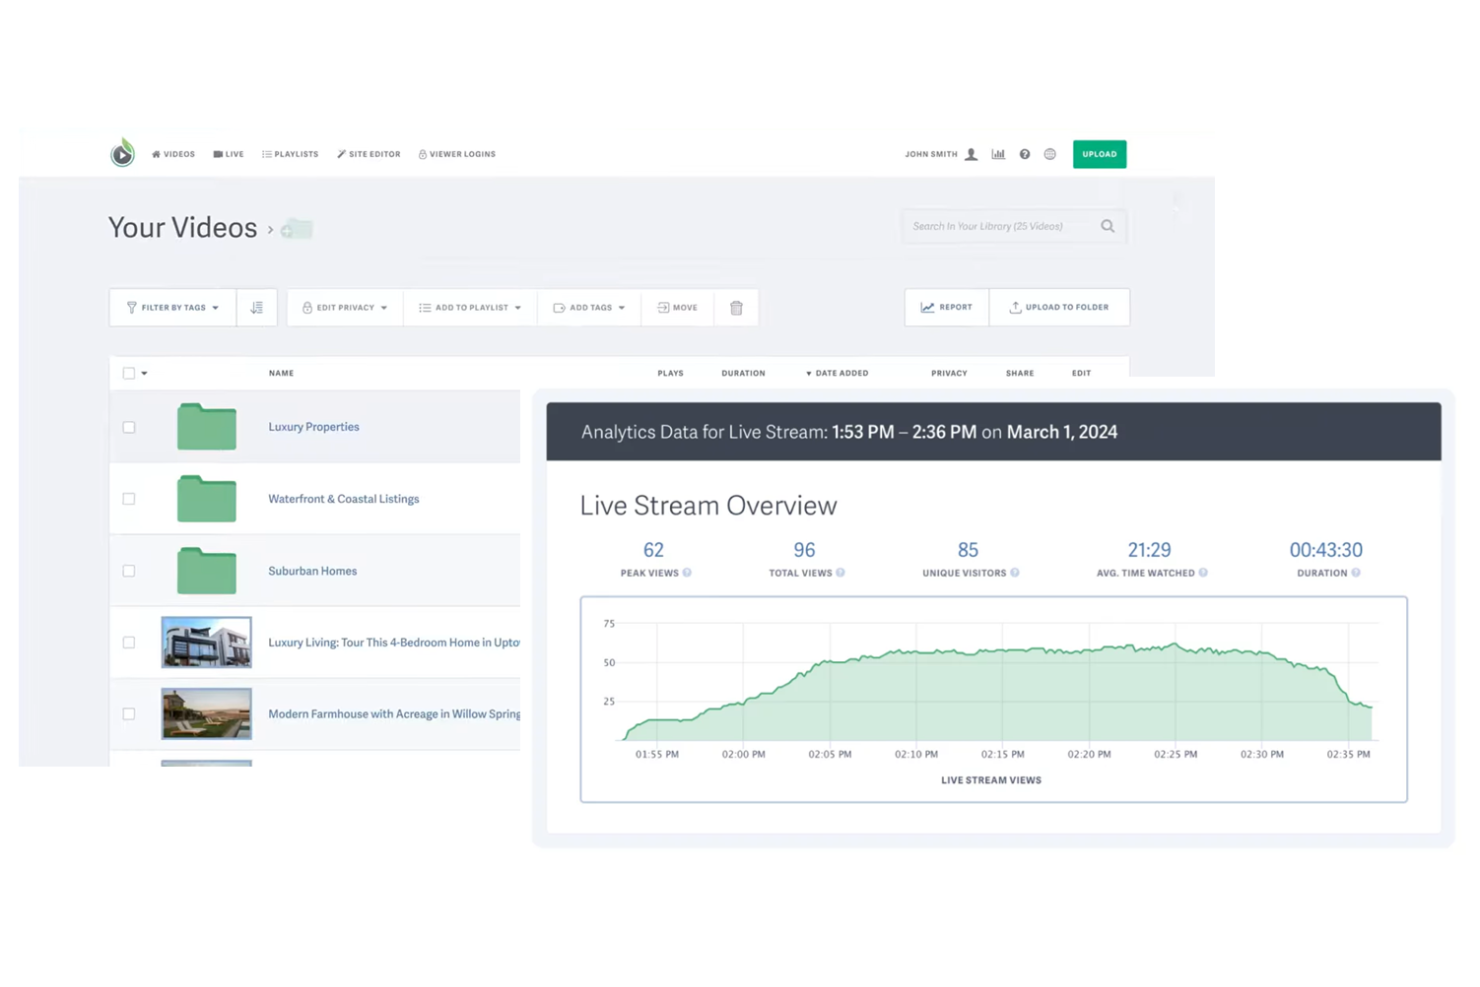
SproutVideo stands out for organizations that need strict privacy controls in their video analytics and reporting. It’s a strong fit for businesses in regulated industries or those handling sensitive internal communications. With advanced privacy settings and detailed access controls, SproutVideo helps you manage who can view, share, and report on your video content.
Why I Picked SproutVideo
For teams that need to prioritize privacy in their video analytics, SproutVideo offers controls that go beyond what most platforms provide. I picked SproutVideo because it lets you set granular viewer permissions, restrict access by IP address, and require password protection for sensitive videos. The platform also supports detailed audit logs, so you can track exactly who accessed each video and when. These privacy-focused features make SproutVideo a strong choice for organizations with strict compliance or confidentiality requirements.
SproutVideo Key Features
Some other features that make SproutVideo appealing for video analytics include:
- Customizable Video Players: Adjust the look and feel of your video player to match your brand.
- Detailed Engagement Reports: Access metrics on viewer drop-off points, play rates, and geographic data.
- Lead Capture Forms: Add forms directly to videos to collect viewer information.
- Video Embedding Controls: Limit where your videos can be embedded to prevent unauthorized sharing.
SproutVideo Integrations
Integrations include Drip, HubSpot, Mailchimp, Keap, and more.
Pros and Cons
Pros:
- Simple and clean presentation interface
- Secure tokenized links for private sharing
- Insightful minute-by-minute viewer engagement stats
Cons:
- No video editing tools for post-upload adjustments
- Video upload and bandwidth limits
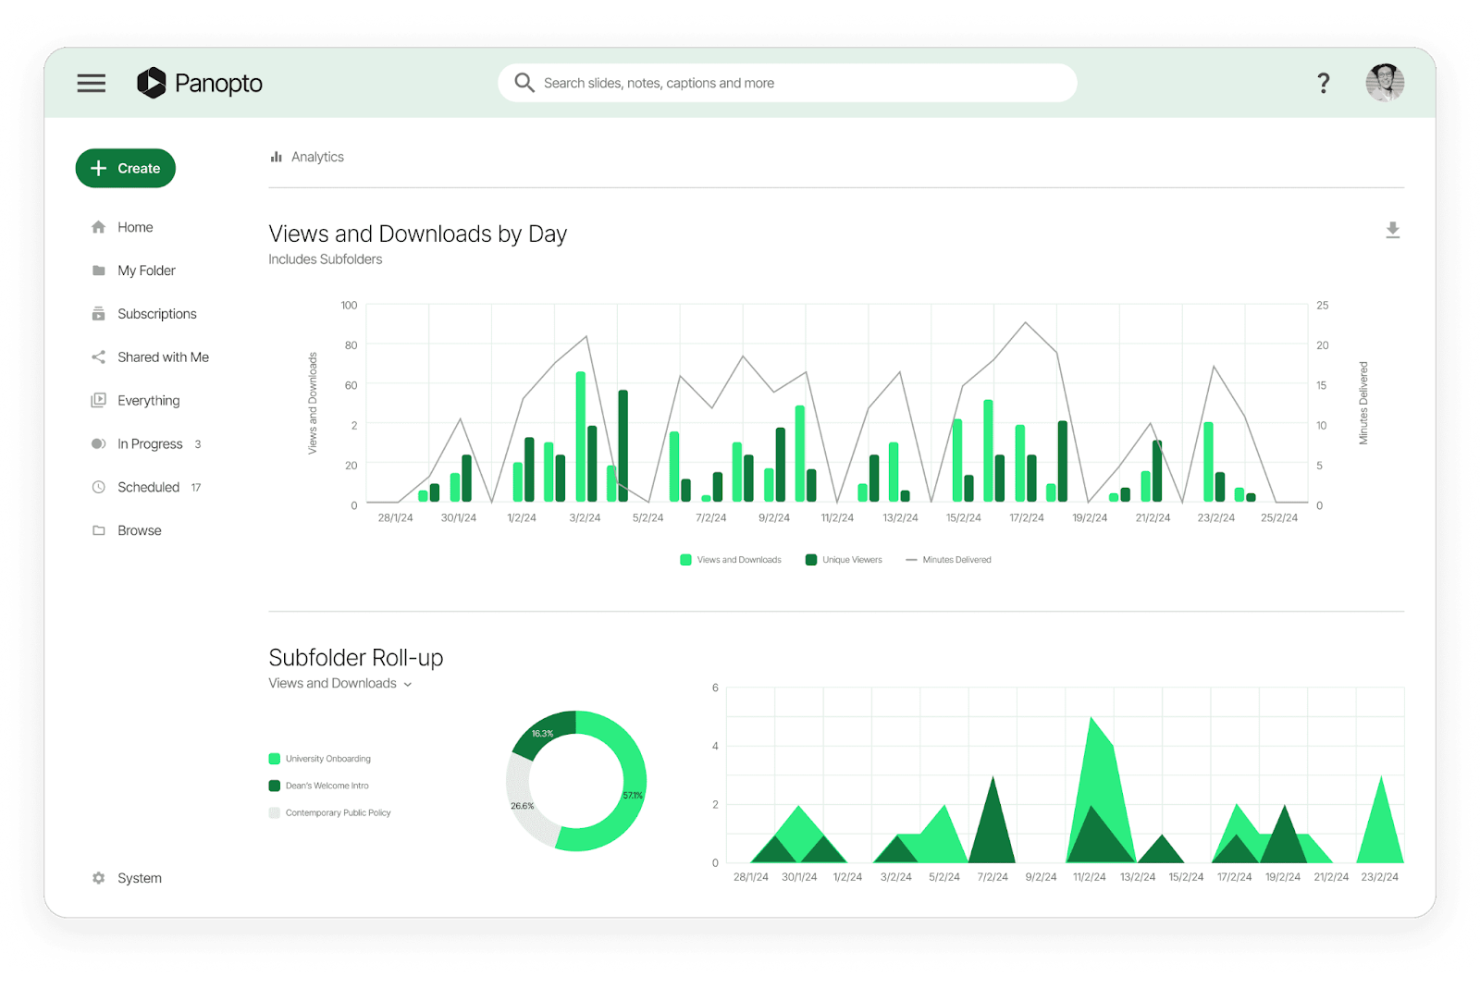
Panopto is built for organizations that need to analyze and manage internal training videos at scale. It’s a strong fit for HR teams, learning and development professionals, and corporate trainers who want to track engagement and knowledge retention across their workforce. Panopto’s searchable video library and detailed analytics help you understand how employees interact with training content and where improvements are needed.
Why I Picked Panopto
For teams focused on internal training, Panopto stands out because of its specialized analytics for learning content. I picked Panopto since it offers detailed insights into viewer engagement, quiz results, and completion rates for training videos. The platform’s video search functionality also lets you pinpoint exactly where employees are engaging or dropping off within specific content. These features make Panopto a strong choice for organizations that need to measure and improve the effectiveness of their internal training programs.
Panopto Key Features
Some other features that make Panopto valuable for video analytics include:
- Automated Video Captioning: Generate searchable captions for all uploaded videos to improve accessibility and discoverability.
- User Permission Controls: Set granular access levels for individuals or groups to manage who can view, edit, or share content.
- Integration With Learning Management Systems (LMS): Connect Panopto with platforms like Moodle, Canvas, and Blackboard for training workflows.
- Mobile Video Upload: Allow users to record and upload training videos directly from their mobile devices.
Panopto Integrations
Integrations include Blackboard, Moodle, Slack, Zoom, Salesforce, Copilot, 3Play Media, and more.
Pros and Cons
Pros:
- Integrated learner checks and quizzes
- Automated multi-camera lecture capture tools
- AI-powered in-video keyword search functionality
Cons:
- Lack of pricing transparency
- Interface optimized primarily for web
JWX specializes in analytics for over-the-top (OTT) platforms, making it a strong fit for media companies and streaming services. If you need to track viewer behavior, content performance, and monetization across multiple devices, JWX offers tailored solutions. Its focus on OTT analytics helps you optimize user experience and maximize revenue from digital video content.
Why I Picked JWX
For teams focused on OTT platform analytics, JWX stands out with its specialized tracking and reporting tools built for streaming environments. The platform offers detailed insights into viewer engagement, device usage, and content consumption patterns across smart TVs, mobile devices, and web players. I picked JWX because it helps media companies and streaming services understand how audiences interact with their content in real time. These analytics are especially valuable for optimizing programming, ad placements, and user experience on OTT platforms.
JWX Key Features
Some other features that make JWX useful for video analytics include:
- Customizable Dashboard Widgets: Configure dashboards with widgets that display the metrics most relevant to your team.
- Real-Time Alerting: Set up alerts for anomalies or spikes in viewer activity as they happen.
- Ad Performance Tracking: Monitor ad impressions, completion rates, and revenue metrics within your OTT content.
- API Access for Data Export: Export analytics data to external systems or custom reports using a dedicated API.
JWX Integrations
Integrations include Accedo, 2Coders, Acquia, Cleeng, and more.
Pros and Cons
Pros:
- Fast rendering and transcoding speeds
- Real-time player and video performance slicing
- Snappy and responsive management interface
Cons:
- Overkill for non-OTT video use cases
- No easy clickable link addition
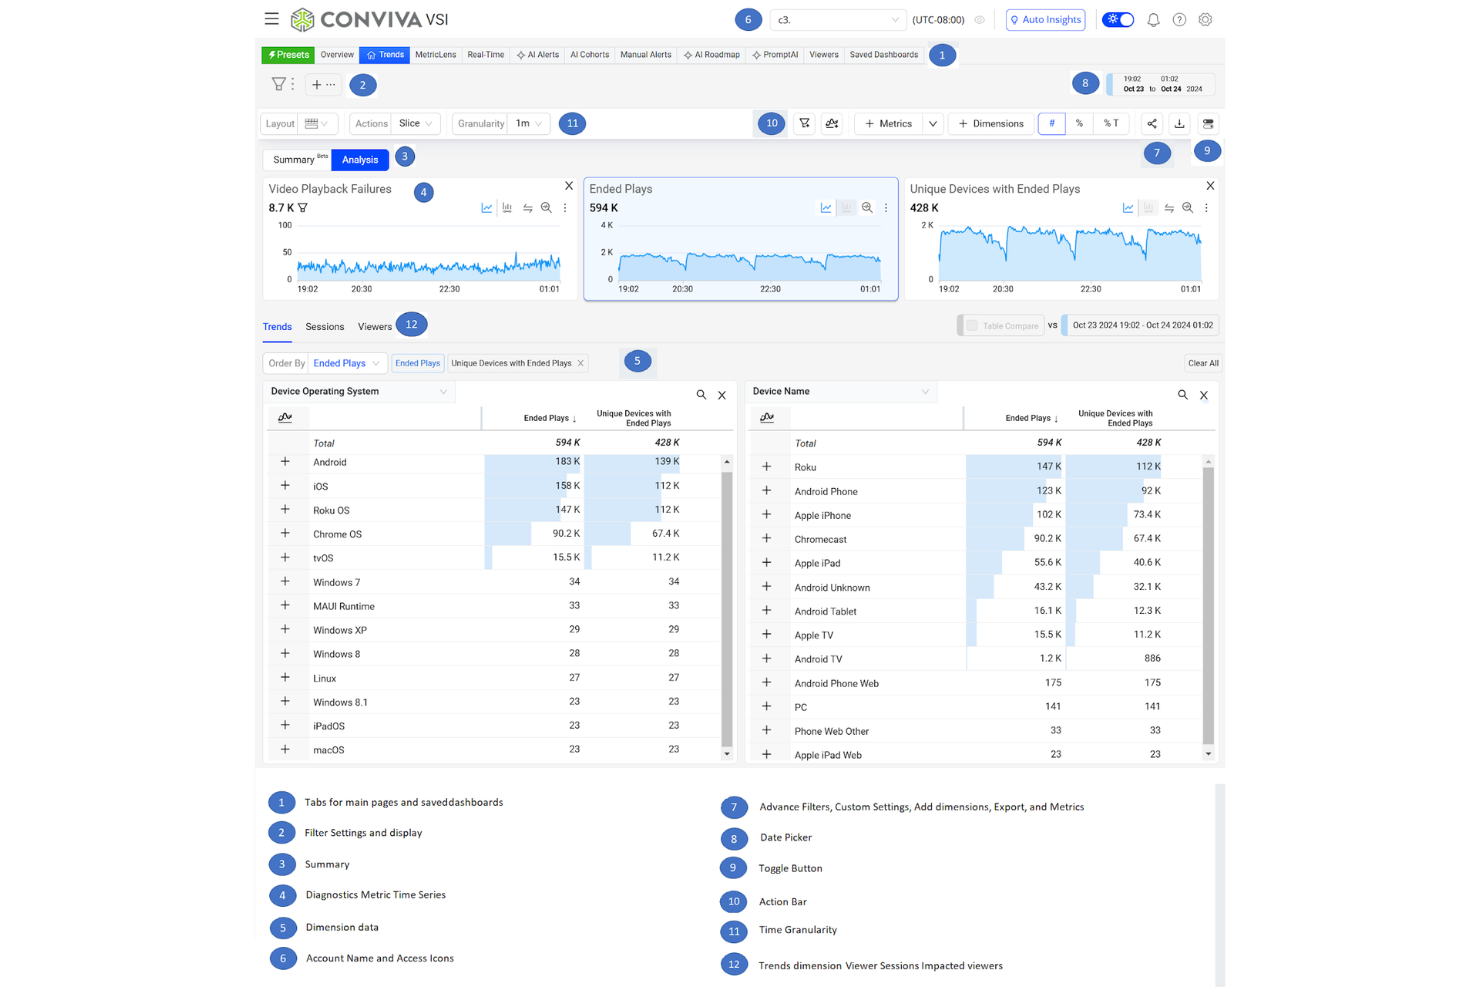
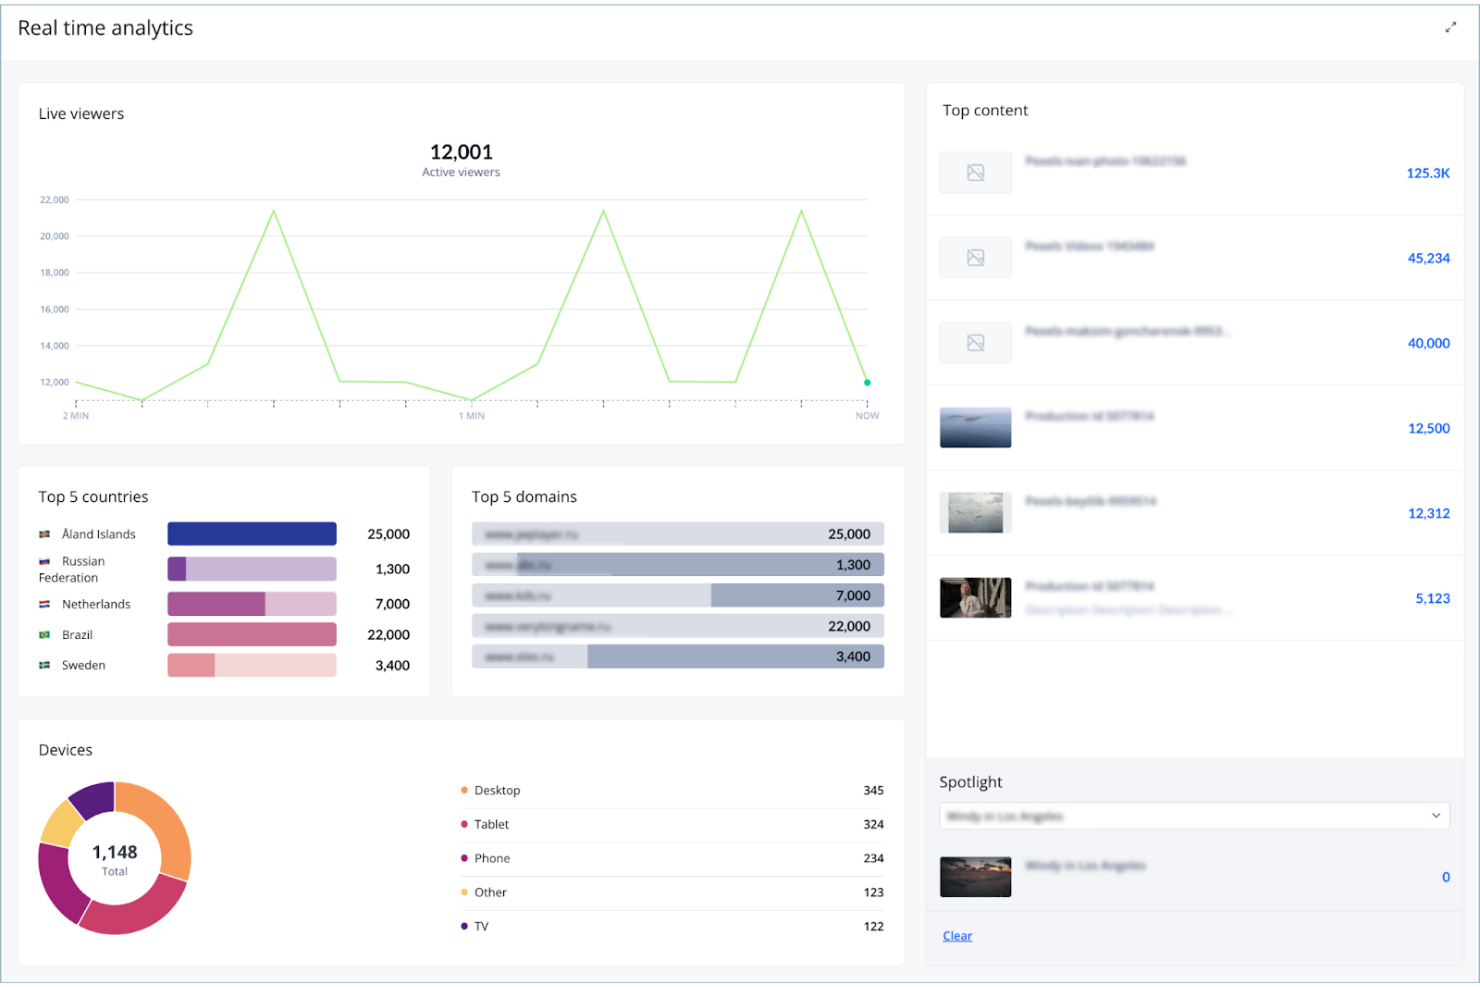
If you need to measure video audiences across multiple platforms and devices, Conviva offers unified analytics built for this challenge. The platform is designed for broadcasters, streaming services, and media companies that want a single view of audience behavior and engagement. Conviva stands out by connecting data from smart TVs, mobile apps, and web players into one cross-platform measurement solution.
Why I Picked Conviva
For teams that need to understand audience behavior across every screen, Conviva delivers unified measurement that’s hard to match. I picked Conviva because it collects and normalizes data from smart TVs, mobile devices, desktops, and set-top boxes, giving you a single source of truth for cross-platform analytics. Its real-time dashboards let you compare engagement and quality metrics side by side, no matter where your viewers are watching. This approach is especially valuable for media companies and streaming services that need to report on total reach and audience overlap across fragmented viewing environments.
Conviva Key Features
Some other features that make Conviva useful for video analytics teams include:
- Automated Alerting: Receive instant notifications when streaming quality or audience engagement drops below set thresholds.
- Ad Performance Analytics: Track ad impressions, viewability, and completion rates across all platforms.
- Content Performance Comparison: Compare how different shows, episodes, or live events perform in terms of audience and engagement.
- Session-Level Diagnostics: Drill down into individual viewer sessions to analyze playback issues and user experience in detail.
Conviva Integrations
Integrations include BigPanda, PagerDuty, Datadog, and more.
Pros and Cons
Pros:
- Proactive personalized training and support
- AI-powered anomaly detection for quality
- Real-time full-census client-side telemetry
Cons:
- Restrictive time range monitoring options
- Complex and technical integration process
Other Video Analytics Software
Here are some additional video analytics software options that didn’t make it onto my shortlist, but are still worth checking out:
- NPAW
For multi-platform streaming insights
- Meltwater
For brand sentiment analysis
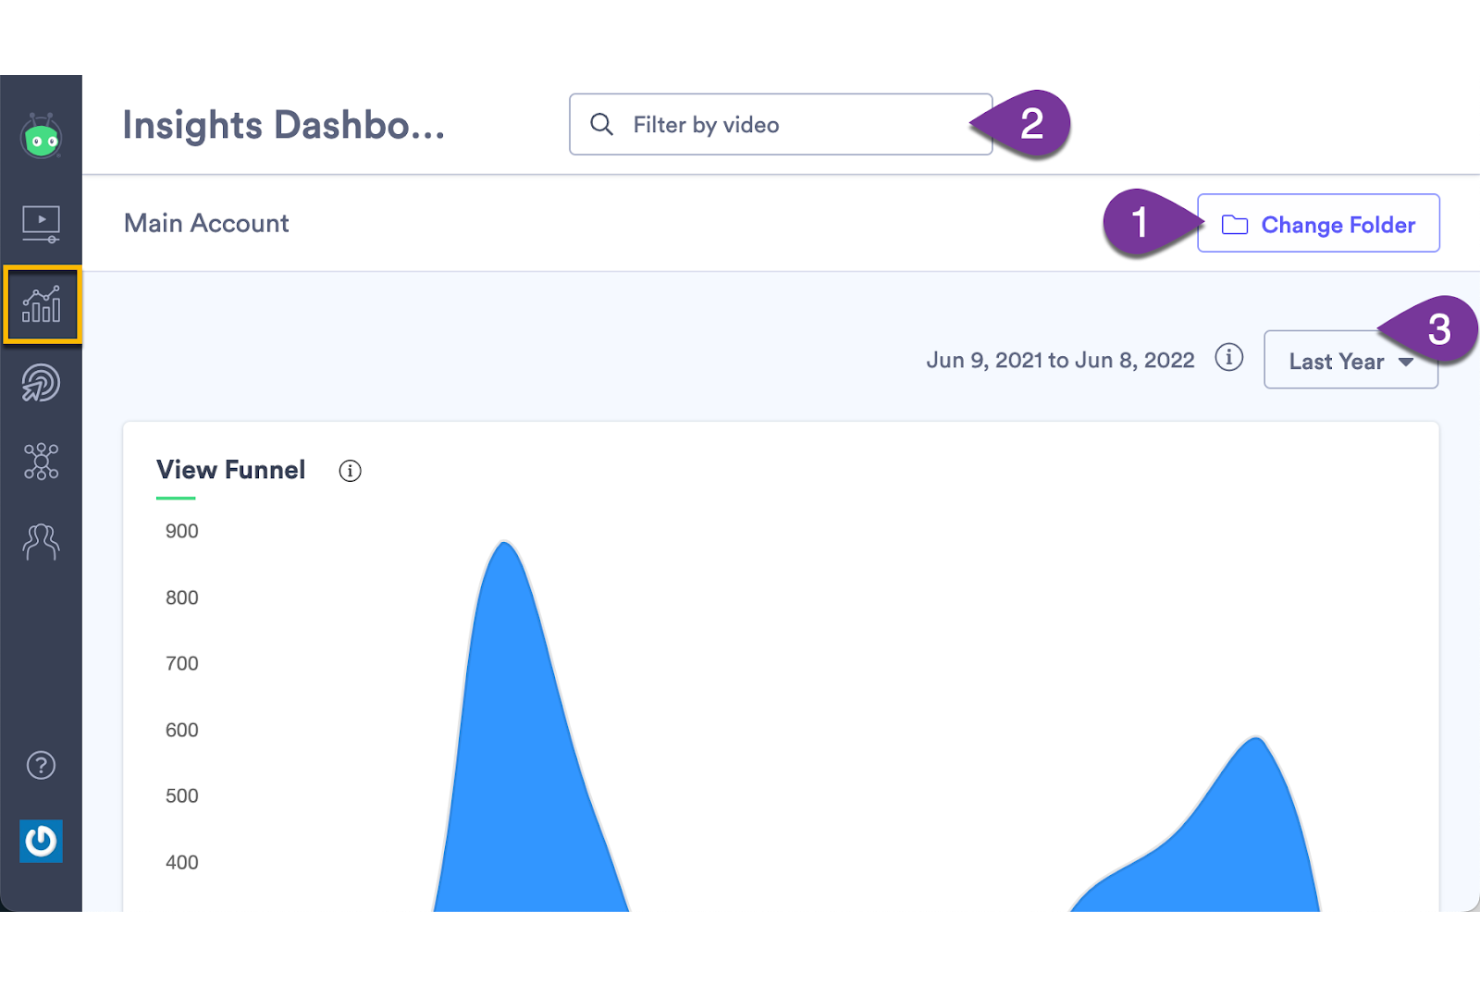
- TwentyThree
For entire video funnel tracking
- Vidzflow
For Webflow integration


Video Analytics Software Selection Criteria
When selecting the best video analytics software to include in this list, I considered common buyer needs and pain points like tracking cross-platform viewer engagement and diagnosing streaming quality issues. I also used the following framework to keep my evaluation structured and fair:
Core Functionality (25% of total score)
To be considered for inclusion in this list, each solution had to fulfill these common use cases:
- Track video views and audience engagement
- Monitor playback quality and buffering events
- Report on device and platform usage
- Analyze viewer retention and drop-off rates
- Export analytics data for further analysis
Additional Standout Features (25% of total score)
To help further narrow down the competition, I also looked for unique features, such as:
- Real-time alerting for streaming issues
- Session-level diagnostics for individual viewers
- Automated ad performance tracking
- Customizable dashboards and reporting
- AI-driven anomaly detection
Usability (10% of total score)
To get a sense of the usability of each system, I considered the following:
- Simple and intuitive dashboard navigation
- Clear data visualizations and charts
- Logical menu structure and labeling
- Responsive interface with minimal lag
- Easy access to frequently used features
Onboarding (10% of total score)
To evaluate the onboarding experience for each platform, I considered the following:
- Availability of step-by-step setup guides
- Access to training videos and documentation
- Interactive product tours for new users
- Pre-built templates for common analytics needs
- Live chat or onboarding webinars
Customer Support (10% of total score)
To assess each software provider’s customer support services, I considered the following:
- 24/7 support availability
- Fast response times to inquiries
- Access to a searchable knowledge base
- Dedicated account managers for enterprise clients
- Community forums for peer support
Value For Money (10% of total score)
To evaluate the value for money of each platform, I considered the following:
- Transparent and competitive pricing
- Flexible plans for different business sizes
- No hidden fees or surprise charges
- Free trials or demos available
- Features included at each pricing tier
Customer Reviews (10% of total score)
To get a sense of overall customer satisfaction, I considered the following when reading customer reviews:
- Positive feedback on analytics accuracy
- Reports of reliable platform uptime
- Comments on ease of integration
- User satisfaction with support quality
- Noted improvements in video performance tracking
How to Choose Video Analytics Software
It’s easy to get bogged down in long feature lists and complex pricing structures. To help you stay focused as you work through your unique software selection process, here’s a checklist of factors to keep in mind:
| Factor | What to Consider |
|---|---|
| Scalability | Will the software handle your current and projected video traffic across all platforms and devices? |
| Integrations | Does it connect natively with your existing video players, ad servers, and data warehouses? |
| Customizability | Can you tailor dashboards, reports, and alerts to your team’s specific KPIs and workflows? |
| Ease of use | Will your team be able to access and interpret analytics without extensive training or support? |
| Implementation and onboarding | How long will it take to deploy, and what resources or technical skills are required to get started? |
| Cost | Are pricing tiers clear, and do they align with your usage patterns and budget constraints? |
| Security safeguards | Does the platform meet your organization’s data privacy and security standards, such as GDPR? |
| Support availability | What support channels are offered, and are they available during your business-critical hours? |
What Is Video Analytics Software?
Video analytics software is a tool that tracks, measures, and reports on how viewers interact with video content across digital platforms. It collects data on metrics like views, watch time, audience demographics, and playback quality. Marketing teams use this software to understand viewer behavior, optimize content strategy, and diagnose streaming or engagement issues.
While often associated with physical security and surveillance systems—using security cameras and cctv to monitor potential threats—video analytics software in a business context is much broader. It includes everything from video management systems (VMS) used to streamline operations to marketing tools that track engagement.
Features
When selecting video analytics software, keep an eye out for the following key features:
- AI-powered video analytics: Use artificial intelligence and machine learning to automatically identify patterns in video streams, such as viewer sentiment.
- Real-time dashboards: Display up-to-the-minute data from live video feeds on viewer activity, engagement, and playback quality so teams can monitor performance as it happens.
- Audience segmentation: Use deep learning algorithms to break down viewers by demographics, location, device, or behavior to better understand how different groups engage.
- Playback quality monitoring: Track metrics across players, like buffering, start time, and resolution, to identify and address streaming issues that impact user experience.
- Retention and drop-off analysis: Visualize where viewers stop watching video footage to pinpoint content or technical issues that cause audience loss.
- Multi-platform tracking: Collect and unify data from cloud-based apps, web, mobile, and smart TVs to provide a complete view of audience behavior across all surveillance systems or distribution channels.
- Ad performance measurement: Monitor ad impressions, viewability, and completion rates to evaluate the effectiveness of video advertising campaigns.
- Custom reporting: Build and export tailored reports from your video management software that focus on the metrics and timeframes most relevant to your team’s goals.
- Session-level analytics: Drill down into individual viewing sessions to investigate specific user experiences, troubleshoot playback problems, or analyze motion detection triggers in interactive content.
Benefits
Implementing video analytics software provides several benefits for your team and your business. Here are a few you can look forward to:
- Improved content strategy: Use audience segmentation and retention analysis to identify what resonates with viewers and refine your video content accordingly.
- Faster issue resolution: Rely on real-time alerts and playback quality monitoring to quickly detect and address streaming or technical problems before they impact your ROI.
- Better audience understanding: Leverage multi-platform tracking and session-level diagnostics to gain a complete picture of who your viewers are and how they engage with your video management software.
- Optimized ad performance: Monitor ad impressions and completion rates across existing cameras and digital players to maximize the effectiveness of your video advertising campaigns.
- Data-driven decision making: Access custom reporting and exportable analytics to support marketing, product, and business strategy with an informed decision backed by concrete evidence.
- Increased operational efficiency: Manage your workflows by automating data collection, allowing your team to focus on high-level strategy rather than manual reporting.
- Better situational awareness: Use real-time video data to understand the context of viewer behavior, helping you anticipate market trends or identify potential threats to customer retention.
- Increased viewer retention: Identify drop-off points and playback issues to make targeted improvements that keep audiences watching longer.
Costs and Pricing
Selecting video analytics software requires an understanding of the various pricing models and plans available. Costs vary based on features, team size, add-ons, and more. The table below summarizes common plans, their average prices, and typical features included in video analytics software solutions:
Plan Comparison Table for Video Analytics Software
| Plan Type | Average Price | Common Features |
|---|---|---|
| Free Plan | $0 | Basic view tracking, limited dashboard access, and standard reporting. |
| Personal Plan | $10–$50/user/month | Core analytics, playback quality monitoring, and basic audience segmentation. |
| Business Plan | $100–$500/month | Multi-platform tracking, custom reporting, ad performance analytics, and team collaboration tools. |
| Enterprise Plan | $1,000–$5,000+/month | Advanced integrations, session-level diagnostics, dedicated support, and enhanced security controls. |
Video Analytics Software FAQs
Here are some answers to common questions about video analytics software:
Can video analytics software track viewers across multiple devices?
Yes, most video analytics software can track viewers across web, mobile, and smart TV platforms. This helps you understand how audiences engage with your content on different devices and provides a unified view of user behavior.
How does video analytics software help diagnose streaming issues?
Video analytics software monitors playback quality metrics like buffering, start time, and resolution. By analyzing these metrics, you can quickly identify and address technical problems that impact the viewer experience.
Is it possible to integrate video analytics software with other marketing tools?
Yes, many video analytics platforms offer integrations with marketing automation, CRM, and data warehouse tools. This allows you to combine video engagement data with other marketing insights for a more complete view of your audience.
What data privacy considerations should I keep in mind?
You should ensure the software complies with relevant data privacy regulations, such as GDPR. Check how user data is collected, stored, and processed, and confirm that the platform offers necessary security safeguards.
Do I need technical expertise to set up video analytics software?
Some solutions require technical setup, especially for custom integrations or advanced features. However, many platforms offer onboarding guides, templates, and support to help non-technical users get started.
What’s Next:
If you're in the process of researching video analytics software, connect with a SoftwareSelect advisor for free recommendations.
You fill out a form and have a quick chat where they get into the specifics of your needs. Then you'll get a shortlist of software to review. They'll even support you through the entire buying process, including price negotiations.