14 Instagram Reporting Tools to Use in 2026

Instagram Reporting Tool Shortlist
Here’s my shortlist of Instagram reporting tools:


An Instagram reporting tool is an analytics tool that collects, analyzes, and visualizes data from your social media accounts to help you track performance and measure results. If you’re searching for the best Instagram reporting tool, you likely need to prove ROI, monitor campaign impact, and share monthly reports with your team or clients. Many platforms offer all-in-one dashboards with AI-powered features that surface key metrics and deliver actionable insights to improve your marketing efforts. With capabilities like automated reporting and customizable templates, these tools help you streamline analysis and decision-making. This guide breaks down the top Instagram reporting tools for 2026, so you can compare features, understand what sets each apart, and choose the right solution to drive your marketing strategy forward.
Why Trust Our Software Reviews
Best Instagram Reporting Tool Summary
This comparison chart summarizes pricing details for my top Instagram reporting tool selections to help you find the best one for your budget and business needs.
| Tool | Best For | Trial Info | Price | ||
|---|---|---|---|---|---|
| 1 | Best for competitive social media benchmarking | 14-day free trial + free demo available | From $199/month (billed annually) | Website | |
| 2 | Best for cross-platform data aggregation | Free plan + free demo available | From $229/month (billed annually) | Website | |
| 3 | Best for advanced data pipeline integrations | Free demo available | Pricing upon request | Website | |
| 4 | Best for in-depth visual performance analytics | 14-day free trial + free plan + free demo available | From $33/month (billed annually) | Website | |
| 5 | Best for real-time KPI tracking | 14-day free trial + free demo available | From $159/month (billed annually) | Website | |
| 6 | Best for client-ready report templates | 14-day free trial + free demo available | From $59/month (billed annually) | Website | |
| 7 | Best for customizable white-label dashboards | 14-day free trial available | From $20/month | Website | |
| 8 | Best for automated multi-channel report scheduling | 14-day free trial + free plan available | From $12.5/account/month (billed annually) | Website | |
| 9 | Best for mobile-first analytics access | Free plan available | From $10/month | Website | |
| 10 | Best for quick drag-and-drop dashboard creation | Free trial + free demo available | From $42/month (billed annually) | Website |
-

Demandbase
Visit WebsiteThis is an aggregated rating for this tool including ratings from Crozdesk users and ratings from other sites.4.4 -
6sense
Visit WebsiteThis is an aggregated rating for this tool including ratings from Crozdesk users and ratings from other sites.4.3 -
AnswerThePublic
Visit Website


Instagram Reporting Tool Reviews
Below are my detailed summaries of the Instagram reporting tools that made it onto my shortlist. My reviews offer a detailed look at the features, integrations, and best use cases of each platform to help you find the best one for you.
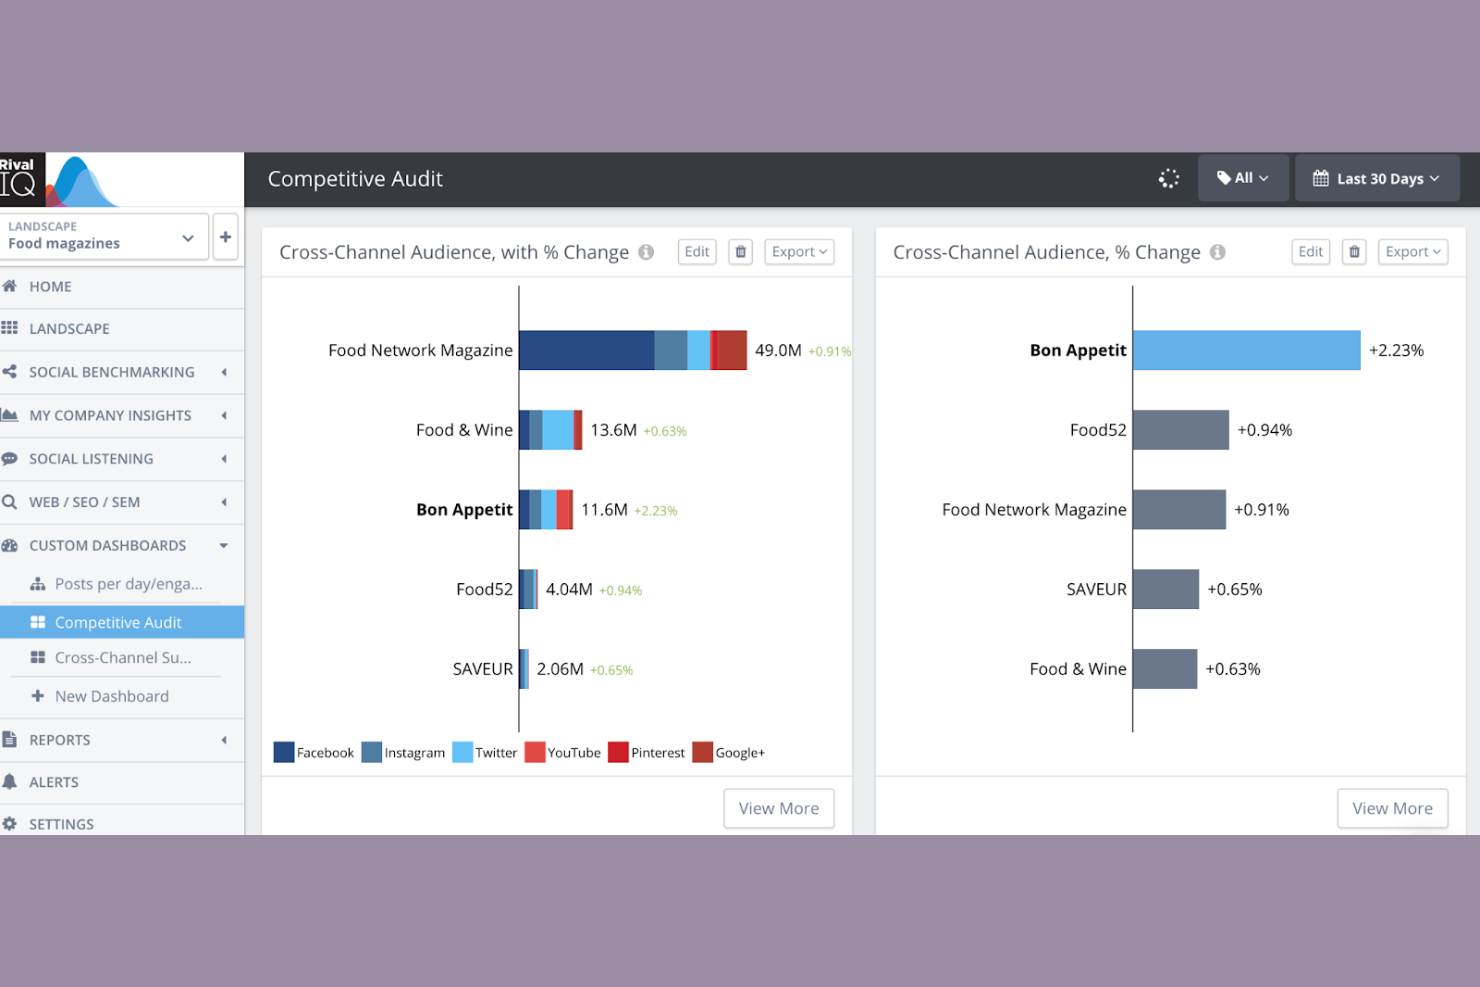
If you need to track how your Instagram performance stacks up against competitors, Rival IQ gives you a focused analytics platform. The tool is built for marketers and agencies who want to benchmark Instagram metrics and spot trends across multiple brands. It helps you identify where your content stands out and where you might be falling behind in your industry.
Who Is Rival IQ Best For?
Rival IQ is a strong fit for marketing teams and agencies that need to benchmark Instagram performance against competitors in their industry.
Why I Picked Rival IQ
What sets Rival IQ apart for Instagram reporting is its focus on competitive benchmarking. I picked this tool because it lets you track your Instagram metrics side by side with those of your competitors, so you can see exactly where you lead or lag in your industry. Rival IQ’s customizable dashboards and automated competitor tracking make it easy to monitor engagement rates, follower growth, and content performance across multiple brands. This approach gives you actionable context for your Instagram results, not just raw numbers.
Rival IQ Key Features
Some other Rival IQ features that support Instagram reporting include:
- Hashtag tracking: Monitor the performance and reach of specific hashtags used in your Instagram posts.
- Instagram stories analytics: Access metrics for story views, completion rates, and engagement.
- Historical data exports: Download past Instagram performance data for deeper analysis or presentations.
- Automated alerts: Receive notifications when there are significant changes in your Instagram metrics or competitor activity.
Rival IQ Integrations
Native integrations are not currently listed. However, Rival IQ does offer an API for custom integrations.
Pros and Cons
Pros:
- Historical Instagram data exports are supported
- Automated Instagram performance alerts are available
- Competitor Instagram benchmarking is highly detailed
Cons:
- Instagram ad analytics are limited
- Instagram influencer tracking is not included

If you need to bring together Instagram data with metrics from other platforms, Whatagraph is built for that kind of cross-channel reporting. Marketing teams and agencies use it to create unified reports that combine Instagram analytics with data from dozens of other sources. This approach helps you see how Instagram fits into your broader marketing performance without switching between multiple dashboards.
Who Is Whatagraph Best For?
Whatagraph suits marketing agencies and in-house teams that need to consolidate Instagram analytics with data from multiple marketing channels.
Why I Picked Whatagraph
I picked Whatagraph because it makes cross-platform data aggregation for Instagram reporting straightforward and flexible. The platform lets you pull Instagram metrics alongside data from other social channels, paid ads, and web analytics into a single, unified report. I like that you can automate these multi-source reports and customize them with widgets, so you always see the metrics that matter most to your team or clients. This approach is especially useful if you need to show Instagram’s impact as part of a bigger marketing picture.
Whatagraph Key Features
Some other features that make Whatagraph useful for Instagram reporting include:
- White-label reporting: Create reports with your own branding, colors, and logos for client-facing presentations.
- Scheduled report delivery: Set up automated email delivery of Instagram reports to stakeholders on a recurring basis.
- Pre-built Instagram templates: Use ready-made templates designed specifically for Instagram analytics to speed up report creation.
- Team collaboration tools: Invite team members to collaborate on report building and data analysis within the platform.
Whatagraph Integrations
Integrations include Facebook, Instagram, LinkedIn, Pinterest, TikTok, YouTube, Google Analytics 4, Google Ads, HubSpot, Shopify, and more.
Pros and Cons
Pros:
- Enables team collaboration on Instagram analytics
- Allows multi-account Instagram reporting
- Combines Instagram with other channel data
Cons:
- Instagram data refresh can be delayed
- Limited control for advanced data modeling
Improvado is a marketing data platform designed for teams that need to centralize and analyze Instagram data alongside other marketing sources. It appeals to data-driven marketers, agencies, and enterprises looking to automate complex data collection and reporting workflows. If you need to connect Instagram insights with a wide range of analytics and business intelligence tools, Improvado helps bridge those gaps.
Who Is Improvado Best For?
Improvado is a strong fit for marketing analytics teams at mid-sized to enterprise companies that need to unify Instagram data with other marketing and sales sources.
Why I Picked Improvado
I chose Improvado because it offers advanced data pipeline integrations that go far beyond basic Instagram analytics exports. For teams that need to blend Instagram data with dozens of other marketing, sales, and analytics sources, Improvado’s automated data connectors and transformation tools are especially valuable. I appreciate how you can map, normalize, and push Instagram metrics directly into your preferred business intelligence or data warehouse environment. This level of flexibility is ideal if your reporting needs require custom data models or cross-channel attribution.
Improvado Key Features
Some other features that make Improvado useful for Instagram reporting include:
- Custom dashboard builder: Create tailored dashboards to visualize Instagram metrics alongside other marketing data.
- Data transformation engine: Apply rules and formulas to Instagram data before it reaches your reporting tools.
- Automated data extraction: Schedule regular pulls of Instagram analytics without manual intervention.
- Role-based access controls: Manage who can view, edit, or share Instagram reports within your organization.
Improvado Integrations
Integrations include Instagram Organic, Facebook Ads, Google Analytics 4, TikTok Ads, LinkedIn Ads, Pinterest Ads, HubSpot, Shopify, Amazon Advertising, YouTube, and more.
Pros and Cons
Pros:
- Offers advanced data transformation for Instagram
- Enables automated Instagram data extraction
- Supports custom Instagram metric mapping
Cons:
- Instagram data syncs may have occasional delays
- Requires setup for Instagram data normalization
If you need to dig deep into your Instagram visual content performance, Iconosquare offers analytics built for brands and agencies. The platform appeals to marketing teams who want to understand how images, videos, and stories drive engagement and reach. Iconosquare helps you spot trends in your visual strategy and optimize content based on detailed reporting.
Who Is Iconosquare Best For?
Iconosquare is a strong fit for social media managers and agencies that need advanced analytics on Instagram visual content performance.
Why I Picked Iconosquare
What drew me to Iconosquare for Instagram reporting is its focus on visual performance analytics. The platform gives you granular insights into how your images, videos, and stories perform, breaking down metrics like reach, impressions, and engagement for each content type. I appreciate that you can drill into post-level analytics and compare visual formats to see what resonates most with your audience. This level of detail is especially useful for brands and agencies that rely on strong visual storytelling to drive results on Instagram.
Iconosquare Key Features
Some other features that make Iconosquare valuable for Instagram reporting include:
- Competitor tracking: Monitor and compare your Instagram performance against selected competitors to identify strengths and gaps.
- Hashtag analytics: Track the reach and engagement of specific hashtags used in your posts and stories.
- Customizable dashboards: Build dashboards with the metrics and widgets that matter most to your team or clients.
- Automated reporting: Schedule and send recurring Instagram performance reports directly to stakeholders or clients.
Iconosquare Integrations
Integrations include Instagram, Facebook, TikTok, LinkedIn, X (Twitter), Pinterest, Threads, YouTube, Dropbox, OneDrive, Zapier, and more.
Pros and Cons
Pros:
- Instagram stories analytics are built in
- Instagram hashtag tracking is included
- Historical Instagram data exports are supported
Cons:
- Instagram API connection setup can be complex
- Does not support direct posting for all social platforms
Databox gives marketing teams a way to monitor Instagram metrics alongside other business KPIs in real time. The platform is a good fit for agencies and brands that want to centralize social analytics and quickly spot trends across multiple data sources. If you need to keep Instagram performance visible and actionable for your team, Databox offers a flexible dashboard approach.
Who Is Databox Best For?
Databox suits marketing teams and agencies that need to track Instagram and other KPIs in real time across multiple campaigns.
Why I Picked Databox
What stands out about Databox for Instagram reporting is its real-time KPI tracking, which is especially valuable for teams that need up-to-the-minute insights. I picked Databox because it lets you build custom dashboards that pull in Instagram metrics alongside data from other marketing and sales platforms, so you can monitor everything in one place. The platform’s live data visualizations and automated alerts help you catch sudden changes in Instagram engagement or reach as they happen. For anyone who needs to keep a constant pulse on Instagram performance and quickly react to trends, Databox’s real-time approach is a strong fit.
Databox Key Features
Some other features that make Databox useful for Instagram reporting include:
- Pre-built Instagram templates: Choose from ready-made dashboard templates designed specifically for Instagram analytics.
- Scheduled report delivery: Set up automated email delivery of Instagram performance reports to your team or clients.
- Goal tracking for Instagram metrics: Define and monitor progress toward specific Instagram KPIs within your dashboards.
- Mobile app access: View and manage Instagram analytics dashboards from Databox’s dedicated mobile app.
Databox Integrations
Integrations include Instagram Business, Facebook Ads, Google Analytics 4, HubSpot, Shopify, LinkedIn Ads, Mailchimp, Google Sheets, Salesforce, and more.
Pros and Cons
Pros:
- Goal tracking for Instagram KPIs included
- Pre-built Instagram analytics templates available
- Scheduled Instagram report delivery via email
Cons:
- Advanced Instagram sentiment analysis not available
- Data connectors can be unstable
If you manage Instagram analytics for multiple clients, AgencyAnalytics gives you a way to centralize and automate your reporting. The platform is designed for agencies and marketing teams that need to deliver polished, data-rich Instagram reports without manual effort. With its focus on ready-made templates and visual dashboards, it helps you present Instagram performance in a format clients can quickly understand.
Who Is AgencyAnalytics Best For?
AgencyAnalytics is a strong choice for marketing agencies and consultants who need to deliver professional Instagram analytics reports to clients.
Why I Picked AgencyAnalytics
What makes AgencyAnalytics stand out for Instagram reporting is its library of client-ready report templates. These templates let you quickly generate polished Instagram analytics reports without having to build layouts from scratch. I like that you can customize these templates with your agency’s branding and adjust the metrics to match each client’s needs. This approach saves time and ensures that every Instagram report looks professional and is easy for clients to understand.
AgencyAnalytics Key Features
Some other features that make AgencyAnalytics useful for Instagram reporting include:
- Instagram stories analytics: Track reach, impressions, and engagement for Instagram stories in dedicated widgets.
- Automated report scheduling: Set up recurring Instagram analytics reports to be sent to clients on a custom schedule.
- Drag-and-drop dashboard builder: Build custom Instagram dashboards by adding, removing, or rearranging widgets.
- White-label client portal: Give clients direct access to their Instagram analytics through a branded, secure online portal.
AgencyAnalytics Integrations
Integrations include Instagram, Instagram Ads, Facebook, Google Analytics 4, Google Ads, LinkedIn, LinkedIn Ads, TikTok, YouTube, Mailchimp, and more.
Pros and Cons
Pros:
- Multi-account Instagram data management in one place
- White-label reporting supports agency branding needs
- Prebuilt Instagram analytics widgets save setup time
Cons:
- Mobile dashboard editing is not supported
- Instagram story analytics lack advanced breakdowns
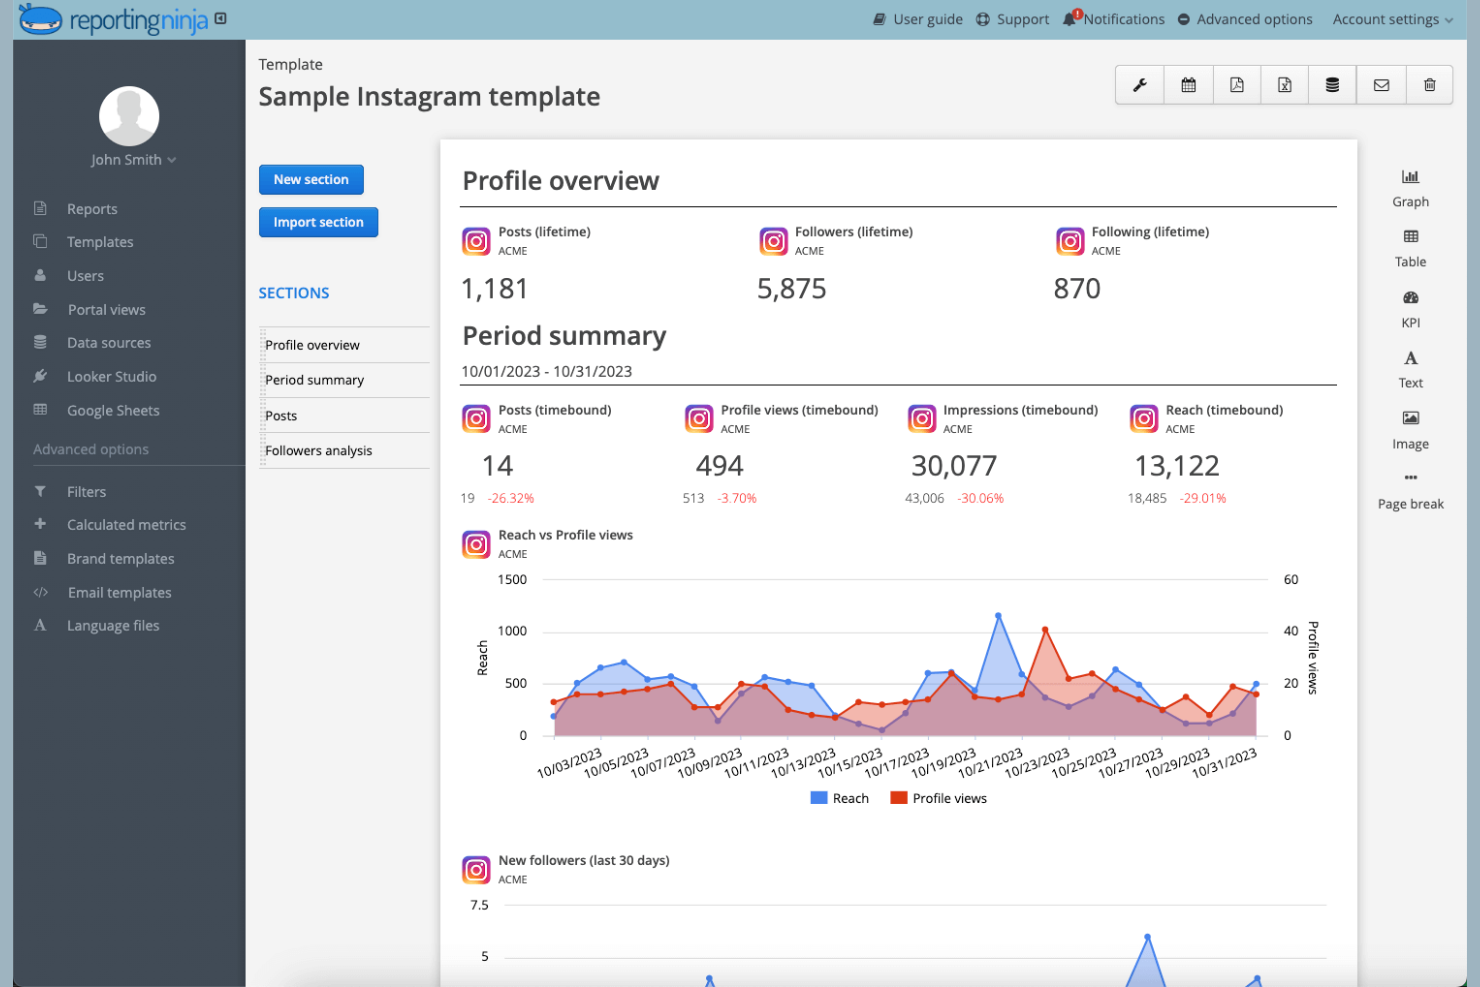
Reporting Ninja gives marketing teams and agencies a way to create detailed Instagram analytics dashboards tailored to their brand. The platform is designed for professionals who need to present client-ready reports with flexible data visualization options. If you want to combine Instagram insights with other marketing data in a single, customizable view, Reporting Ninja offers a focused solution.
Who Is Reporting Ninja Best For?
Reporting Ninja is a good fit for marketing agencies and consultants who need to deliver branded, customizable Instagram analytics dashboards to clients.
Why I Picked Reporting Ninja
What drew me to Reporting Ninja is its focus on customizable white-label dashboards, which is especially valuable for agencies managing Instagram analytics for multiple clients. The platform lets you fully brand reports with your own logo, colors, and domain, so every Instagram dashboard looks like an extension of your agency. I also appreciate the flexible widget system, which allows you to build dashboards that highlight the exact Instagram metrics your clients care about. This level of customization makes it easy to deliver polished, client-ready Instagram reports that stand out from generic templates.
Reporting Ninja Key Features
Some other features that make Reporting Ninja useful for Instagram reporting include:
- Automated report scheduling: Set up recurring Instagram analytics reports to be sent to clients or team members on a custom schedule.
- Multi-channel data blending: Combine Instagram data with metrics from other marketing platforms in a single dashboard.
- Custom calculated metrics: Create your own Instagram KPIs by applying formulas to existing data fields.
- PDF and web report exports: Export Instagram dashboards as PDFs or share them via live web links for easy client access.
Reporting Ninja Integrations
Integrations include Google Analytics 4, Meta Ads, Instagram Insights, Google Ads, Facebook Insights, LinkedIn Ads, Mailchimp, Microsoft Advertising, YouTube, TikTok Ads, and more.
Pros and Cons
Pros:
- Multi-channel data blending in one dashboard
- Custom calculated metrics for Instagram KPIs
- White-label dashboards support full client branding
Cons:
- Limited Instagram story analytics granularity
- No Instagram post scheduling or publishing
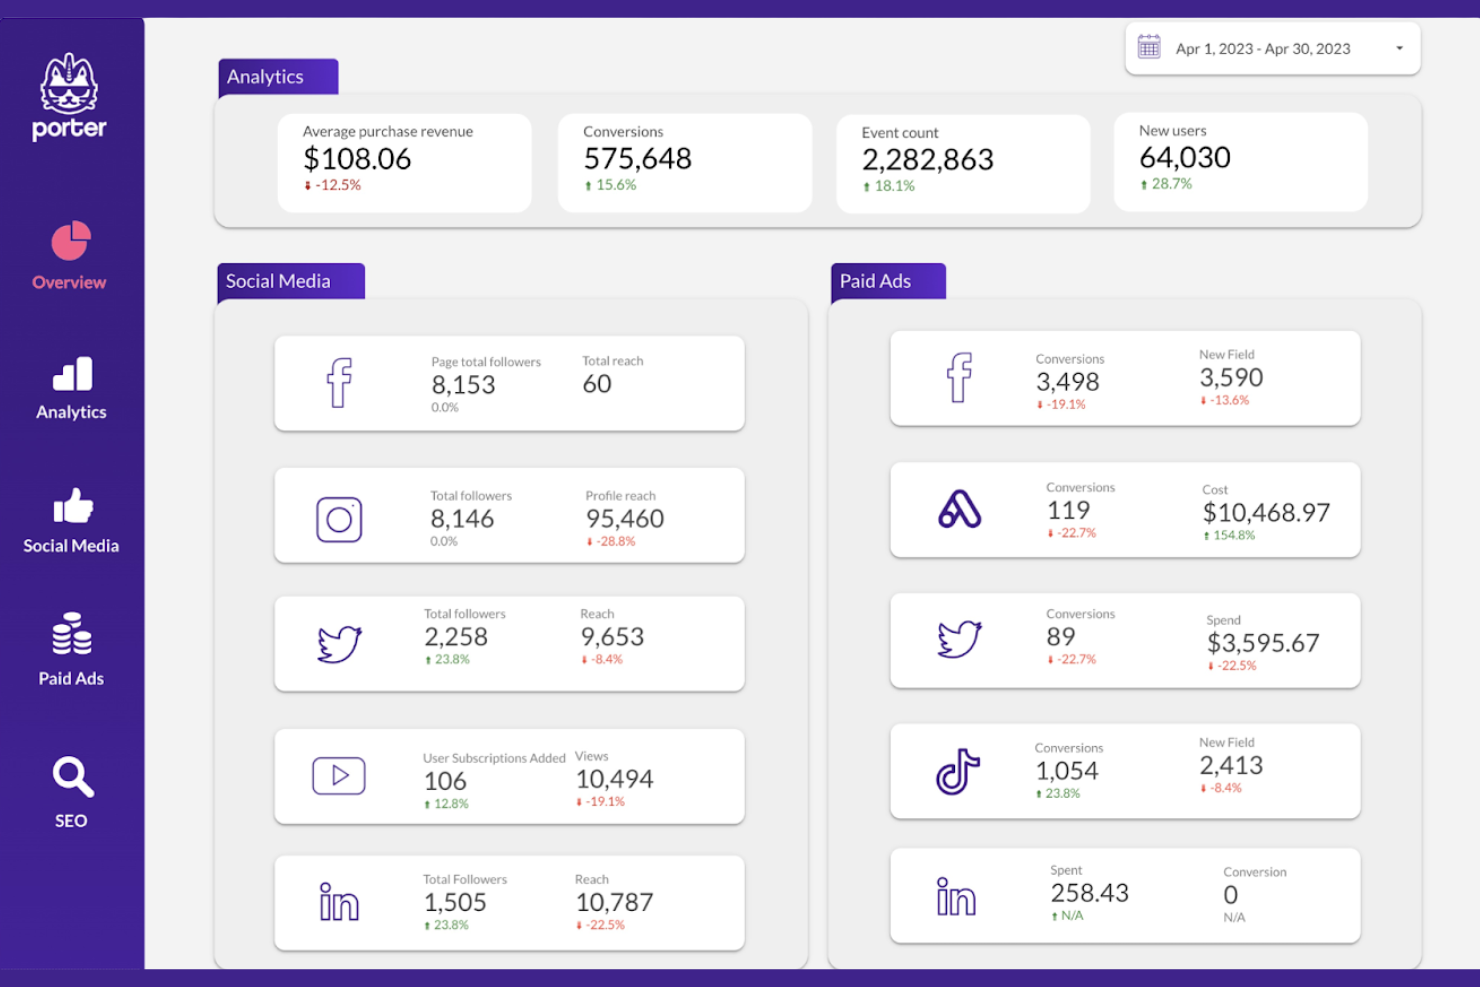
Porter is a reporting platform designed for marketers and agencies who need to centralize Instagram analytics alongside other channels. The tool connects directly to your data sources and brings your metrics into Google Looker Studio for easy visualization. If you want to automate reporting and reduce manual data pulls, Porter offers a focused solution.
Who Is Porter Best For?
Porter is a good fit for marketing teams and agencies that need to automate Instagram and multi-channel reporting within Google Looker Studio.
Why I Picked Porter
I picked Porter because its automated multi-channel report scheduling stands out for teams managing multiple Instagram accounts and other social platforms. The platform lets you set up recurring reports that pull fresh Instagram analytics into Google Looker Studio without manual intervention. I appreciate how you can customize the frequency and content of these reports, making it easy to keep stakeholders updated. This automation is especially useful for agencies or marketers who need to deliver consistent, timely insights across several client accounts.
Porter Key Features
Some other features that make Porter useful for Instagram reporting include:
- Pre-built Instagram templates: Choose from ready-made templates to quickly visualize your Instagram metrics in Google Looker Studio.
- Custom field mapping: Map Instagram data fields to your preferred report structure for more tailored analytics.
- Multi-account connections: Connect and report on multiple Instagram accounts from a single Porter workspace.
- Scheduled email delivery: Automatically send Instagram reports to stakeholders on a set schedule directly from the platform.
Porter Integrations
Integrations include Instagram, Meta Ads, Google Ads, Google Analytics 4, Shopify, HubSpot, LinkedIn Ads, TikTok Ads, Google Sheets, Looker Studio, and more.
Pros and Cons
Pros:
- Supports multiple Instagram accounts per workspace
- Pre-built Instagram analytics templates available
- Automated multi-channel report scheduling options
Cons:
- Lacks advanced Instagram competitor benchmarking
- No sentiment analysis for Instagram comments
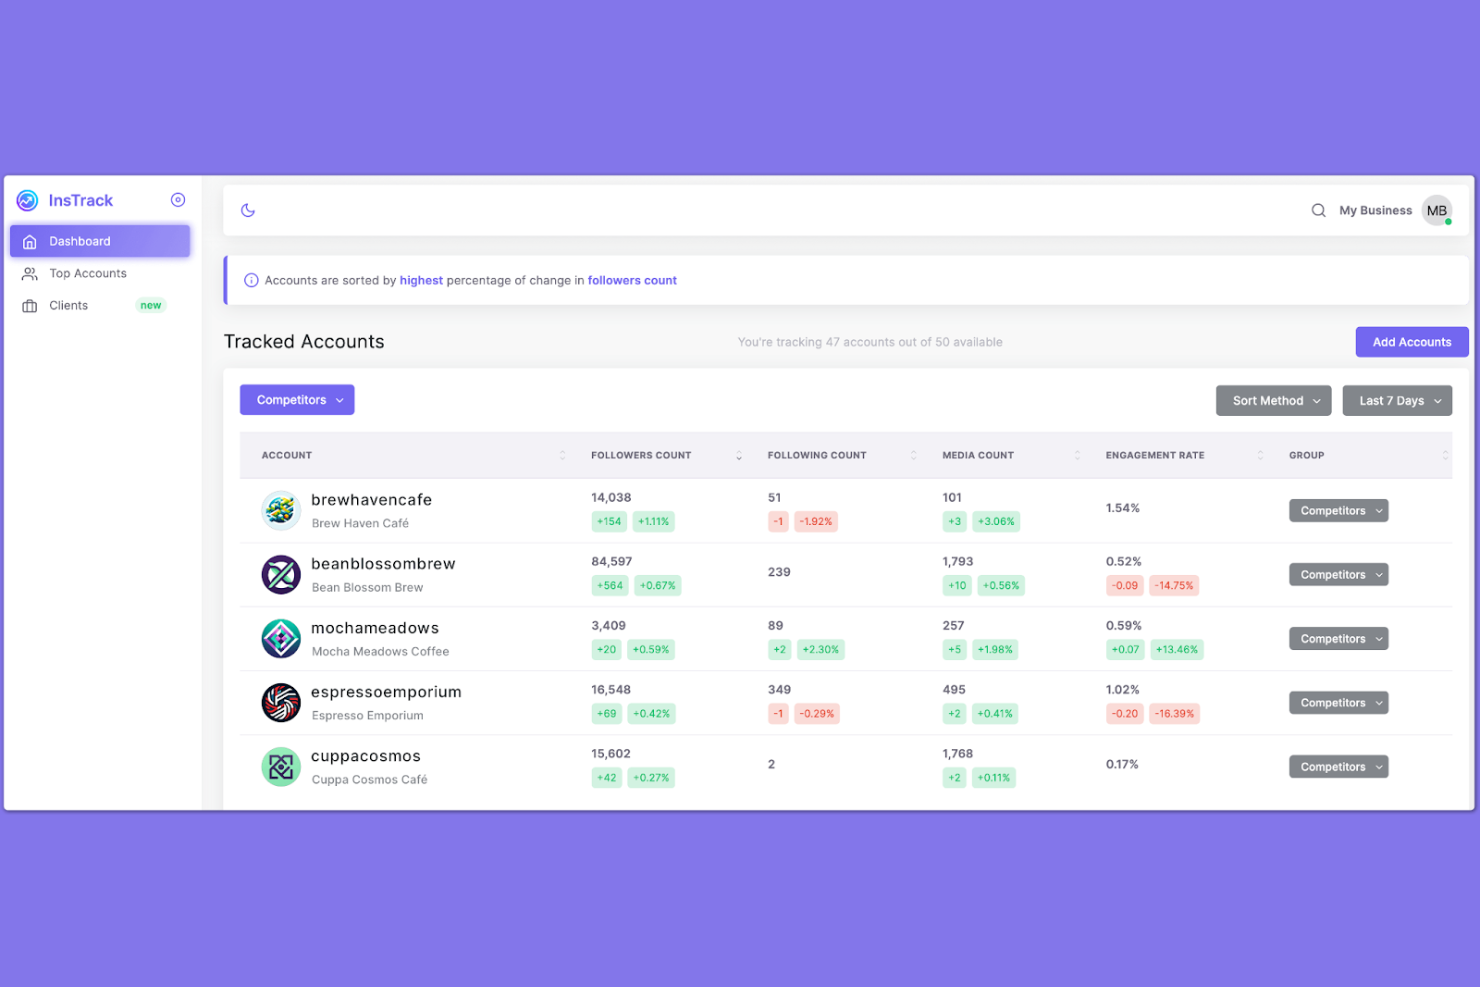
InsTrack gives social media managers and influencers a way to monitor Instagram analytics directly from their mobile devices. The app is designed for users who need on-the-go access to follower insights, engagement trends, and audience growth. If you want to track Instagram performance without relying on desktop tools, InsTrack offers a mobile-focused alternative.
Who Is InsTrack Best For?
InsTrack suits social media managers, influencers, and small business owners who need mobile-first Instagram analytics and audience tracking.
Why I Picked InsTrack
What sets InsTrack apart for Instagram reporting is its mobile-first approach, which makes it easy to check analytics and follower trends from anywhere. I picked InsTrack because it offers real-time updates on audience growth, engagement rates, and unfollower tracking—all directly within a mobile app. The platform also provides detailed insights into post performance and follower demographics, so you can make quick decisions without needing a desktop dashboard. For anyone who manages Instagram accounts on the go, InsTrack’s mobile accessibility is a clear advantage.
InsTrack Key Features
Some other features that make InsTrack useful for Instagram reporting include:
- Multiple account management: Switch between and monitor analytics for several Instagram accounts within the app.
- Customizable notifications: Set up alerts for follower milestones, engagement spikes, or account changes.
- Historical data tracking: Access and review past performance trends to compare growth over time.
- Exportable reports: Generate and export analytics reports for sharing with clients or team members.
InsTrack Integrations
Native integrations are not currently listed.
Pros and Cons
Pros:
- Displays historical data for long-term analysis
- Sends customizable notifications for account changes
- Offers multi-account management in one dashboard
Cons:
- Does not support Instagram ad campaign tracking
- No export options for analytics reports
If you need a straightforward way to visualize Instagram analytics, DashThis offers a focused solution for marketers and agencies. The platform is designed for users who want to quickly assemble and share custom Instagram reports without technical setup. It helps simplify multi-channel reporting by bringing Instagram and other marketing data into one easy-to-read dashboard.
Who Is DashThis Best For?
DashThis suits marketing teams and agencies that need to create and share Instagram dashboards quickly without technical expertise.
Why I Picked DashThis
For Instagram reporting, I picked DashThis because its drag-and-drop dashboard builder makes it easy to assemble custom reports in minutes. The platform lets you pull in Instagram metrics and arrange them visually, so you can highlight the data that matters most to your team or clients. I also like that you can add widgets, charts, and comments directly to dashboards, which helps make reports more interactive and actionable. This approach is especially useful if you need to deliver polished Instagram analytics quickly, without relying on technical resources.
DashThis Key Features
Some other features that make DashThis useful for Instagram reporting include:
- Preset Instagram report templates: Choose from ready-made templates designed for Instagram analytics and campaign tracking.
- Scheduled automated report delivery: Set up automatic email delivery of Instagram dashboards to clients or stakeholders.
- Multi-account Instagram data aggregation: Combine data from multiple Instagram accounts into a single dashboard for unified reporting.
- White label dashboard options: Customize dashboards with your own branding, including logos and color schemes, for client-facing reports.
DashThis Integrations
Integrations include Google Analytics 4, Google Ads, Meta Ads, Facebook Insights, Instagram, TikTok Ads, Pinterest Ads, LinkedIn Ads, HubSpot, YouTube, and more.
Pros and Cons
Pros:
- Preset Instagram analytics templates available
- Automated Instagram report scheduling and delivery
- Drag-and-drop Instagram widget customization
Cons:
- Limited Instagram engagement metrics
- Dashboard layouts are rigid
New Product Updates from DashThis

DashThis Introduces AI Insights Pro for Smarter Marketing Analysis
DashThis introduces AI Insights Pro with Chat Mode and Dashboard Context to deliver more personalized and interactive marketing analysis. For more information, visit DashThis's official site.
 .
.Other Instagram Reporting Tools
Here are some additional Instagram reporting tool options that didn’t make it onto my shortlist, but are still worth checking out:
- Social Status
For granular engagement breakdowns
- Metricool
For unified analytics across networks
- Buffer
For collaborative post performance tracking
- Pallyy
For visual content calendar reporting


Instagram Reporting Tool Selection Criteria
When selecting the best Instagram reporting tool to include in this list, I considered common buyer needs and pain points like tracking detailed engagement metrics and managing multiple Instagram accounts efficiently. I also used the following framework to keep my evaluation structured and fair:
Core Functionality (25% of total score)
To be considered for inclusion in this list, each solution had to fulfill these common use cases:
- Track follower growth and loss
- Monitor post and story engagement
- Analyze audience demographics
- Generate downloadable performance reports
- Support multiple Instagram accounts
Additional Standout Features (25% of total score)
To help further narrow down the competition, I also looked for unique features, such as:
- Real-time analytics updates
- Hashtag performance tracking
- Competitor benchmarking tools
- Customizable notification alerts
- Mobile-first analytics access
Usability (10% of total score)
To get a sense of the usability of each system, I considered the following:
- Simple and intuitive dashboard layout
- Clear data visualization and charts
- Fast loading times and responsiveness
- Easy navigation between analytics sections
- Minimal manual data entry required
Onboarding (10% of total score)
To evaluate the onboarding experience for each platform, I considered the following:
- Step-by-step setup guides or product tours
- Availability of training videos and tutorials
- Access to pre-built report templates
- In-app chatbots or live support during onboarding
- Webinars or onboarding sessions for new users
Customer Support (10% of total score)
To assess each software provider’s customer support services, I considered the following:
- Availability of live chat or phone support
- Response time to support inquiries
- Quality and depth of help documentation
- Access to user communities or forums
- Multilingual support options
Value For Money (10% of total score)
To evaluate the value for money of each platform, I considered the following:
- Transparent and flexible pricing plans
- Free trial or demo availability
- Features included at each pricing tier
- No hidden fees or surprise charges
- Discounts for annual or multi-user plans
Customer Reviews (10% of total score)
To get a sense of overall customer satisfaction, I considered the following when reading customer reviews:
- Consistency of positive feedback across platforms
- Reports of reliable analytics accuracy
- User satisfaction with mobile or desktop experience
- Feedback on customer support responsiveness
- Comments on ease of onboarding and setup
How to Choose an Instagram Reporting Tool
It’s easy to get bogged down in long feature lists and complex pricing structures. To help you stay focused as you work through your unique software selection process, here’s a checklist of factors to keep in mind:
| Factor | What to Consider |
|---|---|
| Scalability | Will the tool support your account growth, additional users, or multiple Instagram profiles as your needs expand? |
| Integrations | Does the tool connect natively with your existing marketing stack, such as scheduling tools, CRMs, or analytics platforms? |
| Customizability | Can you tailor dashboards, reports, or notifications to match your team’s workflows and reporting needs? |
| Ease of use | How quickly can team members learn the tool and access the insights they need without extra training? |
| Implementation and onboarding | What resources, guides, or support does the vendor provide to help you get up and running quickly? |
| Cost | Are the pricing tiers clear, and do they align with your usage, team size, and reporting requirements? Watch for hidden fees. |
| Security safeguards | Does the tool follow best practices for data privacy and account protection, especially with sensitive Instagram credentials? |
| Support availability | What support channels are offered, and are they available during your business hours or in your region? |
What Is an Instagram Reporting Tool?
Instagram reporting tools are specialized software platforms that track, analyze, and visualize Instagram account performance data. These tools help marketing teams and social media managers monitor metrics like follower growth, engagement rates, and content reach. By providing clear dashboards and exportable reports, the Instagram reporting tool makes it easier to evaluate campaign effectiveness, identify trends, and inform future content strategies—all from a single, centralized interface.
Features of Instagram Reporting Tool
When selecting an Instagram reporting tool, keep an eye out for the following key features:
- Follower analytics: Tracks changes in follower count, identifies new followers and unfollowers, and highlights audience growth trends over time.
- Engagement tracking: Measures likes, comments, shares, and saves on posts and stories to help you understand what content resonates most with your audience.
- Content performance reports: Provides detailed breakdowns of how individual posts, stories, or reels perform, including reach, impressions, and engagement rates.
- Audience demographics: Analyzes follower data such as age, gender, location, and active hours to inform targeting and content planning.
- Hashtag analytics: Monitors which hashtags drive the most engagement and reach, helping you refine your hashtag strategy for better visibility.
- Multi-account management: Allows you to track and report on multiple Instagram accounts from a single dashboard, making it easier for agencies or large teams.
- Customizable dashboards: Lets you tailor analytics views and reports to focus on the metrics and timeframes that matter most to your team.
- Exportable reports: Enables you to download or share analytics data in formats like PDF or CSV for presentations, collaboration, or record-keeping.
- Real-time data updates: Provides up-to-date metrics and alerts so you can respond quickly to changes in performance or audience behavior.
- Competitor benchmarking: Compares your account’s performance against competitors to identify strengths, weaknesses, and new opportunities.
Benefits of Instagram Reporting Tool
Implementing an Instagram reporting tool provides several benefits for your team and your business. Here are a few you can look forward to:
- Data-driven decision making: Access to clear analytics dashboards and reports helps your team make informed choices about content and strategy.
- Improved campaign performance: Real-time engagement and content performance tracking allow you to quickly identify what’s working and adjust campaigns on the fly.
- Efficient multi-account management: Centralized dashboards and reporting features save time for teams managing several Instagram accounts at once.
- Improved audience understanding: Demographic and behavior analytics reveal who your followers are and when they’re most active, guiding better targeting.
- Streamlined reporting workflows: Exportable and customizable reports simplify sharing results with stakeholders and documenting progress over time.
- Competitive insights: Benchmarking tools help you compare your performance to competitors, uncovering new opportunities and areas for improvement.
- Faster response to trends: Real-time data updates and notifications let you react quickly to spikes or drops in engagement, protecting your brand reputation.
Costs and Pricing of Instagram Reporting Tool
Selecting Instagram reporting tool requires an understanding of the various pricing models and plans available. Costs vary based on features, team size, add-ons, and more. The table below summarizes common plans, their average prices, and typical features included in Instagram reporting tool solutions:
Plan Comparison Table for Instagram Reporting Tool
| Plan Type | Average Price | Common Features |
|---|---|---|
| Free Plan | $0 | Basic analytics, limited account tracking, restricted data history, and simple engagement metrics. |
| Personal Plan | $5-$25/user/month | Full analytics dashboard, single account support, downloadable reports, and basic audience insights. |
| Business Plan | $30-$80/user/month | Multi-account management, advanced reporting, team collaboration tools, and hashtag analytics. |
| Enterprise Plan | $100-$300+/month | Custom integrations, dedicated support, competitor benchmarking, unlimited accounts, and API access. |
Instagram Reporting Tool FAQs
Here are some answers to common questions about Instagram reporting tool:
Can Instagram reporting tool track Instagram Stories and Reels?
Yes, most Instagram reporting tools track performance metrics for Stories and Reels, including views, replies, and engagement. However, the depth of analytics may vary by tool, so check if your preferred solution covers the specific metrics you need.
Does the Instagram reporting tool require admin access to my Instagram account?
Yes, most tools require admin or authorized access to your Instagram account to collect data. This is necessary to pull analytics directly from Instagram’s API and ensure accurate, up-to-date reporting.
How often is data updated in Instagram reporting tool?
Data update frequency depends on the tool, but most update metrics in real time or at least daily. Some tools offer instant notifications for significant changes, while others refresh data on a set schedule.
Can I export reports from Instagram reporting tool?
Yes, nearly all Instagram reporting tools allow you to export reports in formats like PDF or CSV. This makes it easy to share insights with stakeholders or archive performance data for future reference.
Is there an Instagram reporting tool that supports multiple accounts?
Yes, many Instagram reporting tools support multi-account management, letting you track analytics for several Instagram profiles from a single dashboard. This is especially useful for agencies or teams managing multiple brands.