19 Best Heatmap Tools for 2026

Heatmap Tools Shortlist
Here’s my shortlist of heatmap tools:


Heatmap tools are analytics platforms that visualize where users click, scroll, and interact on your website or app. If you’re searching for the best heatmap tools, you’re likely aiming to understand user behavior, identify friction points, and back your optimization decisions with real data.
With so many options available, it’s tough to know which tool fits your workflow, tech stack, and reporting needs. This list will help you compare leading heatmap solutions for 2026, so you can confidently choose the right platform to improve user experience and drive better results.
Why Trust Our Software Reviews
We’ve been testing and reviewing marketing software since 2022. As marketing experts ourselves, we know how critical and difficult it is to make the right decision when selecting software.
We invest in deep research to help our audience make better software purchasing decisions. We’ve tested more than 2,000 tools for different marketing use cases and written over 1,000 comprehensive software reviews. Learn how we stay transparent & our software review methodology.
Best Heatmap Tools Summary
This comparison chart summarizes pricing details for my top heatmap tool selections to help you find the best one for your budget and business needs.
| Tool | Best For | Trial Info | Price | ||
|---|---|---|---|---|---|
| 1 | Best for tracking user journey funnels | 14-day free trial + free plan + free demo available | From $25/month (billed annually) | Website | |
| 2 | Best for live visitor interaction tools | 7-day free trial + free plan available | From $32/month (billed annually) | Website | |
| 3 | Best for real-time anomaly detection | Free demo available | Pricing upon request | Website | |
| 4 | Best for retroactive event tracking | 30-day free trial + free plan available | From $55/month | Website | |
| 5 | Best for digital experience analytics | Free plan + free demo available | Pricing upon request | Website | |
| 6 | Best for visualizing user click behavior | Free plan available | From $39/month (billed annually) | Website | |
| 7 | Best for compliance-ready session analysis | Free demo available | Pricing upon request | Website | |
| 8 | Best for rapid A/B test insights | 30-day free trial available | From $29/month | Website | |
| 9 | Best for advanced filtering of user sessions | Free plan available | From $33/month (billed annually) | Website | |
| 10 | Best for integrating analytics with campaigns | Free demo available | Pricing upon request | Website |
-

Demandbase
Visit WebsiteThis is an aggregated rating for this tool including ratings from Crozdesk users and ratings from other sites.4.4 -
6sense
Visit WebsiteThis is an aggregated rating for this tool including ratings from Crozdesk users and ratings from other sites.4.3 -
AnswerThePublic
Visit Website


Heatmap Tools Reviews
Below are my detailed summaries of the heatmap tools that made it onto my shortlist. My reviews offer a detailed look at the features, best use cases, and integrations of each platform to help you find the best one for you.
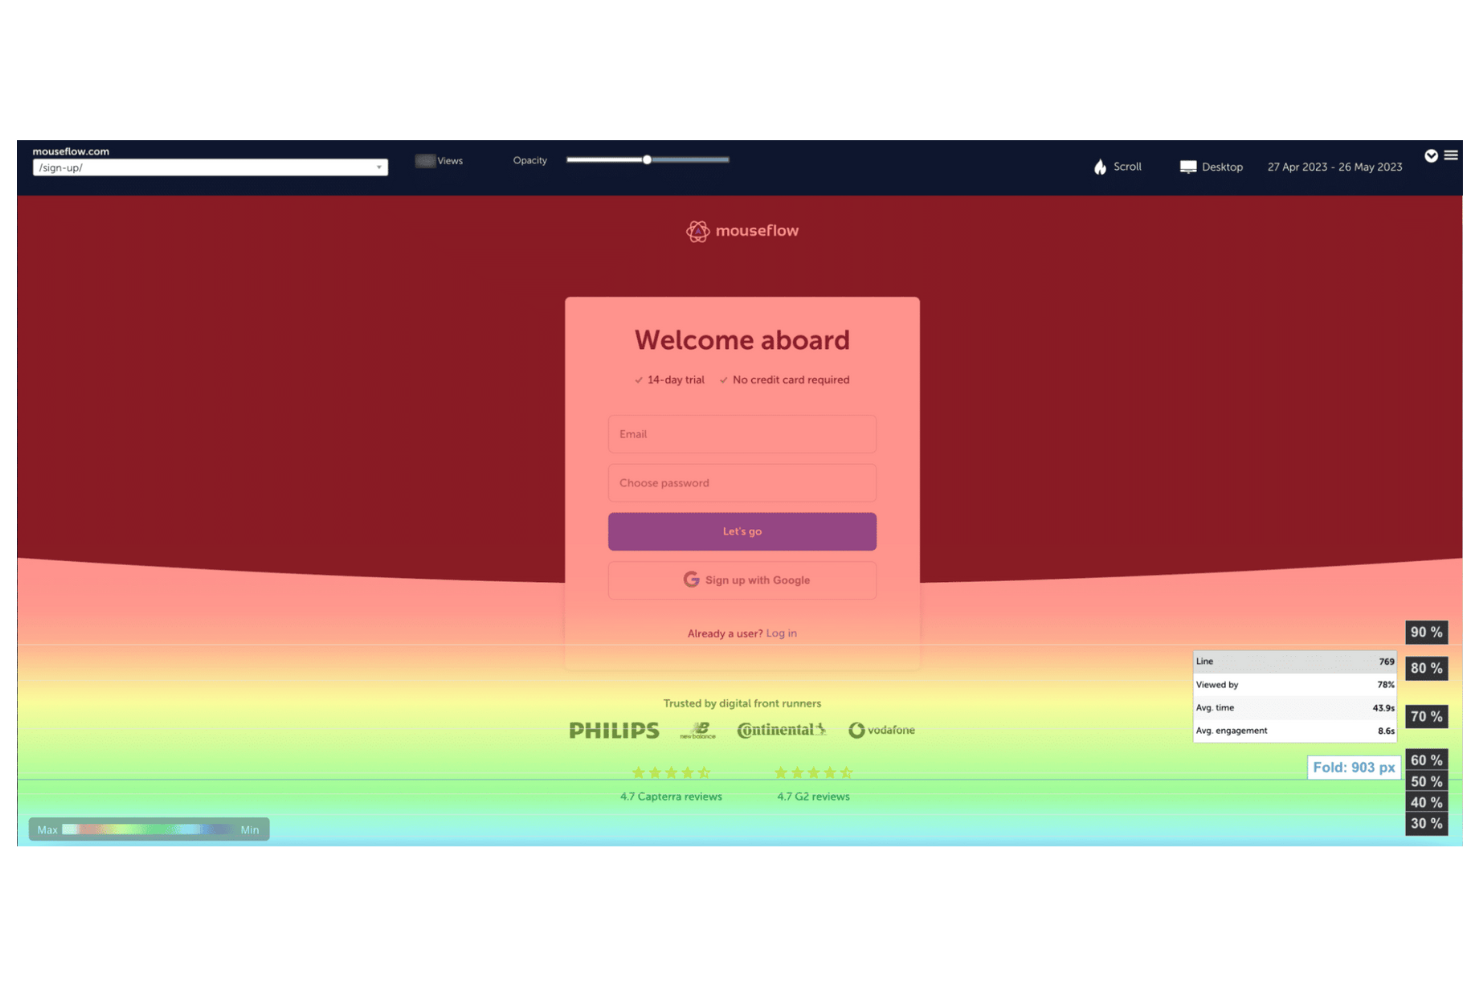
If you need to visualize and optimize every step of your website’s conversion funnel, Mouseflow offers specialized tools for tracking user journeys. This platform is a strong fit for ecommerce teams, CRO specialists, and digital marketers who want to pinpoint where users drop off or get stuck. With funnel analytics tied directly to session recordings and heatmaps, Mouseflow helps you connect user actions to conversion outcomes.
Why I Picked Mouseflow
What sets Mouseflow apart for me is its dedicated focus on tracking user journey funnels within your website. I picked Mouseflow because it lets you build custom funnels and then automatically maps user drop-offs and conversions at each step. The tool links funnel analytics directly to session recordings and heatmaps, so you can watch exactly where users abandon or succeed in your flows. This level of detail helps you identify friction points and optimize your site’s conversion paths with confidence.
Mouseflow Key Features
Some other features in Mouseflow that help you analyze user behavior include:
- Form Analytics: Tracks how users interact with forms and highlights fields that cause drop-offs or errors.
- Friction Score: Automatically scores sessions based on signs of user frustration, such as rapid clicks or U-turns.
- User Feedback Widget: Lets you collect direct feedback from users through customizable on-site surveys.
- Geo Heatmaps: Visualizes user activity by geographic location to help you spot regional trends.
Mouseflow Integrations
Integrations include Google Analytics, Adobe Analytics, Google Tag Manager, AB Tasty, Shopify, Google Ads, Salesforce, Visually, Varify, and more.
Pros and Cons
Pros:
- Geo heatmaps show regional user behavior
- Form analytics pinpoints problematic form fields
- Friction score highlights user frustration patterns
Cons:
- Data retention limited on lower-tier plans
- No support for mobile app heatmaps
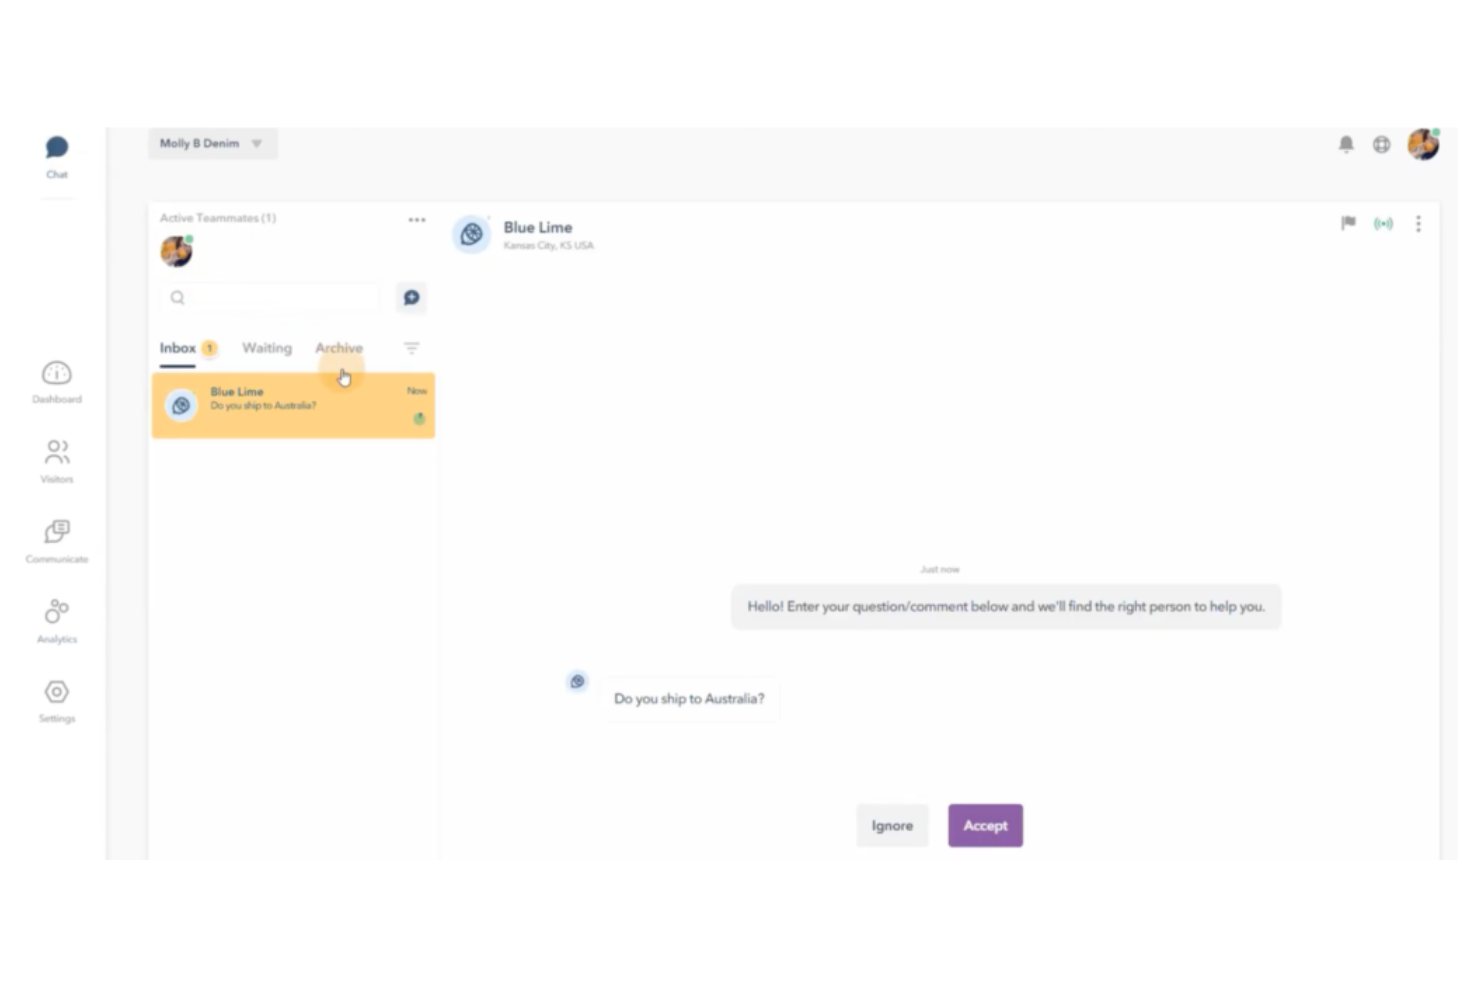
If you want to interact with visitors in real time while analyzing their behavior, Lucky Orange brings live chat and dynamic heatmaps together in one platform. This tool is a strong fit for e-commerce managers, digital marketers, and support teams who need to see what users are doing and respond instantly. With Lucky Orange, you can watch sessions as they happen and reach out to users directly when you spot friction or confusion.
Why I Picked Lucky Orange
What sets Lucky Orange apart is its ability to combine live visitor interaction within the heatmap analytics tool. I picked Lucky Orange because you can watch users navigate your site in real time and immediately engage them through live chat if you notice issues or hesitation. The tool’s live session dashboard and chat widget let you respond to user behavior as it unfolds, which is especially valuable for e-commerce and support teams. This direct connection between heatmap insights and live communication helps you address friction points the moment they appear.
Lucky Orange Key Features
I also found several other features in Lucky Orange that help you analyze and act on user behavior:
- Dynamic Heatmaps: Visualizes clicks, scrolls, and mouse movements on both desktop and mobile devices.
- Session Recordings: Captures full user sessions for playback and deeper analysis.
- Conversion Funnels: Tracks where users drop off in multi-step processes.
- Form Analytics: Monitors form field engagement and abandonment rates.
Lucky Orange Integrations
Integrations include Shopify, HubSpot, Google Analytics, BigCommerce, Optimizely, Square, WordPress, Wix, and more.
Pros and Cons
Pros:
- Visualizes multi-step user journeys
- Real-time session recordings for instant playback
- Dynamic heatmaps update with site changes
Cons:
- Limited segmentation for heatmap filtering
- Heatmap data sampling on high-traffic sites
Quantum Metric is built for digital teams that need to spot and respond to user experience issues as they happen. It’s especially useful for enterprise businesses and ecommerce teams that want real-time anomaly detection layered with heatmap and session replay data. By surfacing unexpected user behavior and friction points instantly, Quantum Metric helps you prioritize fixes and optimize journeys before they impact revenue.
Why I Picked Quantum Metric
Unlike many heatmap tools, Quantum Metric stands out for its real-time anomaly detection that alerts you the moment user behavior deviates from the norm. I picked Quantum Metric because it doesn’t just visualize clicks and scrolls—it automatically flags friction points and unexpected patterns as they happen. The platform’s live session replay and anomaly detection features help you quickly pinpoint and investigate issues before they impact conversion or user satisfaction. For teams that need to act fast on user experience problems, Quantum Metric brings heatmap data and real-time monitoring together in one place.
Quantum Metric Key Features
Some other features that make Quantum Metric valuable for heatmap analysis include:
- Click Maps: Visualizes where users are clicking on each page to help identify popular and ignored elements.
- Journey Analysis: Maps out user flows across multiple sessions to reveal common paths and drop-off points.
- Form Analytics: Tracks user interactions with form fields to highlight friction or abandonment in conversion funnels.
- Custom Event Tracking: Lets you define and monitor specific user actions or milestones for deeper behavioral insights.
Quantum Metric Integrations
Integrations include Google BigQuery, Adobe Experience Platform, Salesforce Lightning, and more.
Pros and Cons
Pros:
- Provides detailed form field interaction tracking
- Offers journey mapping across multiple sessions
- Supports granular segmentation of heatmap data
Cons:
- Limited prebuilt integrations for marketing tools
- Requires technical setup for advanced features
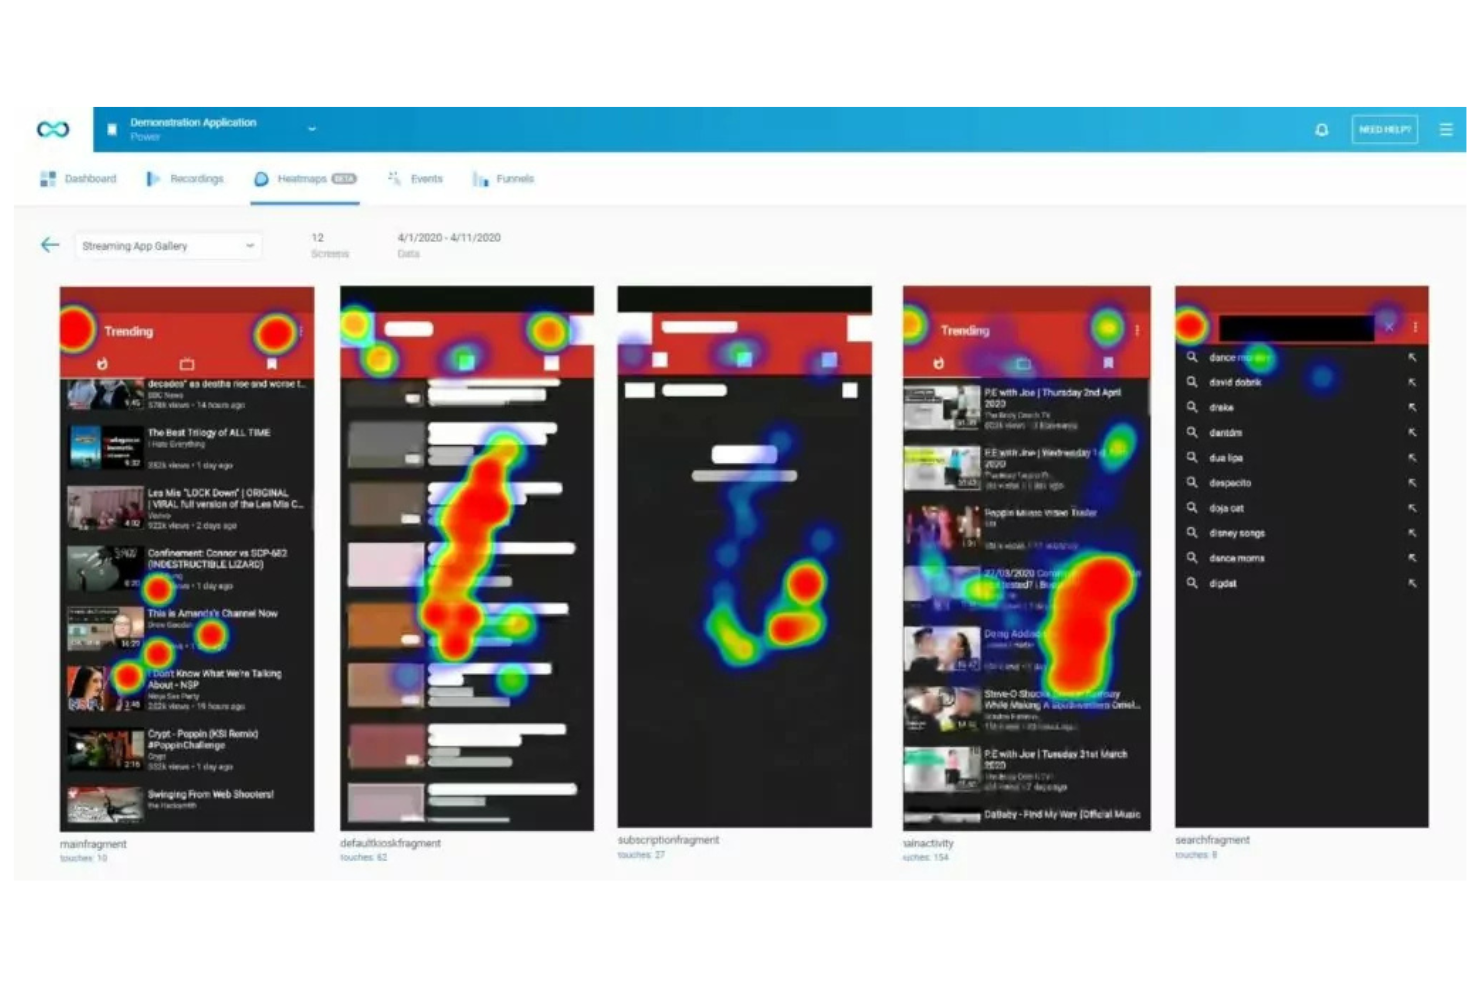
Smartlook stands out for teams that want to analyze user actions even if they didn’t set up event tracking in advance. This tool is especially useful for SaaS product managers, ecommerce analysts, and marketers who need to retroactively define and review events from past user sessions. With Smartlook, you can turn session recordings into actionable insights without missing key interactions.
Why I Picked Smartlook
Unlike most heatmap tools, Smartlook lets you define and track events retroactively, which is a major advantage if you want to analyze user behavior from sessions you’ve already recorded. I picked Smartlook because it allows you to set up new events at any time and instantly see historical data for those actions, so you never miss out on key insights due to missed setup. The platform connects these retroactive events to session recordings and heatmaps, making it easy to visualize exactly how users interact with your site or app. This flexibility is especially valuable for teams that need to adapt their analytics on the fly or revisit past user journeys.
Smartlook Key Features
Some other features in Smartlook that help you dig deeper into user behavior include:
- Automatic Event Tracking: Captures clicks, page views, and other interactions without manual setup.
- Mobile App Analytics: Supports session recordings and heatmaps for native iOS and Android apps.
- Funnels Visualization: Maps user journeys through multi-step processes to highlight drop-offs.
- Crash Reports: Links user sessions to crash events for faster troubleshooting.
Smartlook Integrations
Integrations include Salesforce, Slack, Intercom, Survicate, and Zendesk.
Pros and Cons
Pros:
- Crash reports connect errors to user actions
- Mobile app heatmaps for iOS and Android
- Retroactive event tracking for past sessions
Cons:
- Limited export options for heatmap visuals
- No support for A/B test integrations
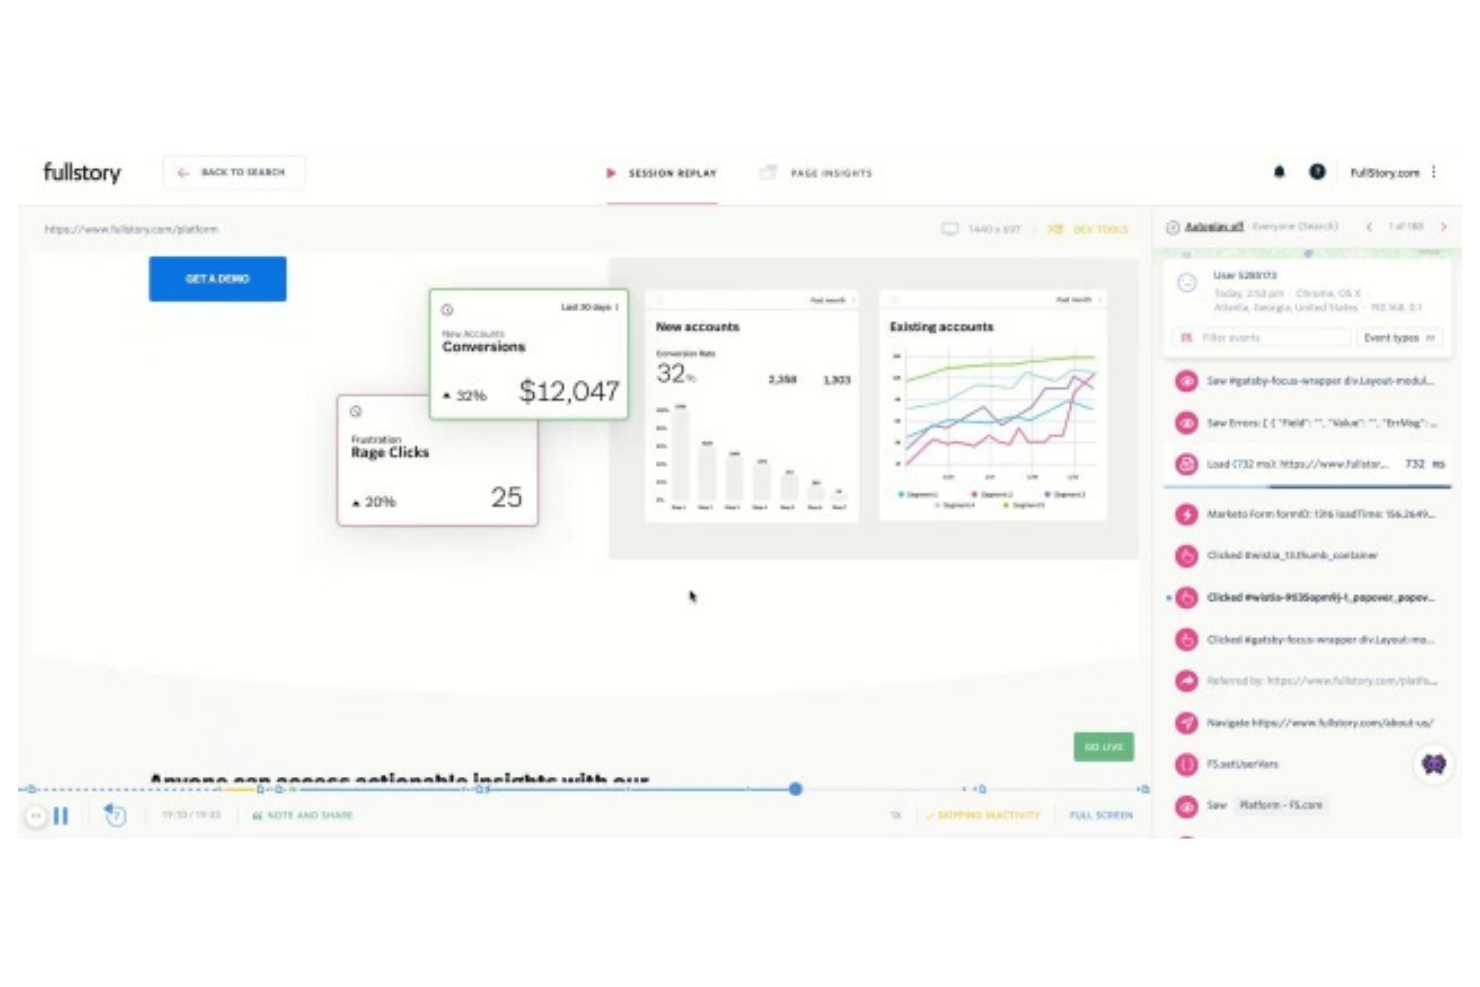
FullStory offers digital experience analytics designed for teams that want to connect user behavior with business outcomes. It’s especially useful for product managers, UX specialists, and digital marketers who need to visualize friction points and optimize conversion paths. With features like autocapture and retroactive heatmaps, FullStory helps you uncover hidden patterns and prioritize improvements based on real user journeys.
Why I Picked FullStory
What sets FullStory apart for me is how it connects heatmap data with broader digital experience analytics. I picked FullStory because it autocaptures every user interaction, letting you generate heatmaps and session replays without manual event setup. This means you can retroactively analyze user journeys and spot friction points even if you didn’t anticipate them in advance. For teams focused on optimizing digital experiences, FullStory’s ability to tie visual behavior data to conversion and retention metrics is especially valuable.
FullStory Key Features
Some other features in FullStory help you dig deeper into user behavior and site performance:
- Click Maps: Visualizes exactly where users are clicking on each page.
- Conversion Funnels: Tracks user progress through multi-step flows to identify drop-off points.
- Error Detection: Automatically surfaces JavaScript errors and rage clicks during user sessions.
- Custom Segments: Lets you filter and analyze sessions based on user attributes or behaviors.
FullStory Integrations
Integrations include Google Analytics, Adobe Analytics, Slack, Jira, Salesforce, Zendesk, HubSpot, Optimizely, and more.
Pros and Cons
Pros:
- Error detection overlays on heatmap visualizations
- Funnel analysis integrates with heatmap insights
- Click maps segment by device and user type
Cons:
- Limited support for dynamic or SPA content
- No export option for heatmap images
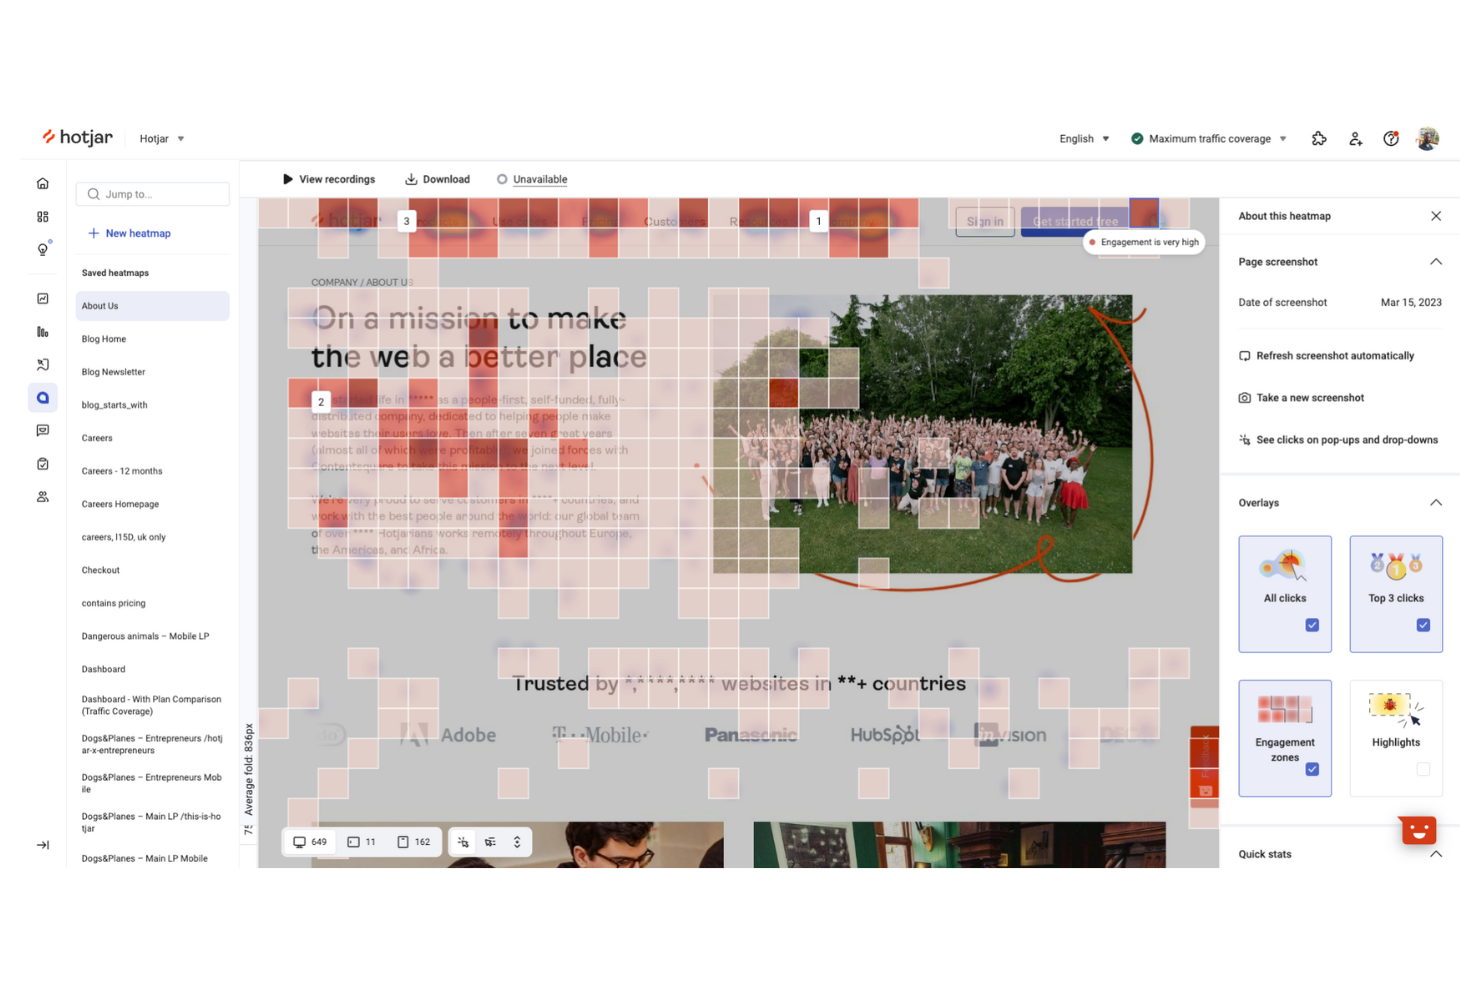
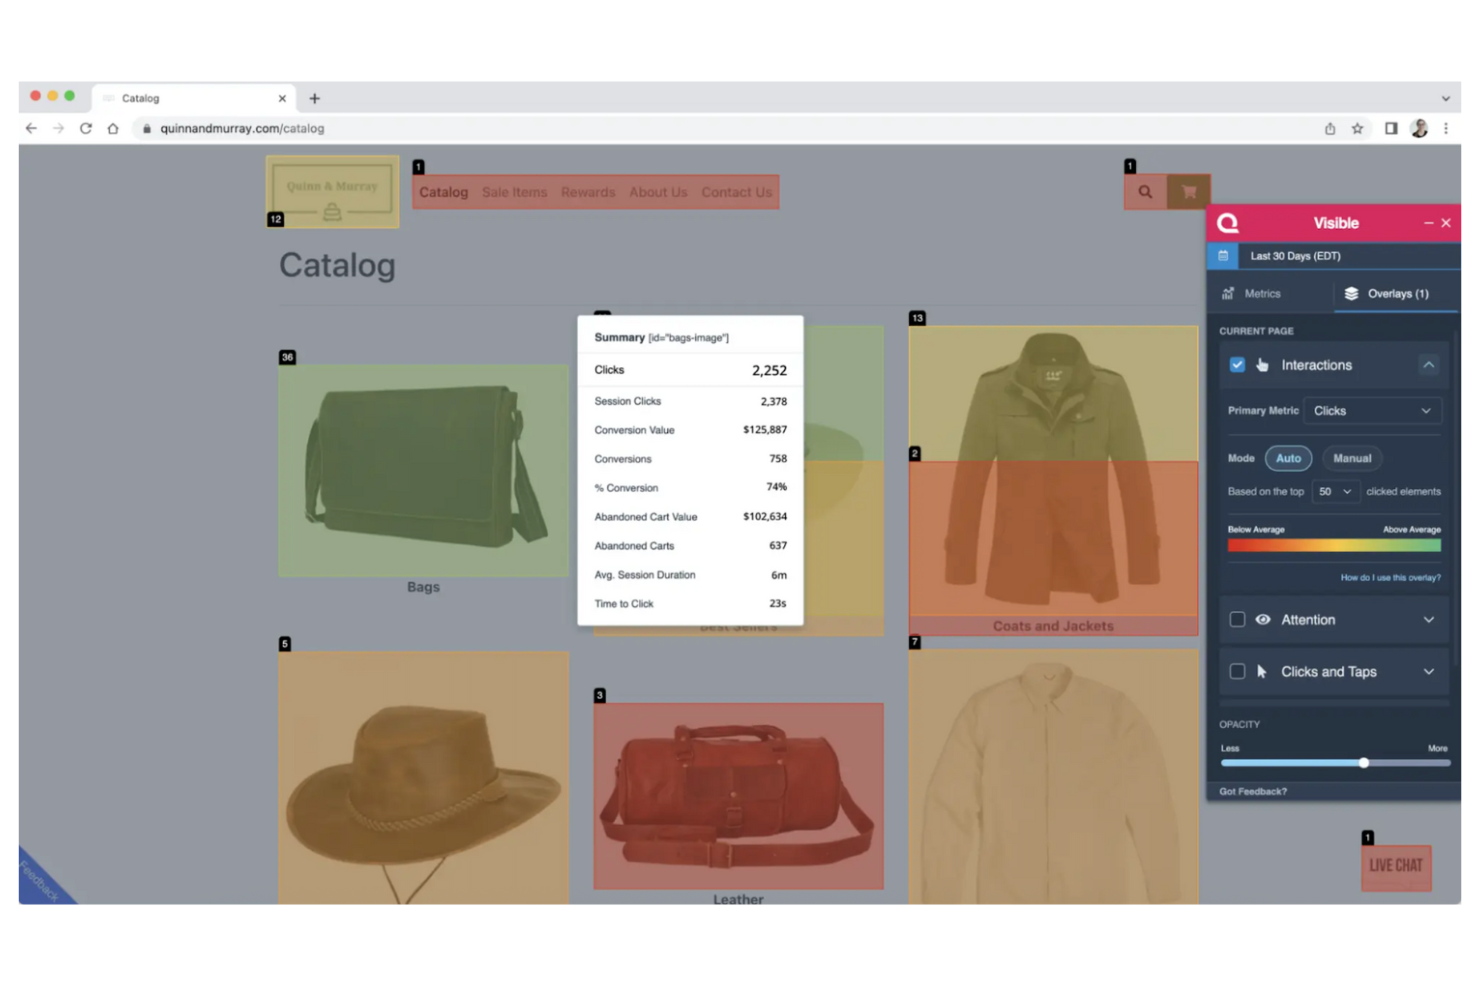
Hotjar gives marketers and UX teams a clear view of exactly where users click, scroll, and drop off on their sites. Its visual heatmaps and session recordings help you pinpoint friction points and optimize page layouts based on real user actions. If you want to quickly understand user intent and behavior without a complex setup, Hotjar stands out for its intuitive approach.
Why I Picked Hotjar
For teams focused on visualizing user click behavior, Hotjar offers some of the clearest and most actionable heatmaps available. I picked Hotjar because its click, move, and scroll heatmaps let you see exactly which elements attract attention and which get ignored. The tool also provides session recordings that pair with heatmaps, so you can watch real user journeys and connect click data to actual user flows. This combination makes it easy to identify high- and low-engagement areas on any page, helping you prioritize design changes with confidence.
Hotjar Key Features
Some other features in Hotjar that are useful for analyzing user behavior include:
- Surveys and Feedback Polls: Collect direct input from users while they interact with your site to understand their motivations and pain points.
- Conversion Funnels: Visualize where users drop off in multi-step processes, such as sign-ups or checkouts, to identify bottlenecks.
- User Segmentation: Filter heatmap and session data by device, location, or user attributes for more targeted analysis.
- Event Tracking: Monitor specific actions like CTA button clicks or form submissions to see how users engage with key elements.
Hotjar Integrations
Integrations include HubSpot, Google Analytics, Slack, Optimizely, Segment, Omniconvert, Unbounce, Microsoft Teams, Shopify, and more.
Pros and Cons
Pros:
- Funnels visualize drop-off in conversion paths
- Session recordings sync with heatmap data
- Detailed click, move, and scroll heatmaps
Cons:
- No retroactive heatmap data for new pages
- Heatmaps limited to 1,000 pageviews on base plan
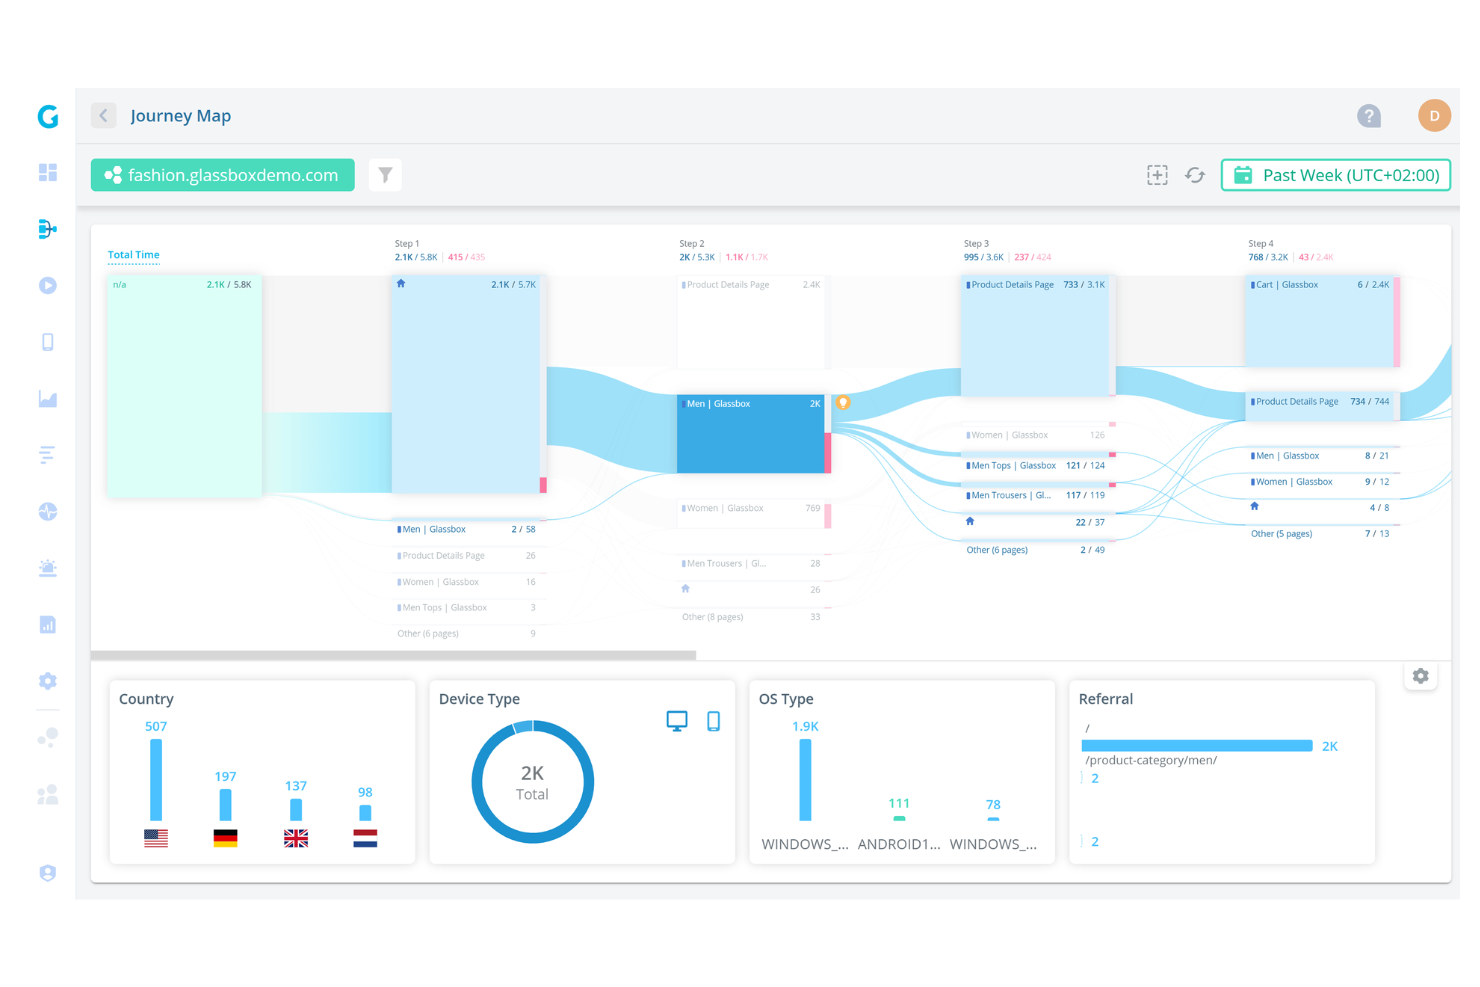
Glassbox is designed for organizations that need to capture and analyze digital sessions while meeting strict compliance requirements. It’s especially relevant for teams in regulated industries like finance, insurance, and healthcare who need to monitor user journeys without risking sensitive data exposure. With features like privacy-first session replay and audit-ready reporting, Glassbox helps you uncover user friction while supporting regulatory obligations.
Why I Picked Glassbox
What sets Glassbox apart for heatmap analysis is its focus on compliance and privacy, which is essential for teams in regulated sectors. I picked Glassbox because it offers privacy-first session replay, masking sensitive data while still providing detailed behavioral insights. The platform also includes audit-ready reporting, making it easier to demonstrate compliance during internal or external reviews. If your organization needs to balance user experience optimization with strict data governance, Glassbox is built to address those needs.
Glassbox Key Features
Some other features that make Glassbox valuable for heatmap analysis include:
- Dynamic Heatmaps: Visualizes user interactions on both web and mobile platforms, including clicks, taps, and scrolls.
- Funnel Analysis: Tracks user progression through multi-step processes to identify where drop-offs occur.
- Tagless Data Capture: Collects behavioral data without requiring manual tagging of page elements.
- Real-Time Alerts: Notifies teams instantly when unusual visitor behaviors or technical issues are detected.
Glassbox Integrations
Integrations include Adobe Analytics, Google Analytics, New Relic, Dynatrace, Google Tag Manager, Tealium, Qualtrics, Medallia, Jira, and more.
Pros and Cons
Pros:
- Real-time alerts for behavioral anomalies
- Tagless data capture reduces manual setup
- Session replays mask sensitive user data
Cons:
- Restricted dashboard customization options
- Exports limited to certain formats
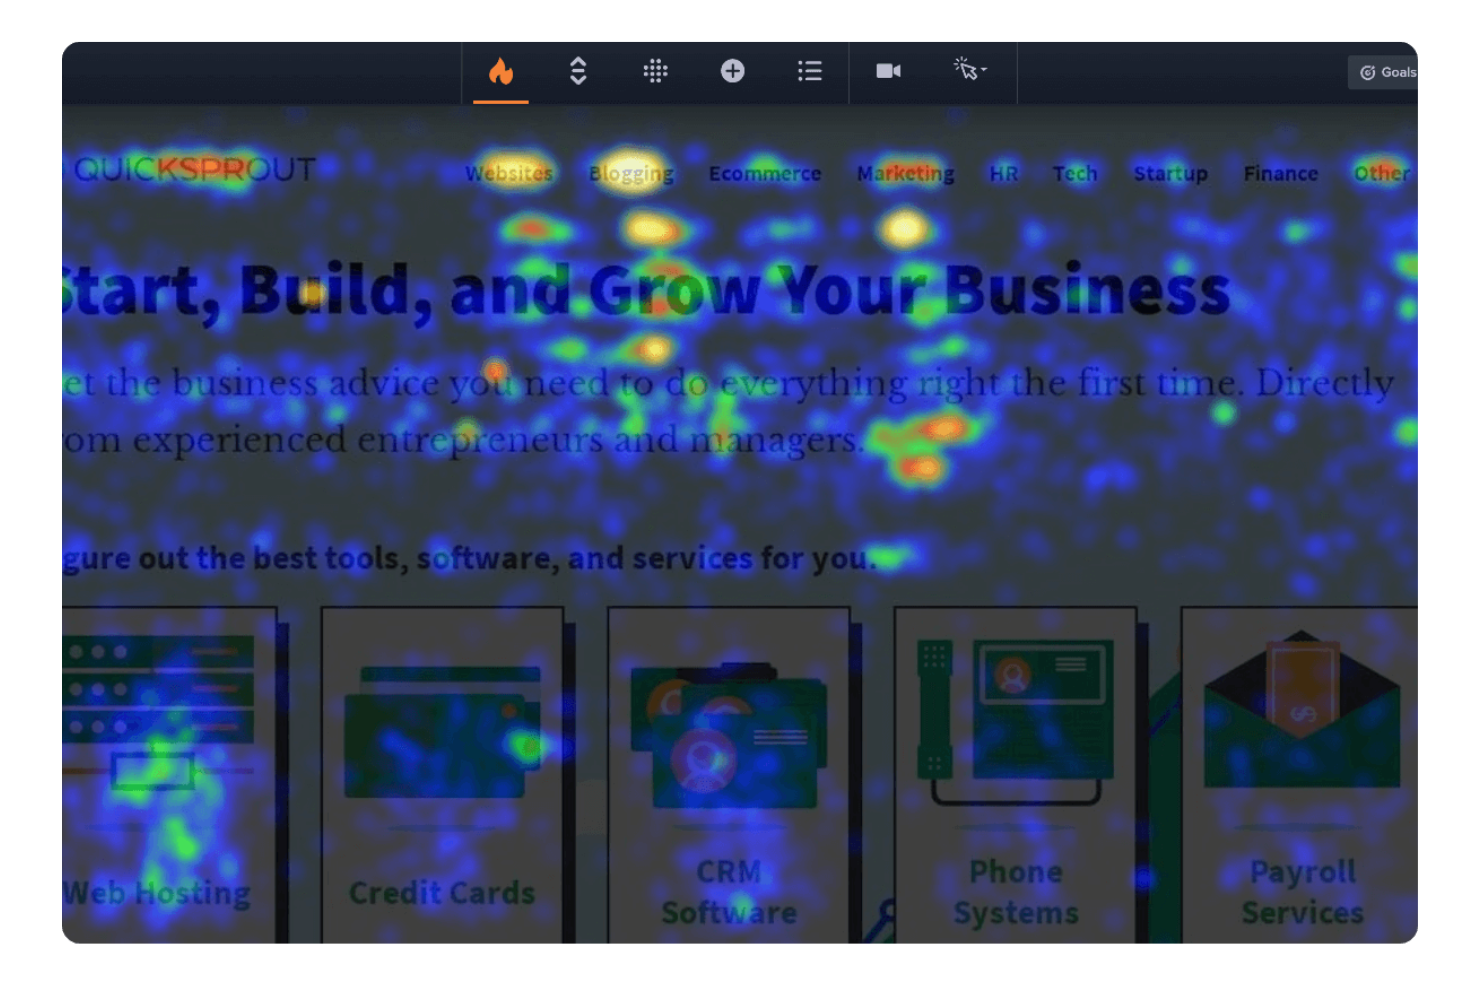
Crazy Egg is built for marketers and product teams who want to quickly test and validate changes on their websites. Its combination of heatmaps and rapid A/B testing helps you see how real users interact with new layouts or content. If you need fast, visual feedback on what’s working and what isn’t, Crazy Egg is designed to deliver actionable insights without a long setup.
Why I Picked Crazy Egg
When you need to move quickly from insight to action, Crazy Egg’s rapid A/B testing stands out among heatmap software. I picked Crazy Egg because it lets you launch and monitor A/B tests directly alongside heatmaps, so you can see how design changes impact user behavior in real time. The tool’s snapshot reports and confetti maps help you visualize exactly where users click and how those patterns shift after a test. This makes it a strong choice for teams that want to experiment, validate, and iterate on web pages without waiting weeks for results.
Crazy Egg Key Features
Some other features in Crazy Egg that help you analyze user behavior include:
- Scrollmaps: Visualize how far users scroll down each page to identify where attention drops off.
- Overlay Reports: See click data layered over your site’s actual design for context on user interactions.
- User Recordings: Watch real user sessions to observe navigation paths and friction points.
- Traffic Analysis: Break down the heatmap and test data by traffic source to compare how different audiences behave.
Crazy Egg Integrations
Integrations include Google Tag Manager, Shopify, and WordPress.
Pros and Cons
Pros:
- Overlay reports show clicks on specific elements
- Confetti reports segment clicks by referral source
- A/B testing is built into the platform
Cons:
- Limited support for single-page applications
- Requires manual setup for each page
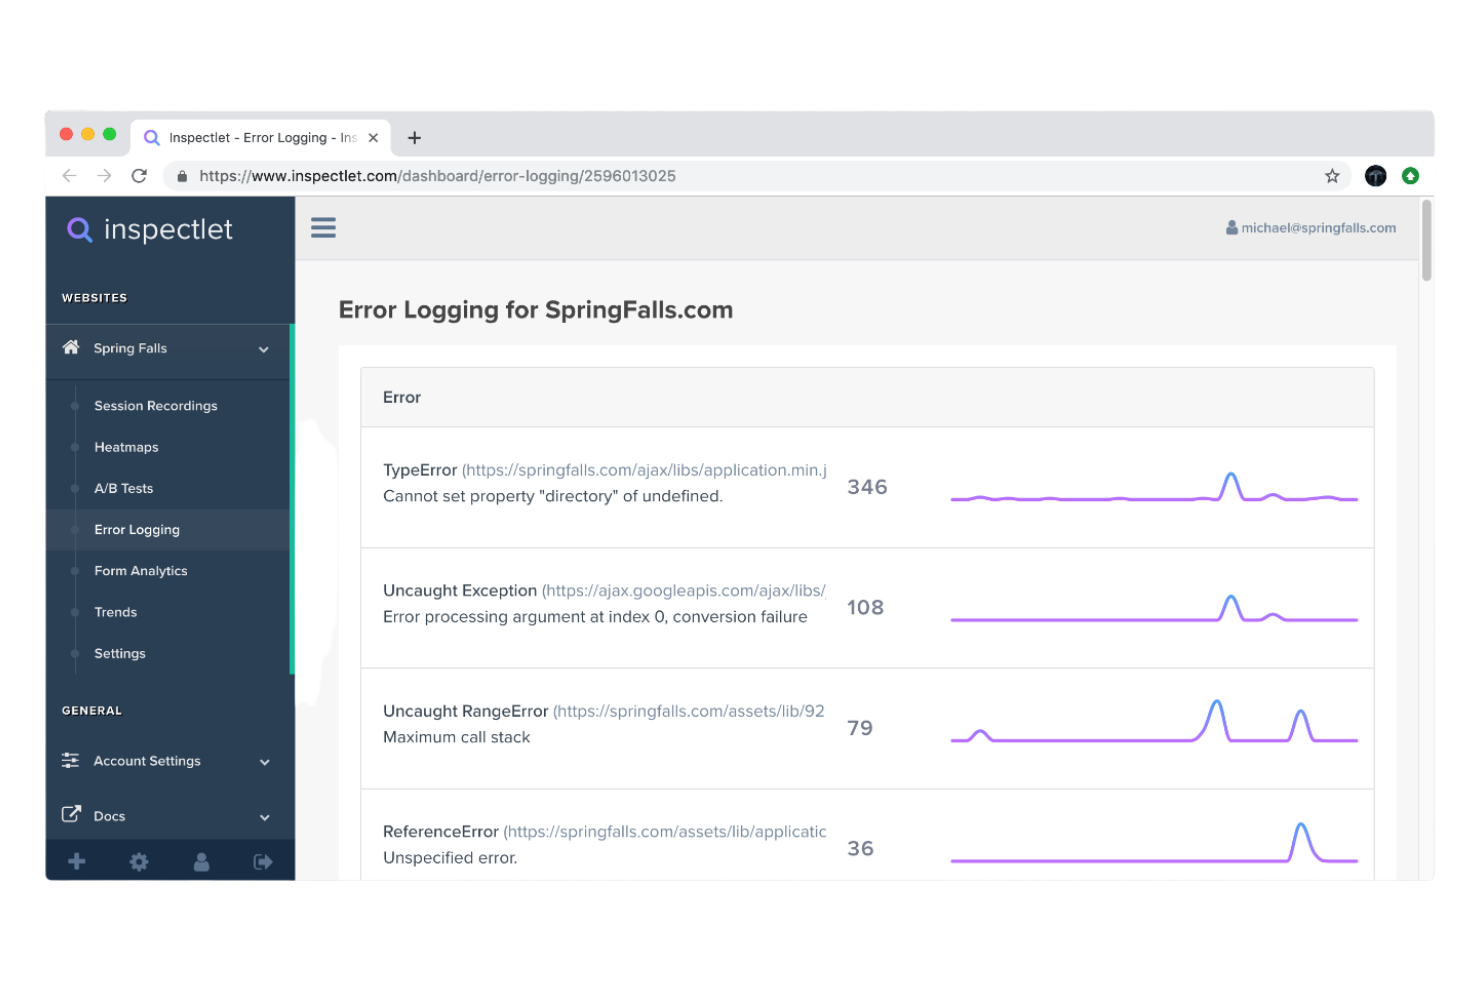
Inspectlet is built for teams that need to drill down into user behavior with precision, especially product managers and UX researchers working on complex sites. The platform stands out for its advanced session filtering, letting you isolate recordings by user actions, traffic source, or custom tags. If you’re looking to pinpoint specific friction points or analyze niche user segments, Inspectlet gives you granular control over what you see.
Why I Picked Inspectlet
Unlike many heatmap tools that offer only basic filtering, Inspectlet gives you advanced controls to segment and analyze user sessions in detail. I picked Inspectlet because you can filter recordings by specific actions, such as clicks on certain elements, page visits, or even custom JavaScript events. This level of granularity is especially useful for teams working on large or complex sites where finding patterns in user behavior requires more than just surface-level data. With Inspectlet, you can quickly zero in on the exact sessions that matter most to your analysis.
Inspectlet Key Features
Some other features in Inspectlet help you get a deeper understanding of user interactions across your site:
- Eye Tracking Heatmaps: Visualizes where users focus their attention on each page.
- Form Analytics: Tracks how users interact with form fields and where they abandon forms.
- Tagging and Annotations: Lets you add notes and tags to specific sessions for team collaboration.
- Custom Event Tracking: Allows you to define and monitor unique user actions beyond standard clicks and scrolls.
Inspectlet Integrations
Integrations include Google Analytics, HubSpot, Intercom, Slack, Mailchimp, Shopify, WordPress, Salesforce, Zendesk, and more.
Pros and Cons
Pros:
- Tag sessions for collaborative team review
- Eye tracking heatmaps visualize attention zones
- Advanced filters target specific user behaviors
Cons:
- Mobile heatmaps lack granular interaction details
- Heatmap data limited on single-page apps
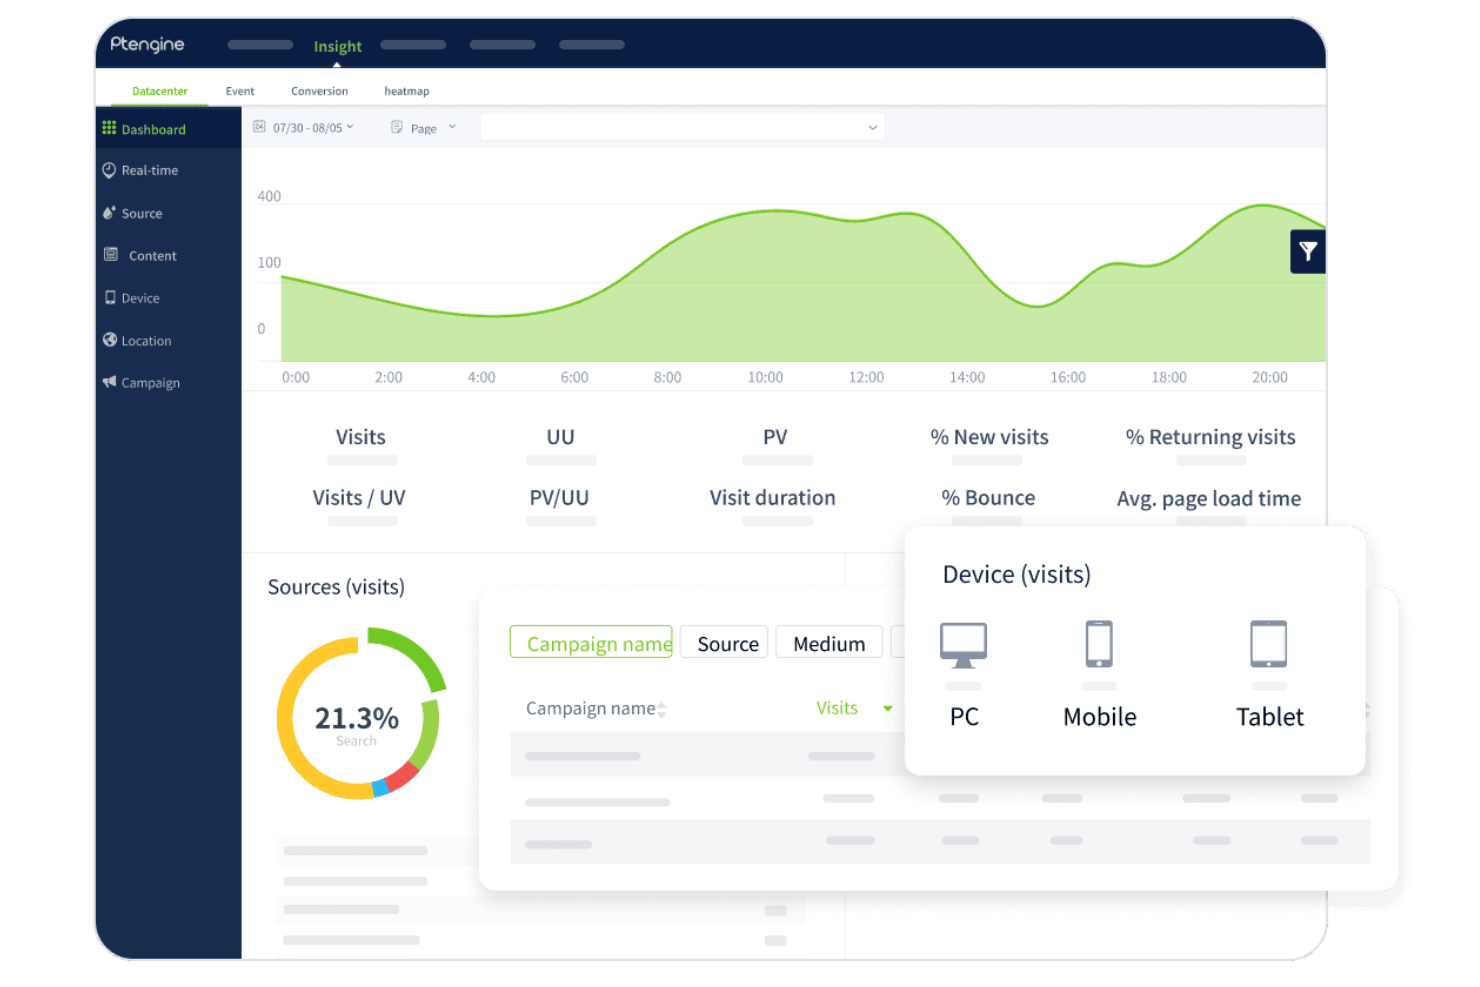
Ptengine combines heatmap analytics with campaign management, letting marketing teams track user behavior and campaign performance in one place. This approach appeals to digital marketers and e-commerce teams who want to connect engagement data directly to campaign outcomes. If you need to optimize landing pages and measure campaign ROI using visual analytics, Ptengine offers a unified solution.
Why I Picked Ptengine
What sets Ptengine apart is its ability to blend heatmap analytics with campaign tracking in a single platform. I picked Ptengine because it lets you visualize user interactions while directly measuring the impact of marketing campaigns on those behaviors. You can set up campaign-specific heatmaps, track conversions tied to different traffic sources, and analyze how users from each campaign engage with your site. This makes Ptengine a strong choice for marketers who want to connect user experience insights with campaign performance data.
Ptengine Key Features
I also found several features that help teams get more from their analytics:
- Scroll Heatmaps: Visualizes how far users scroll on each page to identify content drop-off points.
- A/B Testing Tools: Lets you run and analyze split tests directly within the platform.
- Form Analytics: Tracks form field interactions and abandonment rates for web forms.
- Real-Time Analytics Dashboard: Displays live user activity and engagement metrics as they happen.
Ptengine Integrations
Integrations include Optimizely, Shopify, and more.
Pros and Cons
Pros:
- Tracks form field interactions and drop-offs
- Provides real-time user activity tracking
- Offers scroll and attention heatmap types
Cons:
- Plans have strict data and feature limits
- Export options for heatmap data are basic
Other Heatmap Tools
Here are some additional heatmap tools options that didn’t make it onto my shortlist, but are still worth checking out:
- Microsoft Clarity
For unlimited session recordings
- Zoho Pagesense
For integration with marketing platforms
- Omniconvert
For e-commerce conversion insights
- Instapage
With landing page optimization features
- VWO
For integrated A/B testing workflows
- UXCam
For mobile app user journey analysis
- Sprig
For combining surveys with visual data
- Attention Insight
For AI-powered attention prediction
- Heatmapper
For academic research visualization


Heatmap Tools Selection Criteria
When selecting the best heatmap tools to include in this list, I considered common buyer needs and pain points like identifying user friction points and visualizing user engagement on key pages. I also used the following framework to keep my evaluation structured and fair:
Core Functionality (25% of total score)
To be considered for inclusion in this list, each solution had to fulfill these common use cases:
- Track user clicks and taps
- Visualize scroll depth on pages
- Record and replay user sessions
- Segment data by device or user type
- Export heatmap reports
Additional Standout Features (25% of total score)
To help further narrow down the competition, I also looked for unique features, such as:
- Real-time anomaly detection
- AI-powered attention prediction
- Integration with A/B testing tools
- Advanced journey mapping
- Custom event tracking
Usability (10% of total score)
To get a sense of the usability of each system, I considered the following:
- Simple and intuitive dashboard navigation
- Clear visualization of heatmap data
- Minimal steps to set up tracking
- Responsive design for all devices
- Customizable reporting views
Onboarding (10% of total score)
To evaluate the onboarding experience for each platform, I considered the following:
- Availability of step-by-step setup guides
- Access to training videos for beginners
- Interactive product tours for new users
- Prebuilt templates for common use cases
- Live chat or chatbot support during onboarding
Customer Support (10% of total score)
To assess each software provider’s customer support services, I considered the following:
- 24/7 support availability
- Fast response times to inquiries
- Access to a searchable help center
- Dedicated account management for enterprise
- Community forums or user groups
Value For Money (10% of total score)
To evaluate the value for money of each platform, I considered the following:
- Transparent and flexible paid plans
- Free trial or demo availability
- Features included at each price point
- No hidden fees or surprise charges
- Discounts for annual billing or volume
Customer Reviews (10% of total score)
To get a sense of overall customer satisfaction, I considered the following when reading customer reviews:
- Positive feedback on feature reliability
- Reports of responsive customer support
- Comments on ease of implementation
- User satisfaction with data accuracy
- Value perception compared to competitors
How to Choose Heatmap Tools
It’s easy to get bogged down in long feature lists and complex pricing structures. To help you stay focused as you work through your unique software selection process, here’s a checklist of factors to keep in mind:
| Factor | What to Consider |
|---|---|
| Scalability | Will the tool handle your current and projected website or app traffic without extra costs or slowdowns? Check for volume limits and upgrade paths. |
| Integrations | Does the tool connect natively with your analytics, CRM, or A/B testing platforms? Confirm compatibility with your existing stack to avoid manual work. |
| Customizability | Can you tailor tracking, reporting, and dashboards to your team’s needs? Look for flexible segmentation, custom events, and export options. |
| Ease of use | Will your team be able to set up and interpret website heatmaps without extensive training? Test the interface and review available documentation. |
| Implementation and onboarding | How long will it take to deploy the tool and start collecting actionable data? Ask about setup steps, required code changes, and onboarding resources. |
| Cost | Are pricing tiers transparent and predictable as your usage grows? Watch for hidden fees, overage charges, or required add-ons. |
| Security safeguards | Does the tool offer data encryption, user access controls, and compliance with privacy regulations like GDPR? Review security documentation and audit options. |
| Support availability | Will you have access to timely help if issues arise? Check for live chat, phone support, and dedicated account management, especially if you have a global team. |
What Are Heatmap Tools?
Heatmap tools are software platforms that visualize user interactions—such as clicks, taps, and scrolls—on websites or apps using color-coded overlays. These tools help you quickly identify which areas attract the most attention and where users encounter friction.
By translating behavioral data into visual maps, heatmap tools support teams in optimizing layouts, improving user experience, and making data-driven design decisions.
Features
When selecting heatmap tools, keep an eye out for the following key features:
- Visitor click tracking: Captures and visualizes where users click or tap on each page, helping you identify popular elements and areas that may be ignored.
- Scroll mapping: Shows how far users scroll down a page, revealing where attention drops off and which content is most engaging.
- Session replay: Records and plays back individual user sessions so you can observe real user journeys and spot usability issues.
- Device segmentation: Allows you to filter heatmap data by device type, such as desktop, tablet, or mobile, to compare user behavior across platforms.
- Form analytics: Tracks interactions with pop-ups and form fields, highlighting where users hesitate, drop off, or make errors during the completion process.
- User segmentation: Lets you break down heatmap data by user attributes like location, traffic source, or behavior for more targeted analysis.
- Export and sharing options: Enables you to download heatmaps or generate shareable links, making it easier to collaborate with stakeholders or include visuals in reports.
- Event tracking: Lets you define and monitor custom user actions—such as video plays or downloads—beyond standard clicks and scrolls.
- Page grouping: Groups similar pages together (like product or blog pages) so you can analyze aggregate user behavior across templates or sections.
- GDPR and privacy controls: Provides tools to mask sensitive data and ensure compliance with privacy regulations when collecting and storing user interaction data.
Common Heatmap Tools AI Features
Beyond the standard heatmap tools features listed above, many of these solutions are incorporating AI with features like:
- Automated anomaly detection: Uses AI to monitor user behavior patterns and automatically flag unusual activity or sudden changes in engagement, helping teams quickly identify emerging issues.
- Predictive attention mapping: Leverages AI models to forecast which areas of a page are most likely to attract user attention, even before real user data is collected.
- Session clustering: Applies AI algorithms to group similar user sessions together, making it easier to spot common behaviors, pain points, or conversion paths without manual sorting.
- Automated insight generation: Uses AI to analyze large volumes of interaction data and surface actionable recommendations or trends, reducing the need for manual data exploration.
- Smart segmentation: Employs AI to dynamically segment users based on behavioral patterns, enabling more targeted analysis and conversion optimization strategies.
Benefits
Implementing heatmap tools provides several benefits for your team and your business. Here are a few you can look forward to:
- Faster identification of user friction: Visualizing clicks, scrolls, and form interactions helps you quickly spot where users struggle or drop off.
- Data-driven decision-making: Color-coded overlays and session replays provide concrete evidence to guide layout and content changes.
- Improved conversion rates: Insights from user segmentation and customer journey mapping allow you to optimize key pages and reduce abandonment.
- Enhanced collaboration: Export and sharing features make it easy to communicate findings and align stakeholders on priorities.
- Personalized user experience: Device and user segmentation features help you tailor site improvements to specific audiences or platforms.
- Proactive issue detection: AI-powered anomaly detection and automated insights alert you to emerging problems before they impact business metrics.
- Stronger compliance and privacy: Built-in GDPR controls and data masking features help you protect user information and meet regulatory requirements.
Costs and Pricing
Selecting heatmap tools requires an understanding of the various pricing models and plans available. Costs vary based on features, team size, add-ons, and more. The table below summarizes common plans, their average prices, and typical features included in heatmap tools solutions:
Plan Comparison Table for Heatmap Tools
| Plan Type | Average Price | Common Features |
|---|---|---|
| Free Plan | $0 | Basic click and scroll heatmaps, limited session recordings, basic reporting, and single-user access. |
| Personal Plan | $20-$50/month | Unlimited heatmaps, device segmentation, export options, priority email support, and limited integrations. |
| Business Plan | $80-$200/month | Advanced segmentation, session replay, form analytics, team collaboration tools, and API access. |
| Enterprise Plan | $400-$1,000+/month | Custom event tracking, dedicated account management, advanced security, SLA support, and compliance features. |
Heatmap Tools FAQs
Here are some answers to common questions about heatmap tools:
How do heatmap tools collect user interaction data?
Heatmap tools collect user interaction data by embedding a tracking script on your website or app. This script records actions like clicks, taps, and scrolls, then aggregates and visualizes the data as color-coded overlays. Most tools anonymize data to protect user privacy.
Can heatmap tools be used on mobile apps as well as websites?
Yes, many heatmap tools support both mobile apps and websites. Some solutions offer SDKs for iOS and Android, allowing you to track taps, gestures, and navigation patterns within native mobile environments.
Are heatmap tools compliant with privacy regulations like GDPR?
Yes, most reputable heatmap tools offer features to help you comply with privacy regulations such as GDPR. These include data masking, opt-out options, and controls for excluding sensitive information from tracking.
What types of user behaviors can heatmap tools visualize?
Heatmap tools can visualize clicks, taps, scroll depth, mouse movement, and form interactions. Some advanced tools also provide session replays and custom event tracking for deeper behavioral analysis.
How much technical expertise is needed to implement heatmap tools?
Most heatmap tools are designed for easy implementation, often requiring just a simple script or plugin installation. However, advanced features like custom event tracking or integrations may require some technical knowledge or developer support.
Can heatmap tools integrate with other analytics platforms?
Yes, many heatmap tools offer integrations with analytics platforms, A/B testing tools, and CRM systems. This allows you to use heatmaps and combine the behavioral insights with broader marketing and conversion data for a more complete view.