14 Web Analytics Tools Picked for 2026

10 Web Analytics Tools Shortlist
Here's my pick of the 10 best software from the 14 tools reviewed.


Web analytics tools are software platforms that track, measure, and report on website traffic and user behavior. If you’re searching for the best web analytics tools, you’re likely aiming to understand how visitors interact with your site, identify growth opportunities, and make data-driven decisions that impact your marketing results.
Many modern platforms are delivered as SaaS solutions and include privacy-friendly features to help teams comply with evolving data regulations while still gaining valuable insights. With so many options available, it’s tough to know which platform fits your needs, tech stack, and reporting goals. This list will help you compare leading solutions for 2026, so you can confidently choose the right tool to monitor performance, optimize campaigns, and align your analytics with business objectives.
Why Trust Our Software Reviews
Web Analytics Tools Summary
This comparison chart summarizes pricing details for my top web analytics tools selections to help you find the best software for your budget and business needs.
| Tool | Best For | Trial Info | Price | ||
|---|---|---|---|---|---|
| 1 | Best for quick website audit reports | 14-day free trial available | From $29/month | Website | |
| 2 | Best for real-time digital experience insights | Free demo available | Pricing upon request | Website | |
| 3 | Best for session replay and user journey analysis | Free plan + free demo available | Pricing upon request | Website | |
| 4 | Best for competitor traffic benchmarking | Free trial available | From $125/month (billed annually) | Website | |
| 5 | Best for monitoring on-page SEO health | 14-day free trial available | From $50/month | Website | |
| 6 | Best for enterprise SEO performance tracking | Free demo available | Pricing upon request | Website | |
| 7 | Best for advanced cross-channel attribution | Free plan available | Pricing upon request | Website | |
| 8 | Best for customizable data visualization | Free plan available | Pricing upon request | Website | |
| 9 | Best for technical site crawling | Free plan available | From $235/license/year | Website | |
| 10 | Best for optimizing Bing search presence | Not available | Free forever | Website |
-

Eloqua
Visit WebsiteThis is an aggregated rating for this tool including ratings from Crozdesk users and ratings from other sites.4.3 -
Optimizely
Visit WebsiteThis is an aggregated rating for this tool including ratings from Crozdesk users and ratings from other sites.4.2 -
Uberflip
Visit WebsiteThis is an aggregated rating for this tool including ratings from Crozdesk users and ratings from other sites.4.3


Web Analytics Tools Reviews
Below are my detailed summaries of the web analytics tools that made it onto my shortlist. My reviews offer a detailed look at the features, best use cases, and integrations of each platform to help you find the best one for you.
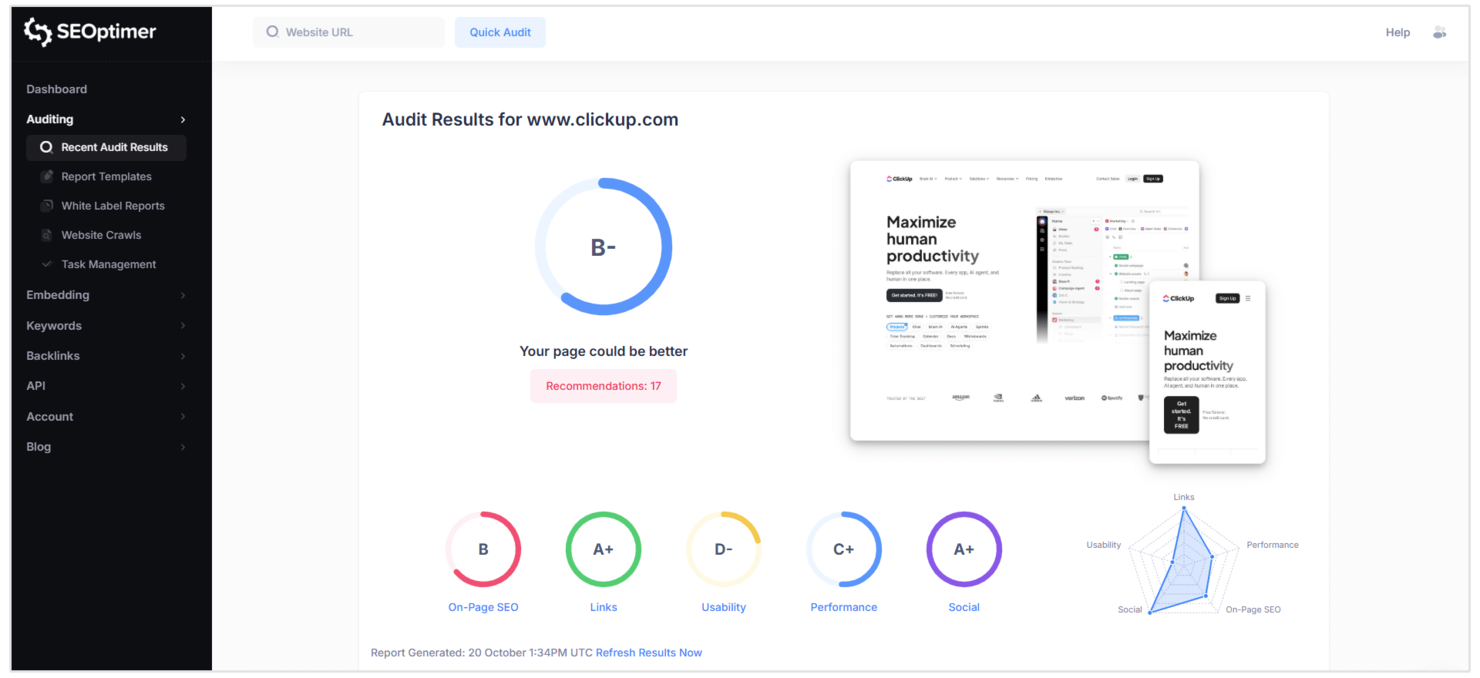
SEOptimer is built for marketers and small business owners who need fast, actionable website audit reports. The tool delivers clear, prioritized recommendations across SEO, usability, and performance in just seconds. If you want a straightforward way to spot and fix site issues without digging through complex analytics, SEOptimer is a practical choice.
Why I Picked SEOptimer
What drew me to SEOptimer is how quickly it generates detailed website audit reports, which is especially useful for teams that need instant feedback on site health. The platform scans your site and delivers a clear, prioritized checklist covering SEO, mobile usability, and technical performance. I appreciate that you can download branded PDF reports, making it easy to share findings with clients or stakeholders. For anyone who needs actionable insights without waiting or wading through complex dashboards, SEOptimer delivers on speed and clarity.
SEOptimer Key Features
Some other features make SEOptimer useful for web analytics teams:
- White Label Reporting: Create custom-branded audit reports for clients or internal teams.
- Embeddable Audit Tool: Add a website audit widget directly to your own site to capture leads.
- Keyword Tracking: Monitor keyword rankings over time for multiple websites.
- Backlink Analysis: Review your site’s backlink profile and identify new link opportunities.
SEOptimer Integrations
Integrations include Zapier and a native API for custom integrations.
Pros and Cons
Pros:
- Includes an embeddable audit tool for lead capture
- Offers white-label PDF reporting for agencies
- Generates audit reports in under a minute
Cons:
- Backlink analysis is less detailed than competitors
- Lacks real-time traffic analytics dashboard
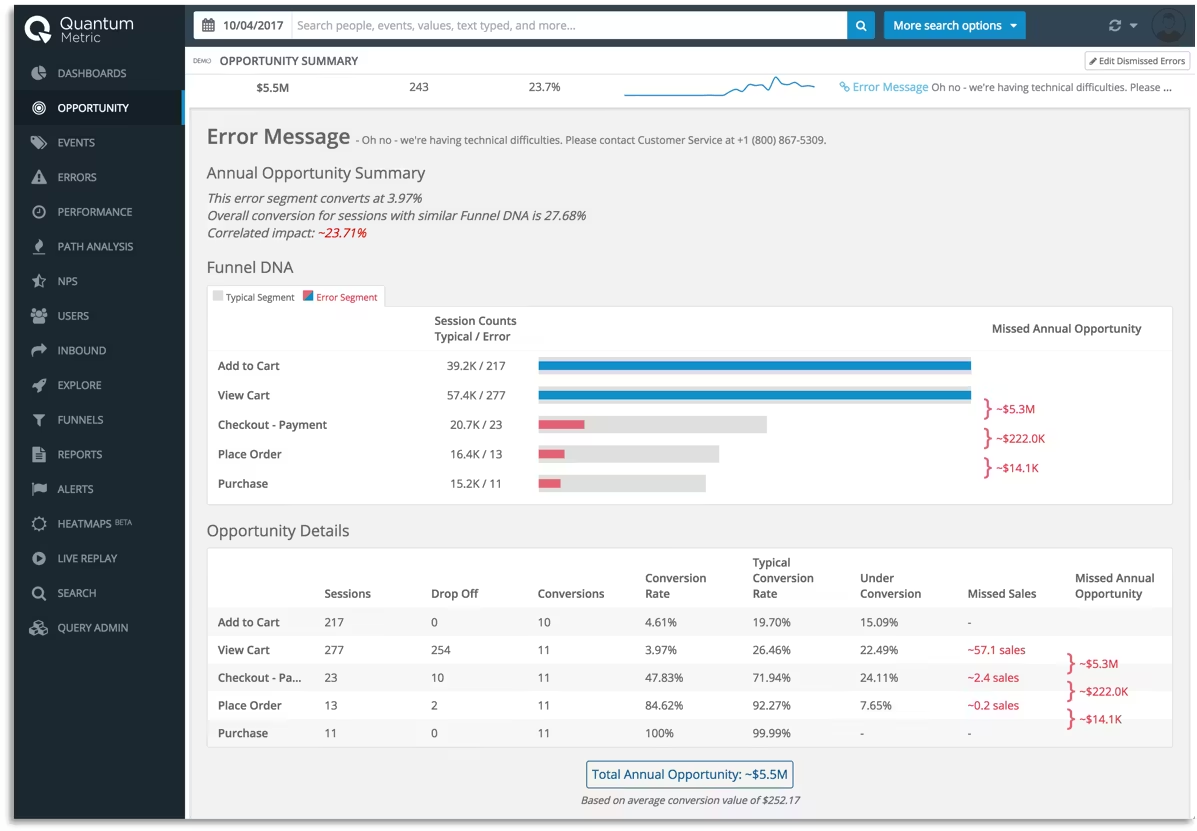
If you need to pinpoint digital experience issues as they happen, Quantum Metric delivers real-time insights that help teams act fast. This platform is built for digital product managers, UX teams, and ecommerce leaders who want to understand user behavior at a granular level. Quantum Metric stands out for its ability to surface friction points and quantify their impact on revenue in the moment.
Why I Picked Quantum Metric
What drew me to Quantum Metric is its focus on delivering real-time digital experience insights that go beyond standard web analytics. The platform captures user sessions and surfaces friction points as they occur, so teams can quickly identify and prioritize issues impacting conversion. I appreciate how Quantum Metric quantifies the business impact of each user struggle, making it easier to align technical fixes with revenue goals. For anyone who needs to react to digital experience problems as they happen, this tool offers the immediacy and depth that traditional analytics platforms often lack.
Quantum Metric Key Features
Some other features that make Quantum Metric valuable for web analytics teams include:
- Session Replay: Watch real user sessions to see exactly how visitors interact with your site or app.
- Automated Anomaly Detection: Get alerts when user behavior deviates from expected patterns.
- Journey Analytics: Visualize and analyze user flows across multiple touchpoints.
- Tagless Data Capture: Collect behavioral data without manual tagging or code changes.
Quantum Metric Integrations
Integrations include AB Tasty, Split, Novotech, Botcopy, ServiceNow, Qualtrics, Salesforce Service Cloud, Looker, Slack, and more.
Pros and Cons
Pros:
- Tagless data capture reduces manual setup
- Automated anomaly detection flags sudden issues
- Session replay shows exact user interactions
Cons:
- Advanced features need dedicated onboarding
- Data exports require additional configuration steps
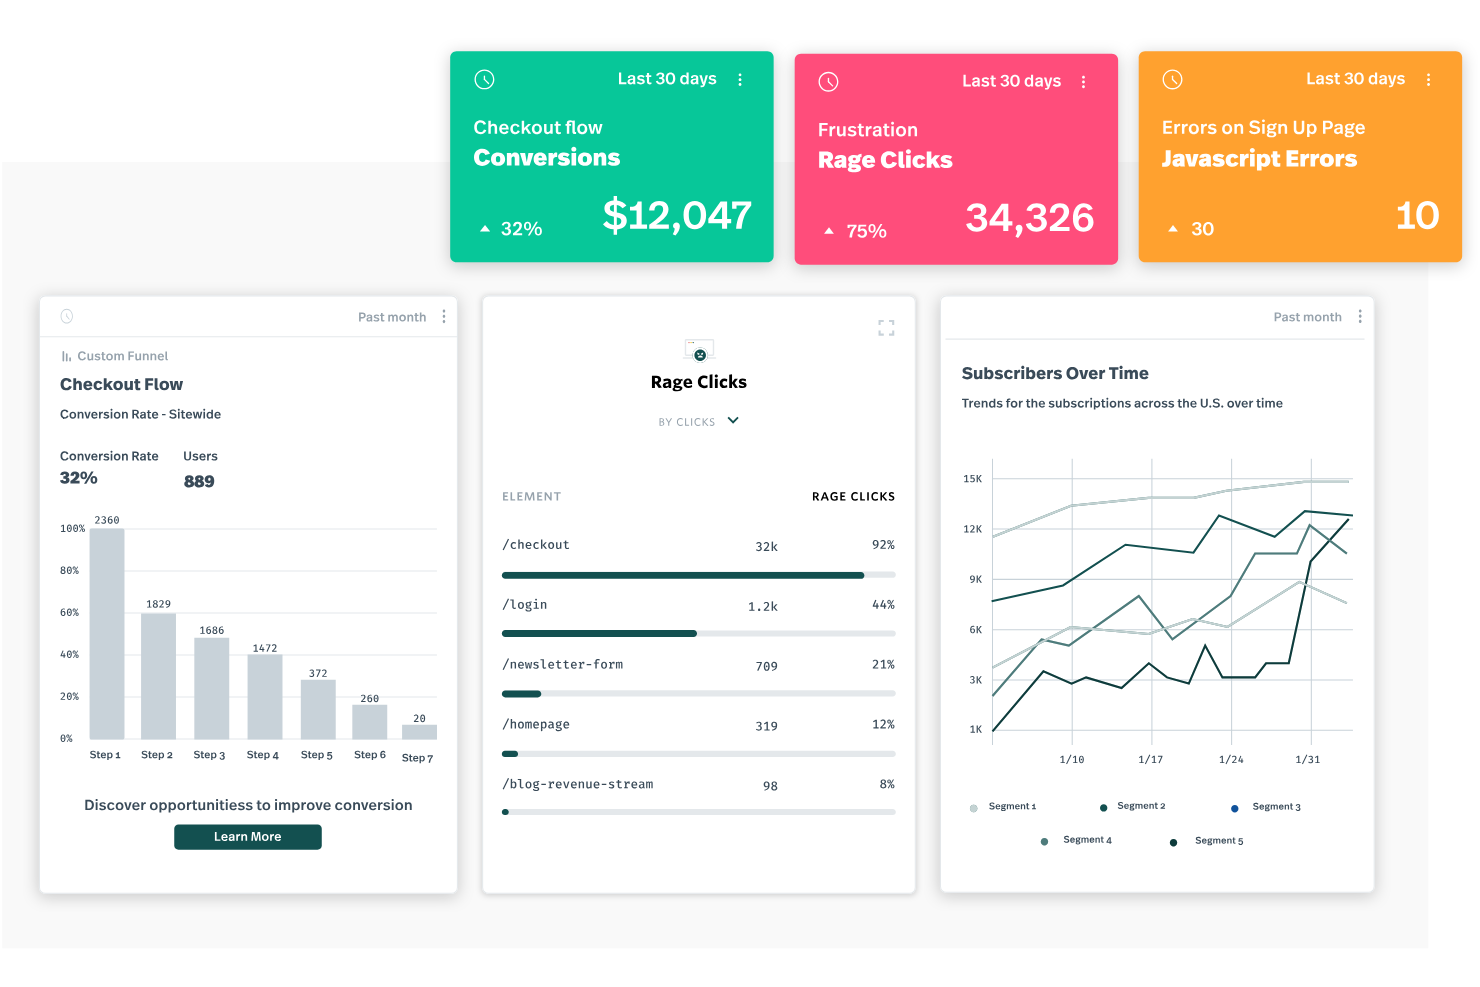
Fullstory gives product teams and digital marketers a way to see exactly how users interact with their websites and apps. The platform’s session replay and journey mapping features help you pinpoint friction points and understand user behavior in detail. If you need to visualize the full customer experience and uncover hidden UX issues, Fullstory offers a unique lens into real user journeys.
Why I Picked Fullstory
What sets Fullstory apart for me is its ability to capture and replay every user session, making it much easier to diagnose where users struggle or drop off. The session replay feature lets you watch real interactions, so you can see exactly what users experience on your site or app. I also like how Fullstory’s journey mapping visualizes the entire user path, helping you spot patterns and bottlenecks that traditional analytics might miss. For teams focused on optimizing user experience and conversion, these capabilities make Fullstory a strong choice.
Fullstory Key Features
Some other features make Fullstory valuable for web analytics teams:
- Heatmaps: Visualize aggregate user clicks, scrolls, and mouse movements across your site.
- Conversion Funnels: Build and analyze funnels to track where users drop off in key flows.
- Custom Event Tracking: Define and monitor specific user actions or behaviors without extra coding.
- Error Detection: Automatically surface JavaScript errors and user frustration signals during sessions.
Fullstory Integrations
Integrations include Segment, Google Analytics, Adobe Analytics, Slack, Jira, Zendesk, Optimizely, HubSpot, Salesforce, and more.
Pros and Cons
Pros:
- Frustration signals highlight UX pain points
- Heatmaps visualize aggregate user behavior
- Session replay shows full user interactions
Cons:
- Exporting raw data options are restricted
- Data sampling may miss some user sessions
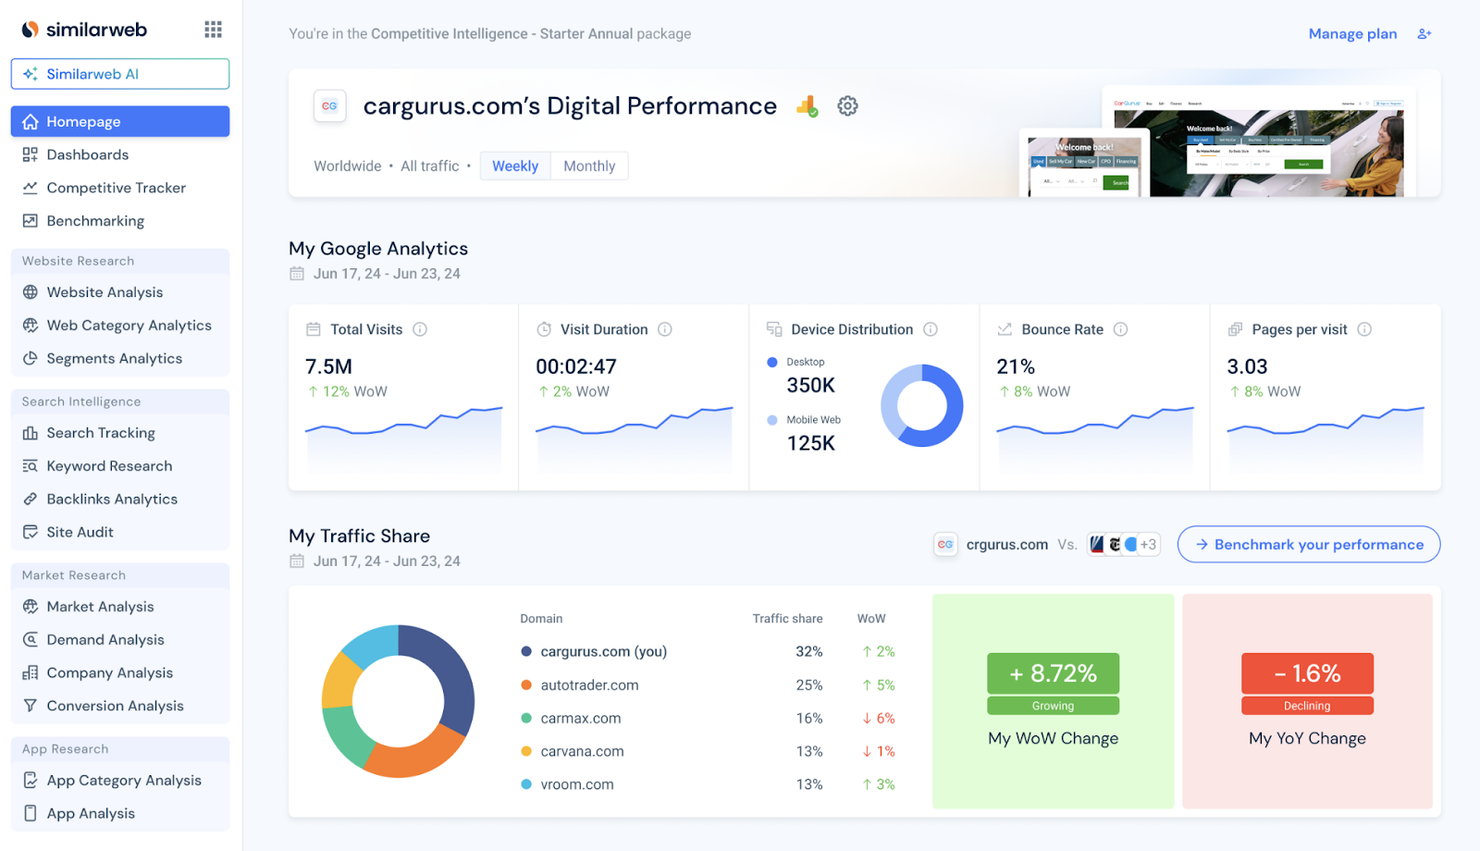
If you need to benchmark your website’s traffic against competitors, Similarweb gives you that visibility. The platform is designed for marketing teams, growth strategists, and digital analysts who want to understand market share, audience overlap, and traffic sources across any industry. Similarweb helps you uncover competitor strategies and spot new opportunities by providing detailed traffic and engagement data for any site.
Why I Picked Similarweb
For teams focused on understanding their position in the market, Similarweb offers unmatched competitor traffic benchmarking. I picked Similarweb because it provides detailed estimates of website visits, engagement metrics, and traffic sources for any domain, not just your own. The platform also breaks down audience demographics and referral channels, so you can see exactly where competitors are gaining traction. If you want to compare your digital performance to others in your industry, Similarweb gives you the data to do it.
Similarweb Key Features
Some other features make Similarweb valuable for digital market analysis:
- Keyword Research Tool: Discover top-performing keywords for any website or industry.
- Industry Analysis Reports: Access pre-built reports that summarize trends and benchmarks across entire sectors.
- Mobile App Analytics: Track downloads, usage, and engagement for mobile apps alongside web data.
- API Access: Integrate Similarweb data into your own dashboards or business intelligence tools.
Similarweb Integrations
Integrations include HubSpot and Salesforce.
Pros and Cons
Pros:
- Audience overlap analysis for market mapping
- Industry benchmarks available for multiple sectors
- Competitor traffic estimates cover global websites
Cons:
- Limited historical data for some smaller sites
- Data accuracy varies for low-traffic domains
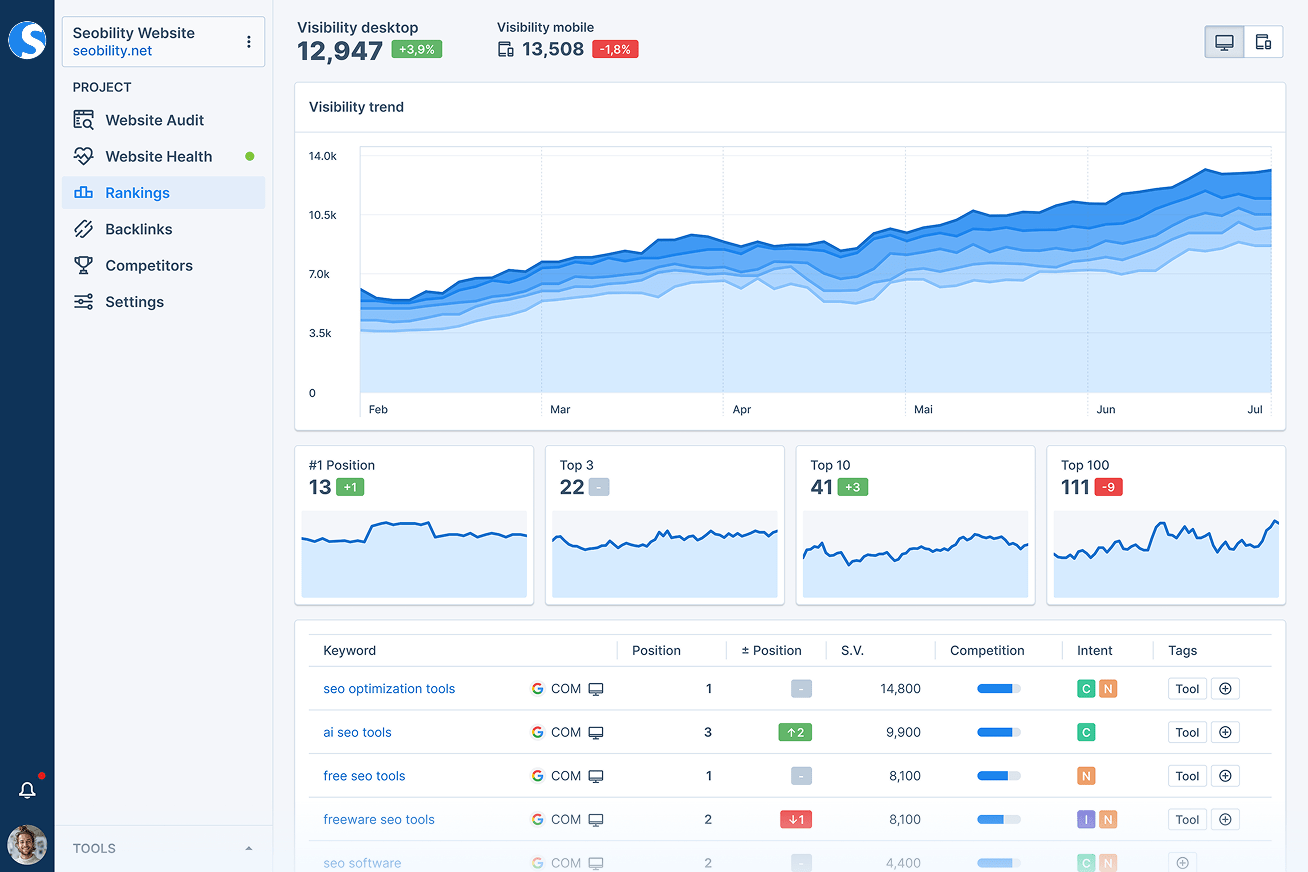
Seobility is designed for marketers and SEO specialists who need to keep a close eye on on-page SEO health. The platform automatically scans your website for technical issues, duplicate content, and optimization gaps that can impact search rankings. If you’re managing multiple sites or complex web properties, Seobility helps you spot and address on-page problems before they affect your visibility.
Why I Picked Seobility
For teams focused on maintaining strong on-page SEO health, Seobility offers targeted analytics that go beyond surface-level reporting. The tool continuously crawls your site to flag technical errors, broken links, and duplicate content that can hurt your rankings. I picked Seobility because its on-page audit reports and keyword monitoring features help you quickly identify and prioritize issues that matter most for search visibility. If you want a web analytics tool that specializes in keeping your site optimized for search engines, Seobility is built for that purpose.
Seobility Key Features
I also found several other features that make Seobility useful for web analytics and SEO management:
- Competitor Analysis: Track and compare your site’s SEO performance against selected competitors.
- Rank Tracking: Monitor keyword rankings across different search engines and locations.
- On-Page SEO Checker: Get actionable suggestions for improving individual page optimization.
- Backlink Monitoring: Analyze and track the status of your site’s backlinks over time.
Seobility Integrations
Native integrations are not currently listed.
Pros and Cons
Pros:
- Competitor analysis includes keyword and backlink data
- On-page SEO checker provides actionable suggestions
- Automated site crawling detects technical SEO issues
Cons:
- Site audit frequency is restricted on lower plans
- Lacks real-time traffic or user behavior data
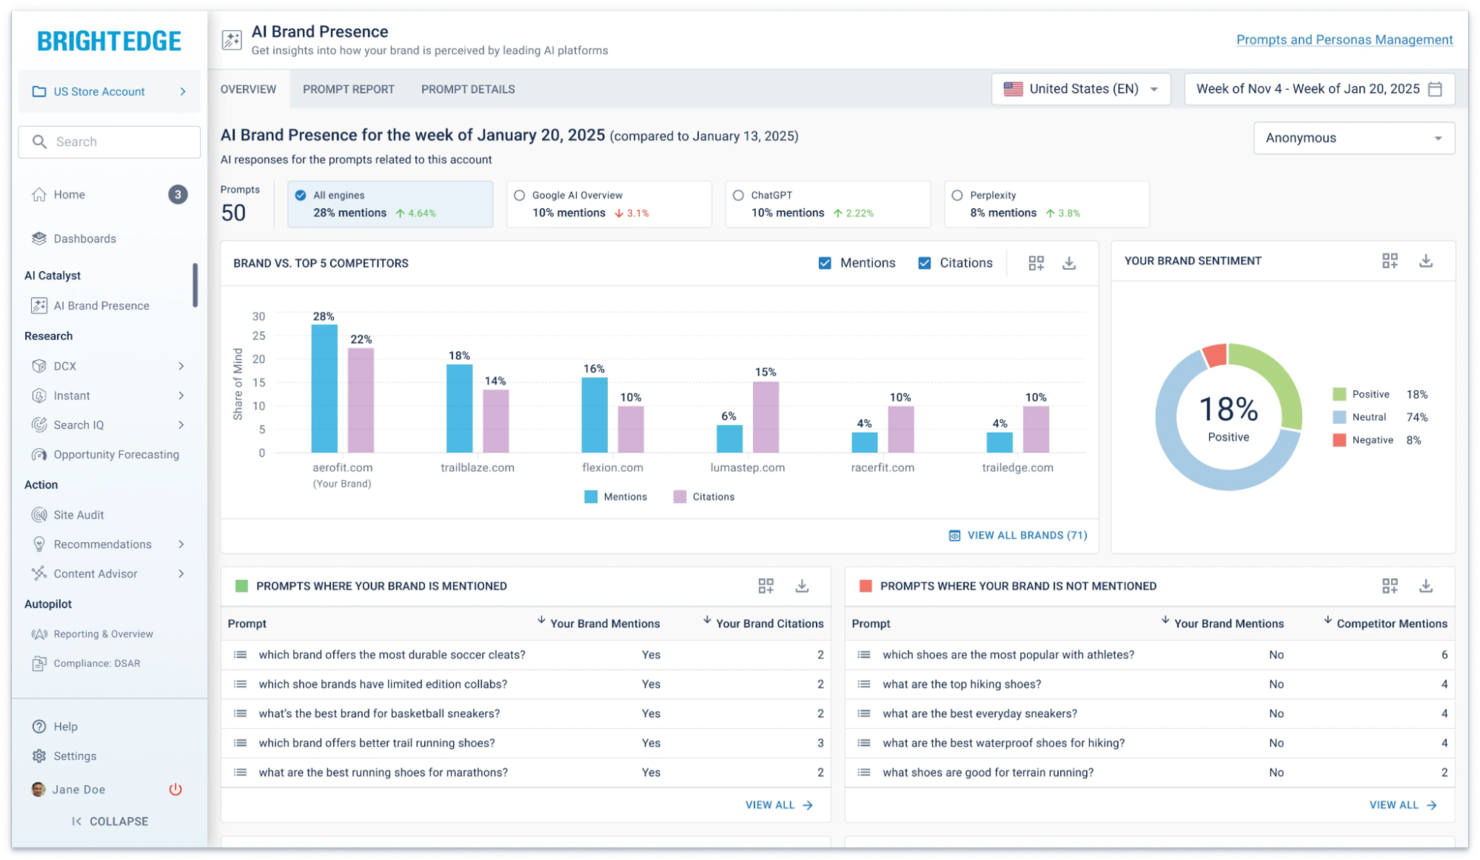
BrightEdge is designed for large organizations that need to track and optimize SEO performance at scale. Enterprise marketing teams and SEO professionals use it to monitor keyword rankings, analyze competitors, and measure the real business impact of organic search. Its focus on connecting SEO data directly to revenue and content performance makes it a strong fit for businesses where search visibility drives growth.
Why I Picked BrightEdge
BrightEdge stands out for its ability to track SEO performance at an enterprise level, which is essential for organizations managing large, complex websites. I picked it because it offers daily keyword tracking and competitive analysis tools that help you understand your position in search results across multiple markets. The platform’s Data Cube feature lets you analyze massive sets of search and content data, making it easier to connect SEO activities to business outcomes. For teams focused on tying organic search efforts directly to revenue and growth, BrightEdge delivers the depth and scale needed.
BrightEdge Key Features
Some other features make BrightEdge a strong choice for enterprise web analytics teams:
- Content Performance Tracking: Monitor how individual pages and content types perform in search and drive engagement.
- Site Audit Tools: Scan your website for technical SEO issues and receive prioritized recommendations for fixes.
- Opportunity Forecasting: Estimate the potential impact of SEO changes on traffic and revenue using built-in forecasting models.
- Automated Reporting: Set up scheduled, customizable reports to share SEO insights with stakeholders across your organization.
BrightEdge Integrations
Integrations include Google Analytics, Adobe Analytics, Google Search Console, Salesforce Marketing Cloud, Domo, OptimizelyOne, Adobe Marketing Cloud, and more.
Pros and Cons
Pros:
- Includes automated technical site audits
- Offers daily keyword and competitor updates
- Tracks SEO impact on actual revenue
Cons:
- Limited flexibility for custom dashboard layouts
- Requires annual contract commitment for access
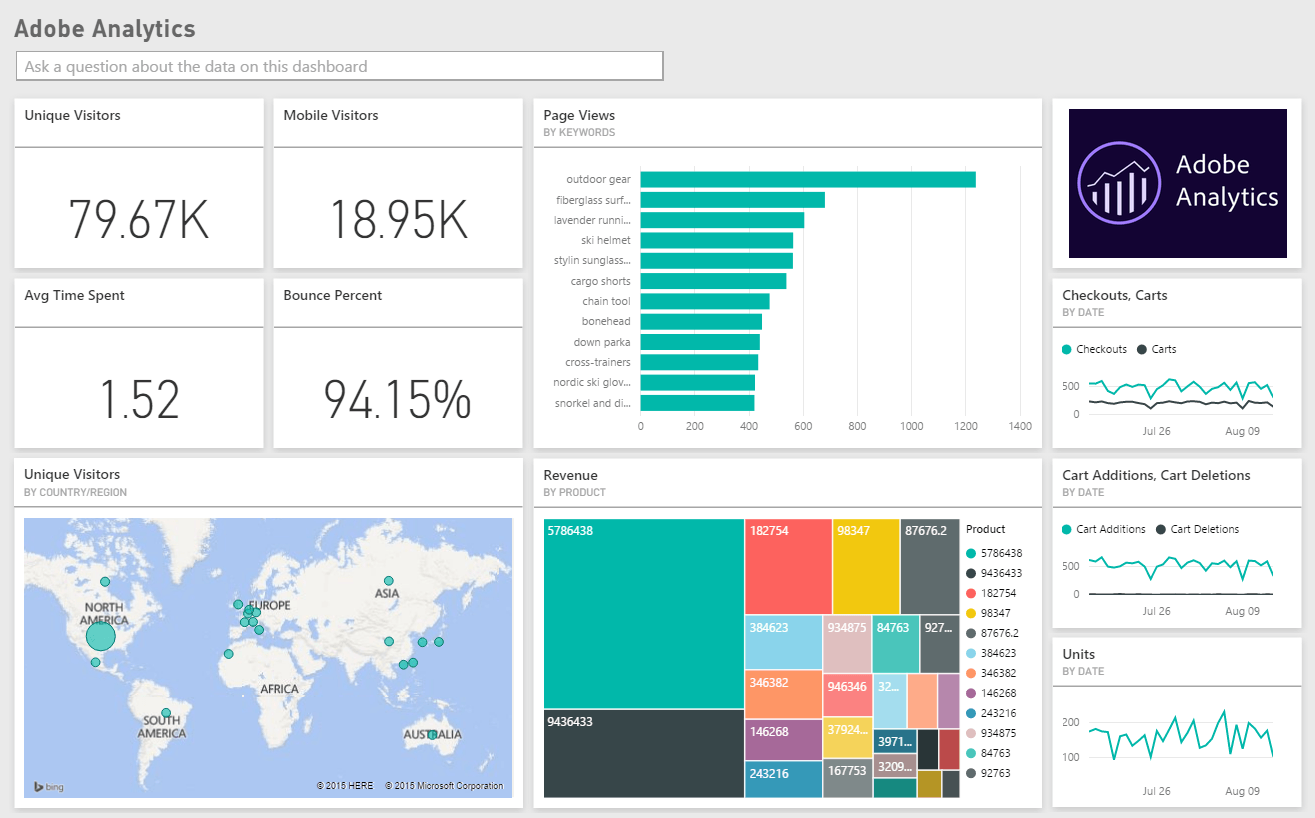
For marketing teams that need to understand how every channel contributes to conversions, Adobe Analytics offers advanced cross-channel attribution and deep data analysis. It’s designed for enterprise organizations and data-driven professionals who want to connect customer journeys across web, mobile, and offline touchpoints. The platform stands out for its ability to unify complex datasets and surface granular insights that drive strategic decisions.
Why I Picked Adobe Analytics
When you need to track and attribute user journeys across multiple channels, Adobe Analytics stands out for its advanced cross-channel attribution capabilities. I picked this tool because it lets you connect data from web, mobile, email, and even offline sources to build a unified view of customer behavior. The platform’s attribution modeling tools help you assign value to every touchpoint, so you can see exactly which channels drive conversions. For teams focused on optimizing multi-channel campaigns, Adobe Analytics offers the depth and flexibility needed to analyze complex customer paths.
Adobe Analytics Key Features
In addition to its attribution modeling, Adobe Analytics offers several other advanced capabilities:
- Real-Time Data Reporting: Access up-to-the-minute analytics dashboards for immediate performance monitoring.
- Custom Segmentation: Build and analyze audience segments using a wide range of behavioral and demographic criteria.
- Predictive Analytics: Use machine learning models to forecast trends and identify potential opportunities or risks.
- Data Visualization Tools: Create interactive reports and visualizations to share insights across your organization.
Adobe Analytics Integrations
Integrations include Adobe Experience Platform, Adobe Target, Adobe Campaign, Adobe Journey Optimizer, Adobe Real-Time CDP, and more.
Pros and Cons
Pros:
- Predictive analytics surfaces actionable trends
- Real-time dashboards update with live data
- Attribution models support complex customer journeys
Cons:
- Limited support for non-Adobe marketing plat
- Implementation requires technical expertise and planning

If you need to turn complex web data into clear, interactive dashboards, Looker Studio offers a flexible solution. This platform is especially useful for marketing teams and analysts who want to build custom reports that pull from multiple data sources. Its drag-and-drop interface and wide range of visualization options help you present analytics in a way that’s easy for stakeholders to understand.
Why I Picked Looker Studio
What sets Looker Studio apart for web analytics is its deep focus on customizable data visualization. I picked it because you can design dashboards that fit your exact reporting needs, using a wide range of chart types, filters, and calculated fields. The platform lets you blend data from multiple sources, so you can compare website metrics alongside campaign or sales data in one place. This level of flexibility is especially valuable if you need to present analytics to different stakeholders or tailor insights for specific business questions.
Looker Studio Key Features
Some other features make Looker Studio a versatile choice for web analytics teams:
- Scheduled Report Delivery: Set up automated email delivery of dashboards and reports to keep stakeholders updated on a regular basis.
- Data Source Connectors: Access a large library of built-in and partner connectors to pull data from platforms like Google Analytics, BigQuery, and SQL databases.
- Collaboration Tools: Invite team members to view or edit dashboards in real time, supporting shared analysis and feedback.
- Custom Branding: Apply your organization’s logo, colors, and design elements to dashboards for a consistent, professional look.
Looker Studio Integrations
Integrations include Google Analytics, Google Ads, BigQuery, Google Sheets, Google Search Console, YouTube Analytics, Google Campaign Manager 360, and more.
Pros and Cons
Pros:
- Supports real-time data visualization updates
- Offers highly customizable dashboard layouts
- Connects to a wide range of Google products
Cons:
- Some connectors require third-party add-ons
- Lacks built-in predictive analytics features

Screaming Frog stands out for digital marketers and SEO specialists who need deep technical insights into their websites. The tool’s site crawling engine uncovers broken links, duplicate content, and crawl issues that can impact search performance. If you’re looking to audit large or complex sites for technical SEO problems, Screaming Frog offers a level of detail and flexibility that’s hard to match.
Why I Picked Screaming Frog
For technical site crawling, Screaming Frog offers a level of depth that’s hard to find in other web analytics tools. The crawler scans every page, image, and resource on your site, surfacing issues like broken links, missing metadata, and redirect chains. I picked Screaming Frog because it gives you granular control over crawl parameters, so you can tailor audits to your site’s unique structure. If you need to diagnose technical SEO problems and ensure your site is search engine-friendly, this tool delivers the detail and flexibility required.
Screaming Frog Key Features
Some other features make Screaming Frog especially useful for technical web audits:
- XML Sitemap Generation: Create XML sitemaps directly from your site crawl data.
- Custom Extraction: Pull specific data from web pages using CSS Path, XPath, or regex.
- JavaScript Rendering: Crawl and analyze content loaded dynamically with JavaScript.
- Google Analytics Integration: Overlay crawl data with Google Analytics metrics for deeper analysis.
Screaming Frog Integrations
Native integrations are not currently listed.
Pros and Cons
Pros:
- Supports custom extraction with XPath or regex
- Finds orphan pages missed by other tools
- Crawls large sites without cloud limits
Cons:
- Requires desktop installation, not browser-based
- No built-in dashboards for ongoing monitoring

If your team is focused on growing visibility in Bing search results, Bing Webmaster Tools offers analytics and optimization features tailored for that channel. The platform gives digital marketers and SEO professionals direct access to Bing’s search performance data, crawl diagnostics, and indexing controls. For anyone managing sites where Bing traffic matters, this tool helps you identify and address issues that specifically impact Bing rankings.
Why I Picked Bing Webmaster Tools
When optimizing for Bing search, presence is a priority. Bing Webmaster Tools gives you direct access to the data and controls that matter most for this channel. The platform provides detailed reports on how your site performs in Bing search, including impressions, clicks, and keyword rankings. I picked Bing Webmaster Tools because it also offers site scanning and indexing management features that help you address issues unique to Bing’s algorithm. For marketers who want to maximize their reach on Bing, these analytics and diagnostic tools are essential.
Bing Webmaster Tools Key Features
Some other features make Bing Webmaster Tools valuable for web analytics and site management:
- Backlink Analysis: View detailed reports on inbound links pointing to your site.
- SEO Reports: Access automated SEO recommendations and issue detection.
- URL Inspection Tool: Check the indexing status and crawl information for specific URLs.
- Disavow Links Tool: Submit a list of links you want Bing to ignore for ranking purposes.
Bing Webmaster Tools Integrations
Integrations include WordPress and Microsoft Advertising. Native API access is also available for custom integrations.
Pros and Cons
Pros:
- URL inspection tool for Bing crawling
- Backlink data unique to Bing’s index
- Built-in malware and spam detection alerts
Cons:
- No support for multi-user team management
- Data focuses only on Bing search traffic
Other Web Analytics Tools
Here are some additional web analytics tools options that didn’t make it onto my shortlist, but are still worth checking out:
- MonsterInsights
For WordPress integration
- Neil Patel
For actionable SEO recommendations
- Chartbeat
For real-time editorial insights
- Plausible
For privacy-focused tracking


Web Analytics Tools Selection Criteria
When selecting the best web analytics tools to include in this list, I considered common buyer needs and pain points like tracking user behavior across digital properties and identifying friction points in the user journey. I also used the following framework to keep my evaluation structured and fair:
Core Functionality (25% of total score)
To be considered for inclusion in this list, each solution had to fulfill these common use cases:
- Track website and app user activity
- Visualize traffic and engagement metrics
- Segment audiences by behavior or demographics
- Generate customizable reports and dashboards
- Monitor conversion events and funnels
Additional Standout Features (25% of total score)
To help further narrow down the competition, I also looked for unique features, such as:
- Real-time anomaly detection
- Session replay capabilities
- Tagless or code-free data capture
- Advanced journey mapping
- Predictive analytics and forecasting
Usability (10% of total score)
To get a sense of the usability of each system, I considered the following:
- Intuitive dashboard navigation
- Clear data visualizations
- Minimal setup requirements
- Responsive interface performance
- Logical menu and workflow structure
Onboarding (10% of total score)
To evaluate the onboarding experience for each platform, I considered the following:
- Step-by-step product tours
- Access to training videos and documentation
- Availability of onboarding webinars
- Pre-built templates for common reports
- In-app chat or guided setup support
Customer Support (10% of total score)
To assess each software provider’s customer support services, I considered the following:
- Live chat or phone support availability
- Response time to support requests
- Access to a searchable help center
- Community forums or user groups
- Proactive outreach from customer success teams
Value For Money (10% of total score)
To evaluate the value for money of each platform, I considered the following:
- Transparent and flexible pricing tiers
- Features included at each price point
- Free trial or demo availability
- No hidden fees or surprise charges
- Discounts for annual or volume commitments
Customer Reviews (10% of total score)
To get a sense of overall customer satisfaction, I considered the following when reading customer reviews:
- Positive feedback on data accuracy
- Reports of reliable platform uptime
- Satisfaction with customer support
- Ease of integration with other tools
- Perceived ROI and business impact
How to Choose Web Analytics Tools
It’s easy to get bogged down in long feature lists and complex pricing structures. To help you stay focused as you work through your unique software selection process, here’s a checklist of factors to keep in mind:
| Factor | What to Consider |
| Scalability | Will the tool handle your current and projected traffic volumes without extra costs or slowdowns? |
| Integrations | Does the tool connect natively to your CRM, marketing automation, A/B testing, and data warehouse tools? |
| Customizability | Can you tailor dashboards, reports, and data collection to your team’s specific KPIs and workflows? |
| Ease of use | Will your team need extensive training, or can most users get value with minimal onboarding? |
| Implementation and onboarding | How long will it take to deploy, and what internal resources or technical skills are required to get started? |
| Cost | Are there hidden fees for data storage, user seats, or premium support? Does pricing scale with usage? |
| Security safeguards | Does the tool offer data encryption, user access controls, and compliance with privacy regulations like GDPR? |
| Support availability | What support channels are offered, and are they available during your business hours or only in certain regions? |
What Are Web Analytics Tools?
Web analytics tools are software platforms that track, measure, and report on user interactions across websites and digital properties. These website analytics tools help marketing teams understand visitor behavior, monitor traffic sources, and analyze conversion paths. By providing actionable data on user journeys, bounce rate, and engagement, they support data-driven decisions that improve marketing strategies, optimize a site’s performance, and enhance overall user experience.
Many platforms function as an all-in-one analytics solution, combining product analytics with traditional tracking, and offering options like open-source or self-hosted deployments for greater control. These tools are widely used by startups and growing teams looking to scale insights, including solutions like open web analytics for flexible, customizable tracking.
Features of Web Analytics Tools
When selecting web analytics tools, keep an eye out for the following key features:
- Traffic source tracking: Identifies where your website visitors are coming from, such as search engines, social media, or referral sites, so you can measure the effectiveness of different marketing channels.
- User segmentation: Groups visitors based on attributes like location, device, or behavior, allowing you to analyze specific audience segments and tailor your strategies accordingly.
- Conversion funnel analysis: Maps the steps users take toward completing a goal, such as a purchase or signup, helping you pinpoint where drop-offs occur and optimize the user journey.
- Event tracking: Monitors specific actions on your site, like button clicks, downloads, or video plays, so you can measure engagement with key elements.
- Session replay: Records and plays back individual user sessions, giving you a visual understanding of how visitors interact with your site and where they encounter issues.
- Customizable dashboards: Lets you build and modify dashboards to display the metrics and reports most relevant to your team, supporting focused analysis and reporting.
- Real-time reporting: Provides up-to-the-minute data on user activity, enabling you to respond quickly to traffic spikes, campaign launches, or technical issues.
- Goal and conversion tracking: Allows you to set up and monitor specific business objectives, such as form submissions or sales, to measure the success of your digital initiatives.
- Multi-device tracking: Follows users across different devices and sessions, giving you a complete view of the customer journey from mobile to desktop.
- Data export and integration: Enables you to export analytics data or connect with other tools, such as CRM or business intelligence platforms, for deeper analysis and reporting.
Common Web Analytics Tools AI Features
Beyond the standard web analytics tools features listed above, many of these solutions are incorporating AI with features like:
- Anomaly detection: Uses AI algorithms to automatically identify unusual patterns or sudden changes in user behavior, alerting teams to potential issues or opportunities without manual monitoring.
- Predictive analytics: Leverages machine learning to forecast future trends, such as traffic spikes or conversion rates, helping teams plan campaigns and allocate resources more effectively.
- Automated insights: Analyzes large volumes of data to surface key findings, trends, or outliers, reducing the time spent on manual analysis and highlighting what matters most for decision-making.
- User intent analysis: Applies natural language processing and behavioral modeling to infer the goals and motivations behind user actions, enabling more targeted content and experience optimization.
- Churn prediction: Identifies users who are likely to disengage or abandon a process, allowing teams to intervene with personalized messaging or offers to retain valuable visitors.
Benefits of Web Analytics Tools
Implementing web analytics tools provides several benefits for your team and your business. Here are a few you can look forward to:
- Deeper customer understanding: Access detailed data on user behavior, journeys, and engagement to inform audience targeting and content strategy.
- Improved conversion rates: Identify and address friction points in your funnels using features like session replay and conversion analysis.
- Faster decision-making: Leverage real-time dashboards and automated insights to respond quickly to campaign performance and site issues.
- Optimized marketing spend: Track traffic sources and campaign attribution to allocate budget to the most effective channels.
- Enhanced collaboration: Share customizable dashboards and reports across teams to align on goals and performance metrics.
- Proactive issue detection: Use AI-powered anomaly detection to catch and resolve problems before they impact user experience.
- Data-driven strategy: Integrate analytics with other business tools to support holistic, evidence-based planning and reporting.
Costs and Pricing of Web Analytics Tools
Selecting web analytics tools requires an understanding of the various pricing models and plans available. Costs vary based on features, team size, add-ons, and more. The table below summarizes common plans, their average prices, and typical features included in web analytics tools solutions:
Plan Comparison Table for Web Analytics Tools
| Plan Type | Average Price | Common Features |
| Free Plan | $0 | Basic traffic tracking, limited dashboards, restricted data retention, and community support. |
| Personal Plan | $20-$125/month | Standard reporting, user segmentation, event tracking, email support, and limited integrations. |
| Business Plan | $200-$500/month | Advanced analytics, customizable dashboards, conversion funnels, multi-user access, and priority support. |
| Enterprise Plan | $500-$2000/month | Unlimited data retention, dedicated account management, advanced security, custom integrations, and SLA-backed support. |
Web Analytics Tools FAQs
Here are some answers to common questions about web analytics tools:
How do web analytics tools handle user privacy and data compliance?
Most web analytics tools offer features like IP anonymization, cookie consent management, and data retention controls to help you comply with privacy regulations such as GDPR and CCPA. Always review each tool’s privacy settings and ensure they align with your organization’s compliance requirements.
Can web analytics tools track users across multiple devices and sessions?
Yes, many web analytics tools use unique identifiers or cross-device tracking methods to follow users as they move between devices and sessions. This helps you build a more complete picture of the customer journey and understand how users interact with your brand over time.
What’s the difference between real-time and historical analytics in these tools?
Real-time analytics show you what’s happening on your site right now, such as active users or live events, while historical analytics let you analyze trends and patterns over days, weeks, or months. Both are important for monitoring campaigns and making data-driven decisions.
How difficult is it to integrate web analytics tools with other marketing platforms?
Most web analytics tools offer pre-built integrations or APIs for connecting with CRM, email, ad platforms, and data warehouses. The complexity depends on your tech stack and data needs, but many tools provide step-by-step guides or support to help with setup.
What should I do if my web analytics data seems inaccurate or incomplete?
Start by checking your tracking code implementation, tag manager settings, and any filters or exclusions in your analytics tool. Inaccurate data often results from missing tags, duplicate tracking, or misconfigured goals. Most vendors offer troubleshooting resources or support to help resolve these issues.
What’s Next:
If you're in the process of researching web analytics tools, connect with a SoftwareSelect advisor for free recommendations.
You fill out a form and have a quick chat where they get into the specifics of your needs. Then you'll get a shortlist of software to review. They'll even support you through the entire buying process, including price negotiations.