10 Best Marketing Dashboard Software In 2026

10 Best Marketing Dashboards Shortlist


Finding the right marketing dashboard software can be a real challenge. With so many tools claiming to simplify analytics, it’s hard to know which ones actually deliver. The right platform can make all the difference by turning complex data into clear insights and helping your team make smarter decisions.
I’ve tested and reviewed several leading options to help you choose the best fit. My goal is to provide honest, research-based recommendations focused on what truly matters.
In this article, you’ll find a breakdown of key features, pros and cons, and pricing, so you can confidently pick the marketing dashboard software that works best for your team.
Why Trust Our Software Reviews
We’ve been testing and reviewing marketing software since 2022. As marketing experts ourselves, we know how critical and difficult it is to make the right decision when selecting software.
We invest in deep research to help our audience make better software purchasing decisions. We’ve tested more than 2,000 tools for different marketing use cases and written over 1,000 comprehensive software reviews. Learn how we stay transparent & our software review methodology.
Best Marketing Dashboards Software Summary
| Tool | Best For | Trial Info | Price | ||
|---|---|---|---|---|---|
| 1 | Best multi-integration dashboards | 14-day free trial + free demo available | From $44/month (billed annually) | Website | |
| 2 | Best for sentiment analysis | 14-day free trial available | From $199/month (billed annually) | Website | |
| 3 | Best for tracking trends to act on | Free demo available | Available upon request | Website | |
| 4 | Best for spreadsheet-based marketing dashboards | Free plan available | From $49/month (billed annually) | Website | |
| 5 | Best for automated report delivery by email | Free plan available | From $29/month | Website | |
| 6 | Best for visualizing PPC campaign results | 7-day free trial | From $49/month/brand | Website | |
| 7 | Best for multi-source marketing intelligence | Free demo available | Pricing upon request | Website | |
| 8 | Best for email marketing analytics | Free plan + free demo available | From $229/month (billed annually) | Website | |
| 9 | Best for building custom dashboards from scratch | Free plan available | From $9/user/project/month | Website | |
| 10 | Best for interactive charts and graphs | 30-day free trial + free demo available | From $199/seat/month | Website |


Best Marketing Dashboard Software Reviews
Here’s a brief description of each of the tools featured on this list.

DashThis is an easy-to-use software that will save you time in generating your automated reports and creating dashboards. Access to your data sources is unlimited and the platform connects to over 34 of the most commonly used digital marketing tools. The number of users is also not limited like with other tools on the market.
Why I Picked DashThis: DashThis excels in handling multi-integration dashboards by seamlessly integrating with various data sources, such as Google Analytics, Facebook Ads, Instagram, and LinkedIn. With its user-friendly interface, users can easily connect multiple platforms, import data, and customize their dashboards to display key performance indicators (KPIs) from different sources in a cohesive and visually appealing manner. DashThis provides a centralized hub for marketers to track and analyze data from multiple channels, empowering them to gain comprehensive insights, make informed decisions, and optimize their marketing strategies efficiently.
DashThis Standout Features & Integrations
Features include marketing dashboards that display KPIs from multiple external sources, a CSV file import system, unlimited client accounts, templates and cloning options, report sharing (email, PDF, URL), white labeling services, and a custom widget editor.
Integrations include Tiktok Ads, Google Ads, GA4, and Facebook Ads among others.
Pros and Cons
Pros:
- Easy to use
- Integration capabilities
- Responsive customer support
Cons:
- Limited advanced features
- Costly for smaller teams

Brand24 is a marketing dashboard tool that tracks brand mentions across 25 million+ sources, including social, news, forums, and podcasts. It gives you a visual, real-time view of how people are talking about your brand—segmenting sentiment, reach, and intent—so you can monitor campaigns and make data-informed decisions.
Why I Picked Brand24: I picked Brand24 for its ability to help you understand how people feel about your brand at scale. Its dashboards go beyond vanity metrics, letting you dig into the emotional tone of mentions across platforms in real time. I also appreciated how it surfaces actionable insights—automated alerts flag unusual spikes, and real-time data is pushed to Slack so your team can quickly decide how to respond. If you need brand performance stats without the guesswork, this one’s worth exploring.
Brand24 Standout Features & Integrations
Features include topic analysis, intent detection, influence scoring, reputation and presence metrics, customizable reports, emoji-based emotion tracking, and project-level comparison dashboards.
Integrations include Slack, HubSpot, Trello, Asana, Buffer, Google Analytics, Hootsuite, Facebook, Instagram, LinkedIn, Telegram, TikTok, and Spotify.
Pros and Cons
Pros:
- Tracks campaign hashtags with reach and volume metrics
- Alerting system for mention spikes and anomalies
- Sentiment, reach, and intent metrics in one view
Cons:
- Some integrations (like CRM) require manual setup
- Dashboards can feel cluttered with high volume data
New Product Updates from Brand24

Brand24 Adds Spoken Mention Detection for YouTube Videos
Brand24 now detects spoken brand mentions in YouTube videos by analyzing auto-generated captions, surfacing results with timestamps, filters, and alerts. The feature helps teams find brand mentions in video audio even when they are not included in titles, descriptions, or comments. For more information, visit Brand24’s official site.
 .
.
TikTok is a popular social media platform that focuses on short-form video sharing. Marketers can monitor the performance of their content and track trends in the platform, helping them create more engaging content and tap into trending challenges, formats, audio, and more.
Why I picked TikTok: I chose to include TikTok because its analytics dashboard offers insights into video performance that help you act on trends quickly to increase visibility. You can track audience engagement and discover which trends are resonating most with your audience. By using TikTok’s trend data, your team can adjust campaigns in real-time and stay connected with what’s working. This makes it a strong choice for those looking to base marketing decisions on real-time trends and data.
TikTok Standout Features & Integrations
Features include trend analysis, video performance insights, and audience engagement metrics. You can track which trends are gaining momentum and act quickly to align your content. TikTok’s analytics give your team a real-time view of how your content is performing.
Integrations include Shopify, WooCommerce, BigCommerce, Magento, and Square.
Pros and Cons
Pros:
- Built-in tools for collaborations
- Quick access to audience engagement
- Offers detailed video insights
Cons:
- Hard to predict viral success
- Not suitable for multi-platform analytics

Coefficient is a data integration and reporting tool that connects marketing platforms, CRMs, and databases directly to Google Sheets or Excel. Marketing teams can sync live data into spreadsheets to build dashboards, track campaign performance, and automate reporting without manual exports. By keeping data updated automatically, Coefficient helps marketing operations teams spend less time preparing reports and more time analyzing results.
Why I Picked Coefficient
I picked Coefficient for its ability to turn spreadsheets into a live reporting environment for marketing data. Teams can connect tools like CRMs and analytics platforms, pull data into spreadsheets automatically, and build dashboards using familiar spreadsheet formulas and visualizations. Automated refreshes keep dashboards current, while AI-assisted features help you generate formulas and analyze data more efficiently.
Coefficient Key Features
In addition to its data modeling capabilities, Coefficient includes several features that support effective marketing dashboard reporting:
- Cross-channel data connections: Pull live data from Google Analytics, Meta Ads, Google Ads, HubSpot, Salesforce, LinkedIn, and other marketing platforms into a single reporting workflow.
- Scheduled refreshes: Automatically update dashboards and reports to keep campaign and performance data current without manual exports.
- AI-assisted dashboard building: Use natural language prompts to create dashboards, reports, formulas, and data transformations more efficiently.
- Automated alerts: Trigger Slack or email notifications when key metrics reach defined thresholds, enabling faster responses to performance changes.
Coefficient Integrations
Integrations include Salesforce, Google Search Console, Google Sheets, Microsoft Excel, Snowflake, HubSpot, Google Analytics, Google Ads, Facebook Ads, and Slack. Coefficient also provides an API for custom integrations.
Pros and Cons
Pros:
- Ability to create automated workflows
- Automated data enrichment
- Allows real-time data syncing from diverse sources
Cons:
- Lacks advanced visualization options compared to dedicated BI tools
- Dependence on external data sources for full functionality
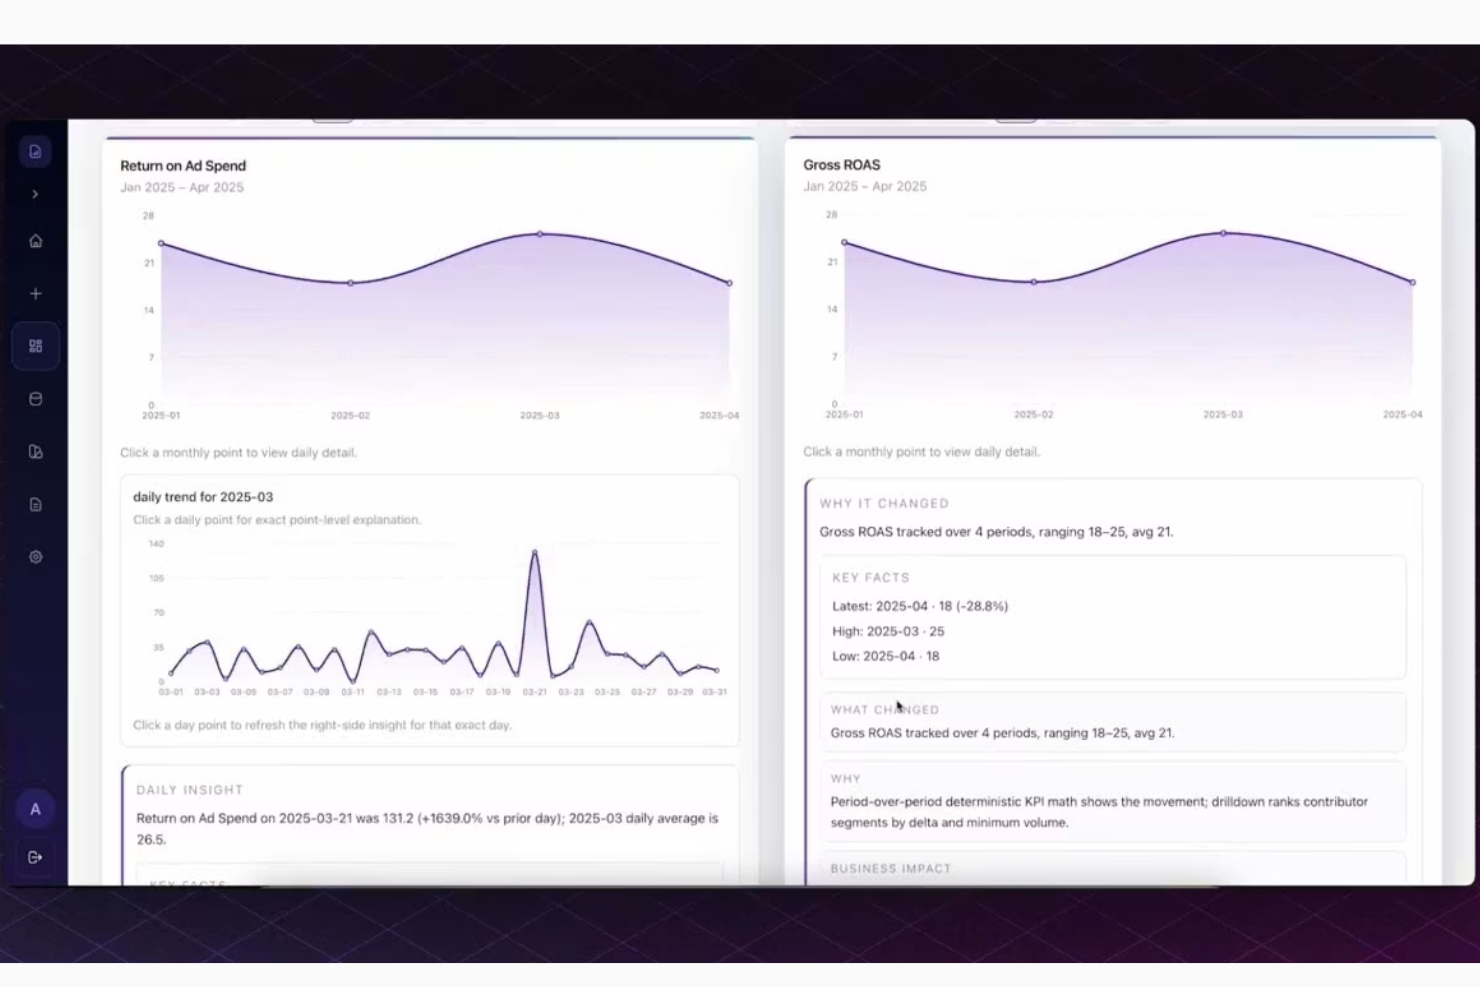
An agentic analytics platform built for marketing teams, Signara takes data from connected sources and automatically produces interactive dashboards and AI-generated narrative reports with recommendations and next steps.
Who Is Signara Best For?
Signara is a strong fit for marketing teams and revenue operations professionals who need to report on HubSpot pipeline and campaign performance without relying on a data analyst.
Why I Picked Signara
I've included Signara in my top picks because the automated email delivery feature genuinely removes a reporting bottleneck I see in almost every marketing team. You set a schedule, and Signara sends stakeholders a fully rendered report, including AI narratives and KPI commentary, without anyone logging in or manually exporting anything. What I find compelling is that these aren't just chart screenshots. Each emailed report includes driver analysis and recommendations pulled directly from your connected data.
Signara Key Features
- Drag-and-drop dashboard builder: Build and customize marketing dashboards visually without writing any SQL or code.
- PPTX deck export: Export your full dashboard and narrative report as a ready-to-present PowerPoint file in one click.
- Auditable KPI formulas: Signara computes every metric using deterministic math, so you can verify exactly how each KPI is calculated.
- Schema mapping agent: Signara's AI agent auto-detects your data fields on connection and maps them to standard marketing KPIs automatically.
Signara Integrations
Integrations include HubSpot, Excel, Google Sheets, Snowflake, BigQuery, PostgreSQL, Databricks, and MySQL.
Pros and Cons
Pros:
- Flags data quality issues before reporting
- PPTX decks generated from raw data
- AI narratives explain what changed automatically
Cons:
- No mobile app for on-the-go access
- Limited native data source connectors
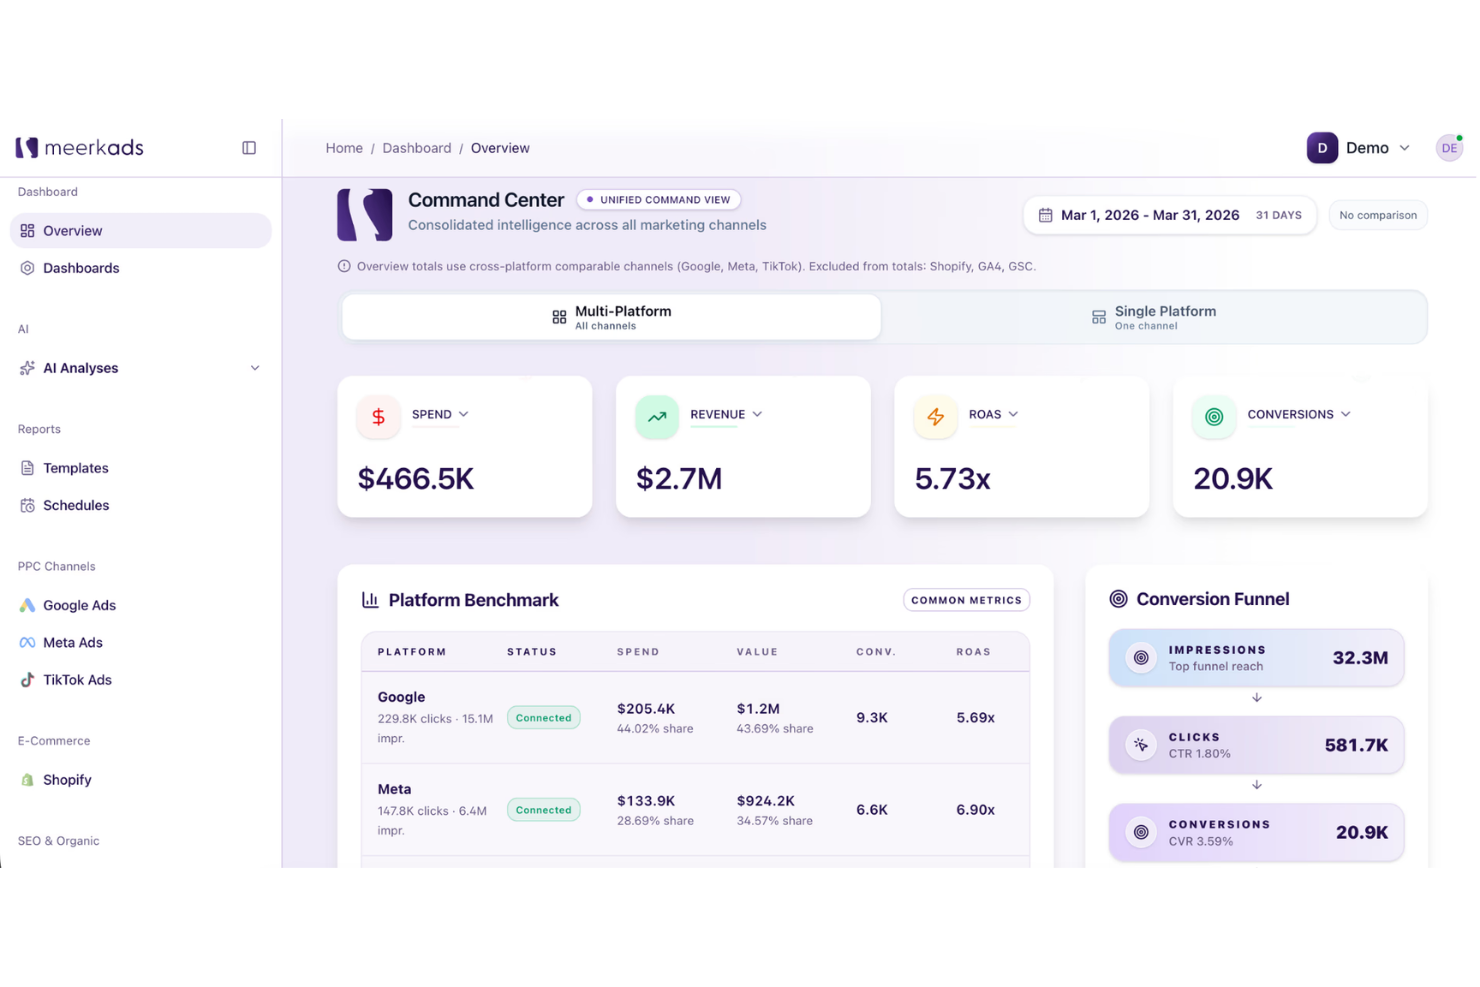
Meerkads helps ecommerce brands, agencies, and paid media teams replace scattered ad platform reports with real-time marketing dashboards. It pulls data from Google Ads, Meta Ads, TikTok Ads, and Shopify, then uses AI-powered analysis to surface campaign issues, creative performance trends, and product-level revenue insights.
Who Is Meerkads Best For?
Meerkads is a strong fit for paid media managers and performance marketing agencies that need a centralized view of ad spend and results across multiple platforms.
Why I Picked Meerkads
I picked Meerkads because it makes PPC campaign results easier to compare across Google Ads, Meta Ads, and TikTok Ads from one dashboard. You can track ROAS, CPA, CTR, spend, and conversions side by side, which helps your team spot which channels and campaigns are driving the strongest results. I also like its campaign and ad-level breakdowns because they make it easier to review performance without jumping between separate ad platforms. Its AI performance scoring adds another useful layer by grading campaigns, so you can quickly identify underperforming ads and prioritize what needs attention first.
Meerkads Key Features
Some other features in Meerkads help teams monitor ad performance, report results, and connect campaign data to ecommerce revenue:
- Creative fatigue detection: Flags ads that are losing performance over time so your team knows when to refresh creative.
- White-labeled shareable dashboards: Creates dashboard links that clients or stakeholders can view without needing a Meerkads login.
- Automated performance alerts: Notifies your team when metrics like ROAS or CPA move outside your set thresholds.
- Shopify sales data overlay: Connects Shopify revenue data with ad spend to show ROAS based on actual order values.
Meerkads Integrations
Integrations include Google Search Console, TikTok Ads, Meta Ads, Google Ads, GA4, and Shopify.
Pros and Cons
Pros:
- Combines Google, Meta, TikTok, and Shopify performance data
- Shows real ROAS using ecommerce revenue and ad spend
- Supports white-labeled dashboards and reports for agency clients
Cons:
- No SEO or organic marketing dashboards
- Limited to paid ad channel data sources
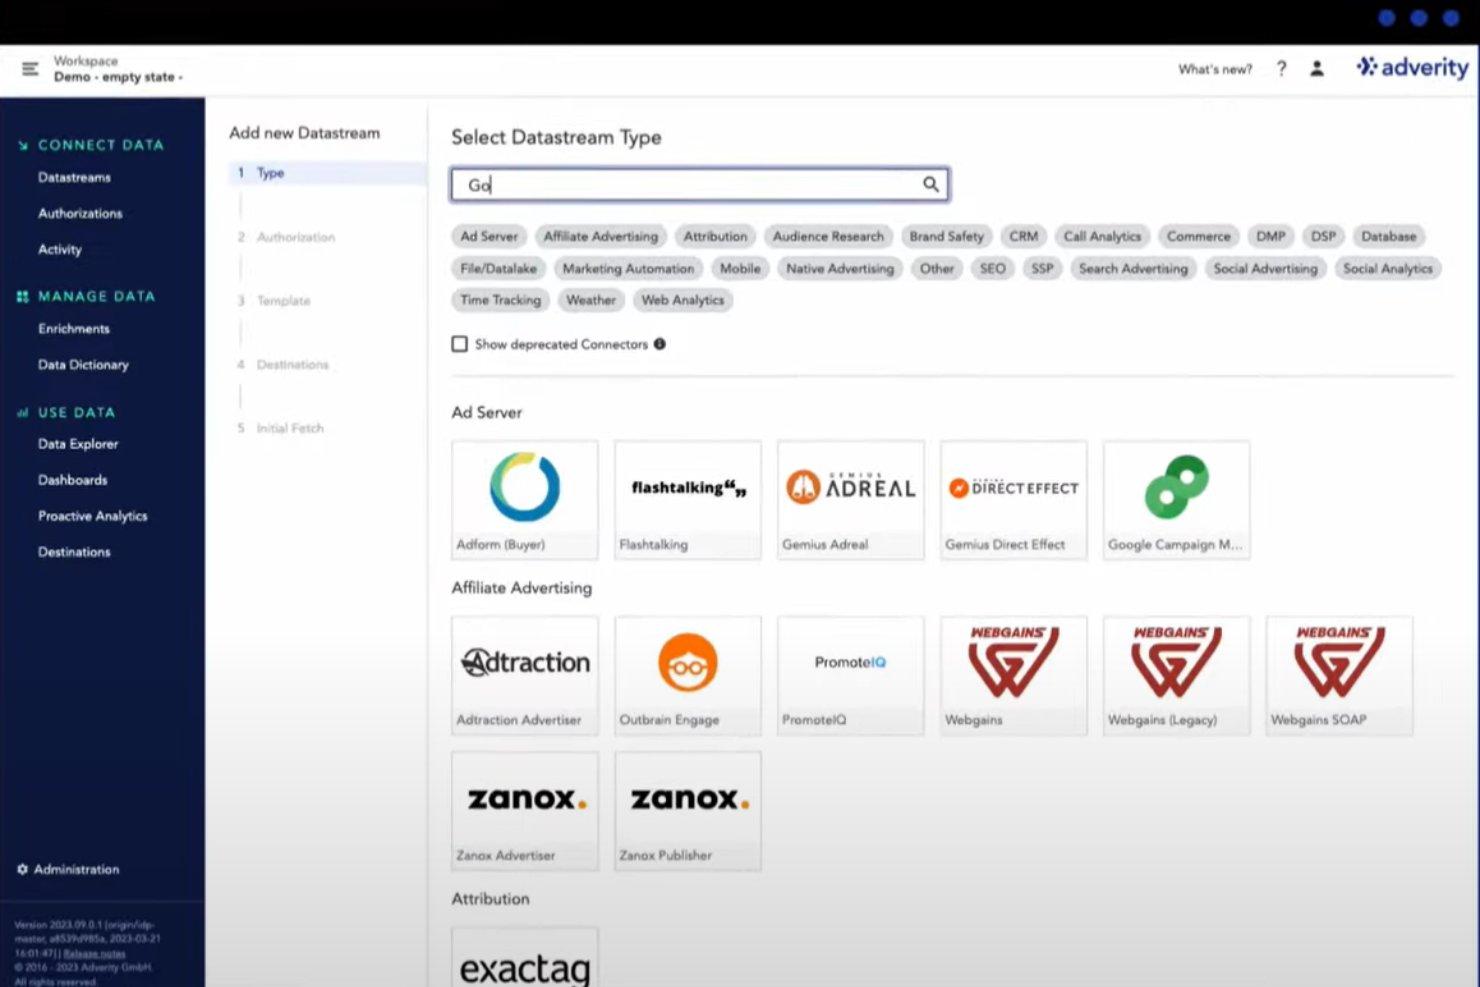
Adverity is a data intelligence platform designed to help marketing teams collect, prepare, and analyze data from various sources. It lets you build dashboards that provide insights into campaign performance and marketing spend.
Why I Picked Adverity: Adverity offers AI-driven features that enhance your dashboards with proactive insights. Its AI capabilities automatically identify critical patterns and anomalies in your data, presenting them in a straightforward manner. This allows you to quickly spot issues or opportunities, such as reallocating budgets or adjusting campaigns, without the need for manual analysis or data science expertise. I also like Adverity's transformation copilot, which simplifies the process of cleaning and enriching data. By using natural language prompts, you can transform complex datasets into ready-to-use insights without writing code.
Adverity Standout Features & Integrations
Features include data quality monitoring, dashboard sharing options, widget-based dashboard construction, real-time data updates, customizable dashboard themes, data export capabilities, public dashboard links, dashboard collaboration tools, and version control.
Integrations include Google Ads, Facebook Ads, TikTok Ads, Amazon Ads, Google BigQuery, Looker Studio, Google Drive, Hubspot, Salesforce, Zendesk, App Annie, and Google Analytics.
Pros and Cons
Pros:
- Provides the ability to create personalized dashboards
- Can harmonize data from various sources
- Scalable for businesses of various sizes
Cons:
- The initial setup can be complex and time-consuming
- Certain features may require technical knowledge
New Product Updates from Adverity
Adverity Enhances Connectors and Adds TikTok GMV Max
Adverity updates connectors for Amazon Ads, SmartNews Ads, Indeed, and monday.com, and introduces the TikTok GMV Max connector. These updates improve data accuracy, control, and performance across integrations. For more information, visit Adverity’s official site.
 .
.
Whatagraph is a marketing analytics and social media reporting platform that provides multi-channel reports, custom data widgets, team management, filtering options, pre-made templates, branded white label, image uploads, and commenting.
Why I Picked Whatagraph: Whatagraph is a powerful tool for email marketing analytics, offering several features that make it stand out in this area. With Whatagraph, users can gather data from email marketing platforms, such as open rates, click-through rates, conversions, and subscriber engagement metrics, and visualize this data in easy-to-understand and visually appealing reports. The platform allows for customization, enabling users to tailor their reports to specific metrics, timeframes, or target audiences. Whatagraph also offers automated reporting capabilities, allowing users to schedule regular email performance reports and receive them directly in their inbox.
Whatagraph Standout Features & Integrations
Features analytics, calendar management, dashboard, data import/export, data visualization, external integrations, keyword tracking, link tracking, marketing automation, multi-user, notifications, referral tracking, scheduling, seo, and social-media integration.
Integrations include Adroll, Authority Ads, Bing Ads, CallRail, Campaign Monitor, Celtra, Cvent, Emma, Facebook, Google Analytics and Ads, Instagram, YouTube, Oath (Yahoo), LinkedIn, Mailchimp, SEMrush, Twitter, Snapchat, Tubemogul, Hubspot, CSV, Excel, and more.
Pros and Cons
Pros:
- Multi-channel integration
- User-friendly interface
- Strong automated reporting
Cons:
- Limited data manipulation capabilities
- Learning curve for setup

Looker Studio (was: Google Data Studio) is a dashboard reporting solution for users who want to go above and beyond what Google Analytics has to offer. Data Studios, like many Google services, is free to use. Additionally, Looker Studio is feature-rich and constantly updating, so you won’t feel anything lacking.
Why I Picked Looker Studio: Looker Studio is highly regarded for its capabilities in building marketing dashboards from scratch. The platform offers a range of tools and features that empower users to create customized and visually appealing dashboards tailored to their specific marketing needs. With Looker Studio, users can leverage its drag-and-drop interface and intuitive design elements to easily design and arrange widgets, charts, and visualizations. The platform's robust data modeling capabilities enable users to connect to multiple data sources, perform complex calculations, and create calculated fields, providing flexibility and control over the data displayed in the dashboard. Looker Studio also offers collaborative features, allowing teams to work together on dashboard creation and share insights seamlessly.
Looker Studio Standout Features & Integrations
Features include data visualizations, custom dashboards, interactive reports, marketing templates, external integrations, data import/export, report sharing, and automated email reports.
Integrations include other Google software, like AdWords, Sheets, Analytics, as well as third-party solutions like Adobe Analytics, Asana, Bing Ads, Facebook Ads, BigQuery, MySQL, PostgreSQL, and Hubspot.
Pros and Cons
Pros:
- Customizable and interactive dashboards
- Powerful data modeling and querying
- Collaboration and sharing
Cons:
- Complex implementation and setup
- Learning curve
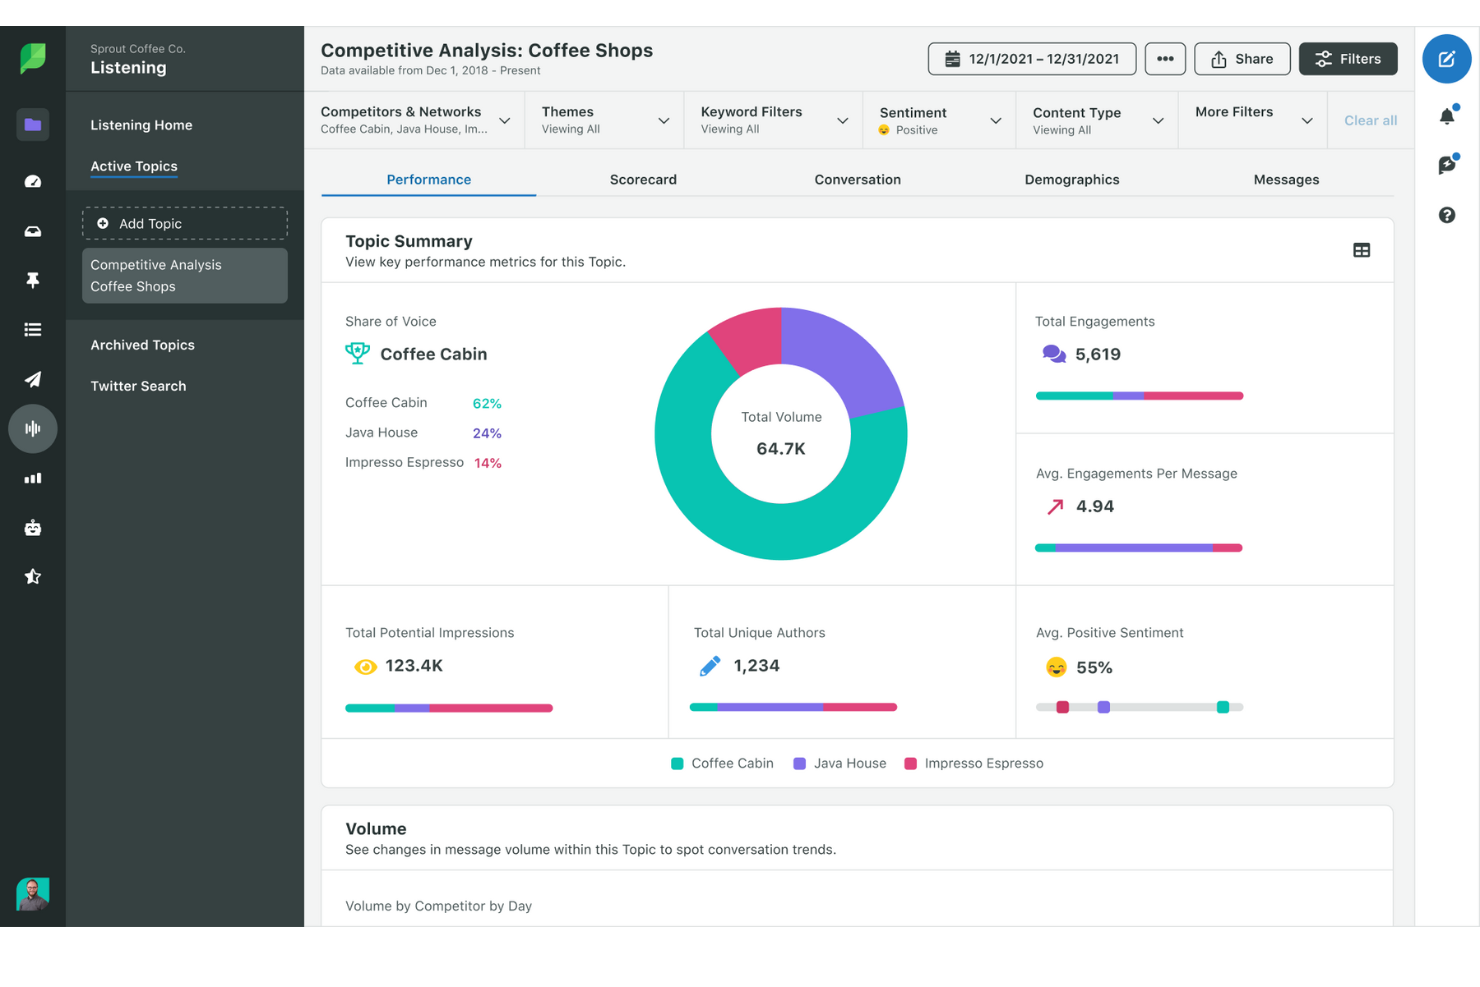
Sprout Social is a social media management platform designed to give businesses the tools they need to succeed in their social media efforts. Offering a wide range of features, it helps organizations manage their social media presence, engage with audiences, analyze performance, and optimize their strategies.
Why I Picked Sprout Social: As a marketing dashboard software, Sprout Social excels with its robust features tailored for detailed analytics and reporting. Its marketing dashboards are equipped with interactive charts and graphs, allowing users to visualize data more effectively and derive actionable insights. The platform offers customizable dashboards that can be tailored to track the metrics most important to your business. With real-time data and comprehensive reporting tools, Sprout Social enables marketers to make informed decisions and optimize their strategies for better performance.
Sprout Social Standout Features & Integrations
Features include social media listening, competitive analysis, sentiment analysis, trend tracking, custom reporting, campaign performance tracking, engagement metrics, audience demographics, content performance analysis, and cross-platform publishing.
Integrations include Facebook, X (Twitter), Instagram, LinkedIn, Pinterest, YouTube, Google Analytics, HubSpot, Salesforce, Zendesk, and Slack.
Pros and Cons
Pros:
- Content scheduling and planning features
- Wide range of customizable reports
- Social media listening features
Cons:
- Standard plan limited to 5 social profiles
- Price may be high for smaller businesses
Other Marketing Dashboard Software
Here’s a few more that didn’t make the top list. If you need additional suggestions for handy marketing dashboards, check these out.
- TapClicks
For competitor intelligence
- Athenic
For customizable AI dashboards
- Mixpanel
For customizable marketing KPIs
- HighLevel
For consolidating marketing tools
- Power BI
Marketing funnel data
- ClicData
For data collaboration
- Octoboard
For product & ecommerce marketing
- Tracknow
For affiliate marketing
- Impact
For partnership management
- Social Status
For automated social media reports
- Zoho Analytics
Marketing data visualizations
- Supermetrics
For integrating 150+ data sources
- Sisense
Interactive dashboards
- Google Analytics
Free reporting tools by Google
- Klipfolio
Dashboards for startups
- Domo
Marketing executive dashboard
- Tableau
For marketing agencies
- Supermetrics
Marketing dashboards for e-commerce
- Board
Dashboards for finance and insurance companies
- Cyfe
Facebook marketing dashboard software


Selection Criteria for Marketing Dashboard Software
When selecting the best marketing dashboard software to include in this list, I considered common buyer needs and pain points like ease of integration and data visualization capabilities. I also used the following framework to keep my evaluation structured and fair:
Core Functionality (25% of total score)
To be considered for inclusion in this list, each solution had to fulfill these common use cases:
- Track key performance indicators
- Integrate with marketing tools
- Provide real-time data updates
- Offer customizable dashboards
- Visualize data trends
Additional Standout Features (25% of total score)
To help further narrow down the competition, I also looked for unique features, such as:
- Predictive analytics capabilities
- AI-driven insights
- Cross-platform accessibility
- Custom alert notifications
- Advanced data filtering options
Usability (10% of total score)
To get a sense of the usability of each system, I considered the following:
- Intuitive interface design
- Easy navigation and layout
- Minimal learning curve
- Customizable user settings
- Responsive design for mobile use
Onboarding (10% of total score)
To evaluate the onboarding experience for each platform, I considered the following:
- Availability of training videos
- Access to templates and guides
- Interactive product tours
- Supportive chatbots and help centers
- Webinars for user training
Customer Support (10% of total score)
To assess each software provider’s customer support services, I considered the following:
- 24/7 support availability
- Multiple contact channels
- Fast response times
- Access to a knowledge base
- Personalized support options
Value For Money (10% of total score)
To evaluate the value for money of each platform, I considered the following:
- Competitive pricing models
- Free trial availability
- Tiered pricing options
- Cost versus feature set
- Discounts for annual subscriptions
Customer Reviews (10% of total score)
To get a sense of overall customer satisfaction, I considered the following when reading customer reviews:
- User satisfaction ratings
- Feedback on ease of use
- Comments on feature effectiveness
- Support experience feedback
- Overall tool reliability
How to Choose Marketing Dashboard Software
It’s easy to get bogged down in long feature lists and complex pricing structures. To help you stay focused as you work through your unique software selection process, here’s a checklist of factors to keep in mind:
| Factor | What to Consider |
|---|---|
| Scalability | Can the software grow with your business? Consider future data volume and user count. Make sure it can handle increasing needs without extra costs or performance issues. |
| Integrations | Does it work with your existing tools? Check compatibility with CRM, social media, and email platforms. Seamless integration reduces manual work and data silos. |
| Customizability | Can you tailor dashboards to fit your needs? Look for flexible layouts and widget options. Custom views should align with your team’s goals and metrics. |
| Ease of use | Is the interface intuitive? A user-friendly design minimizes training time. Test it with team members to see if they can navigate without frustration. |
| Implementation and onboarding | How quickly can you get started? Check for available resources like tutorials and support. Smooth onboarding helps your team adopt the tool faster and start seeing value sooner. |
| Cost | Does it fit your budget? Compare pricing plans, including hidden fees. Consider the cost-benefit ratio and whether it aligns with your financial constraints. |
| Security safeguards | Is your data protected? Look for encryption, user access controls, and compliance with data protection regulations. Security should be a priority to safeguard sensitive information. |
What Is Marketing Dashboard Software?
Marketing dashboard software is a tool that visualizes key marketing metrics and data in one place. Marketing professionals, analysts, and managers generally use these tools to track performance and make informed decisions.
Real-time data updates, customizable dashboards, and integration capabilities help with data analysis and reporting. Overall, these tools simplify data management and enhance decision-making.
Features
When selecting marketing dashboard software, keep an eye out for the following key features:
- Real-time data updates: Provides up-to-the-minute information, enabling timely decision-making and strategy adjustments.
- Customizable dashboards: Allows users to tailor the display of metrics and data to align with specific business goals and needs.
- Integration capabilities: Connects seamlessly with existing marketing tools and platforms to consolidate data and reduce manual input.
- Data visualization tools: Transforms complex data into easy-to-understand charts and graphs, aiding in quick analysis.
- User access controls: Ensures data security by allowing administrators to set permissions and control who can view or edit information.
- Predictive analytics: Offers insights into future trends based on historical data, helping teams anticipate and plan for upcoming challenges.
- Cross-platform accessibility: Enables access to dashboards from various devices, ensuring teams can stay informed on the go.
- Alert notifications: Sends automatic alerts for important changes or trends, keeping teams proactive rather than reactive.
- Training resources: Provides tutorials, guides, and support to help users quickly get up to speed and maximize tool usage.
Benefits
Implementing marketing dashboard software provides several benefits for your team and your business. Here are a few you can look forward to:
- Improved decision-making: Real-time data updates and predictive analytics give you the insights needed for informed choices.
- Increased efficiency: Integration capabilities reduce manual data entry, allowing your team to focus on strategic tasks.
- Enhanced data clarity: Customizable dashboards and visualization tools make complex data easier to understand and act on.
- Better collaboration: Cross-platform accessibility ensures everyone on your team has access to the same information, no matter where they are.
- Proactive management: Alert notifications help anticipate issues and opportunities, keeping your team ahead of the curve.
- Security assurance: User access controls protect sensitive data, ensuring only authorized personnel can access specific information.
Costs & Pricing
Selecting marketing dashboard software requires an understanding of the various pricing models and plans available. Costs vary based on features, team size, add-ons, and more. The table below summarizes common plans, their average prices, and typical features included in marketing dashboard software solutions:
Plan Comparison Table for Marketing Dashboard Software
| Plan Type | Average Price | Common Features |
|---|---|---|
| Free Plan | $0 | Basic data visualization, limited integrations, and standard dashboards. |
| Personal Plan | $10-$30/user/month | Customizable dashboards, more integration options, and data export capabilities. |
| Business Plan | $50-$150/user/month | Advanced analytics, team collaboration tools, and enhanced security features. |
| Enterprise Plan | $200+/user/month | Unlimited integrations, dedicated account support, and comprehensive data governance features. |
Marketing Dashboard Software FAQs
Here are some answers to common questions about marketing dashboard software:
How do these platforms handle data from multiple marketing channels?
Most platforms connect directly to various data sources like social media, ad platforms, and email tools. The quality and speed of these connections vary depending on the tool’s API integrations. Some update data in near real-time, while others may sync only a few times a day.
Are custom metrics and KPIs supported across different tools?
Many platforms allow you to define custom metrics, but the flexibility depends on how the tool processes and visualizes data. Some require SQL knowledge or formulas, while others offer point-and-click interfaces. Support for calculated fields and blended metrics varies widely.
How is user access and permissions managed?
Most tools offer role-based access to control who can view, edit, or share dashboards. Admin settings vary, with some offering detailed permission layers by metric or report. Others may only provide basic viewer/editor roles.
Can the tool connect directly to ad platforms like Google Ads or Meta Ads?
Many dashboard platforms offer direct connections, but the stability and depth of data pulled differ. Some support campaign-level data only, while others dig into ad sets, keywords, and creatives. The frequency of updates and available metrics are also tool-specific.
Do these tools support historical data tracking?
Yes, though how far back the data goes often depends on the integration and sync setup. Some tools store historical data internally, while others rely on pulling it fresh from the source. Data retention policies and export options vary by platform.
What’s Next:
If you're in the process of researching marketing dashboard software, connect with a SoftwareSelect advisor for free recommendations.
You fill out a form and have a quick chat where they get into the specifics of your needs. Then you'll get a shortlist of software to review. They'll even support you through the entire buying process, including price negotiations.