10 migliori software per dashboard marketing nel 2026

10 Migliori Dashboard di Marketing: Shortlist


Trovare il giusto software per dashboard di marketing può essere davvero difficile. Con così tanti strumenti che promettono di semplificare l'analisi dei dati, è complicato capire quali siano davvero efficaci. La piattaforma giusta può fare la differenza, trasformando dati complessi in informazioni chiare e aiutando il tuo team a prendere decisioni più intelligenti.
Ho testato e recensito diverse tra le soluzioni più note per aiutarti a scegliere quella più adatta alle tue esigenze. Il mio obiettivo è offrirti consigli sinceri e basati sulla ricerca, concentrandomi su ciò che conta davvero.
In questo articolo troverai un’analisi delle principali funzionalità, dei pro e contro e dei prezzi, per poter selezionare con sicurezza il software per dashboard di marketing più adatto per il tuo team.
Table of Contents
Perché Fidarti delle Nostre Recensioni Software
Testiamo e recensiamo software di marketing dal 2022. Essendo noi stessi esperti di marketing, sappiamo quanto sia critico e difficile prendere la decisione giusta nella scelta di un software. Investiamo in una ricerca approfondita per aiutare il nostro pubblico a prendere decisioni migliori sugli acquisti software. Abbiamo testato oltre 2.000 strumenti per diversi casi d’uso nel marketing e scritto più di 1.000 recensioni approfondite. Scopri come rimaniamo trasparenti & la nostra metodologia di recensione software.
Riepilogo Migliori Software per Dashboard di Marketing
| Tool | Best For | Trial Info | Price | ||
|---|---|---|---|---|---|
| 1 | Best multi-integration dashboards | 14-day free trial + free demo available | From $44/month (billed annually) | Website | |
| 2 | Best for sentiment analysis | 14-day free trial available | From $199/month (billed annually) | Website | |
| 3 | Best for tracking trends to act on | Free demo available | Available upon request | Website | |
| 4 | Best for spreadsheet-based marketing dashboards | Free plan available | From $49/month (billed annually) | Website | |
| 5 | Best for visualizing PPC campaign results | 7-day free trial | From $49/month/brand | Website | |
| 6 | Best for multi-source marketing intelligence | Free demo available | Pricing upon request | Website | |
| 7 | Best for email marketing analytics | Free plan available | From $229/month (billed annually) | Website | |
| 8 | Best for building custom dashboards from scratch | Free plan available | From $9/user/project/month | Website | |
| 9 | Best for interactive charts and graphs | 30-day free trial available | From $199/seat/month (billed annually) | Website | |
| 10 | Best for competitor intelligence | Free demo available | Pricing upon request | Website |
-

Eloqua
Visit WebsiteThis is an aggregated rating for this tool including ratings from Crozdesk users and ratings from other sites.4.3 -
Optimizely
Visit WebsiteThis is an aggregated rating for this tool including ratings from Crozdesk users and ratings from other sites.4.2 -
Uberflip
Visit WebsiteThis is an aggregated rating for this tool including ratings from Crozdesk users and ratings from other sites.4.3


Recensioni Software per Dashboard di Marketing
Ecco una breve descrizione di ciascuno degli strumenti presenti in questa lista.

DashThis is an easy-to-use software that will save you time in generating your automated reports and creating dashboards. Access to your data sources is unlimited and the platform connects to over 34 of the most commonly used digital marketing tools. The number of users is also not limited like with other tools on the market.
Why I Picked DashThis: DashThis excels in handling multi-integration dashboards by seamlessly integrating with various data sources, such as Google Analytics, Facebook Ads, Instagram, and LinkedIn. With its user-friendly interface, users can easily connect multiple platforms, import data, and customize their dashboards to display key performance indicators (KPIs) from different sources in a cohesive and visually appealing manner. DashThis provides a centralized hub for marketers to track and analyze data from multiple channels, empowering them to gain comprehensive insights, make informed decisions, and optimize their marketing strategies efficiently.
DashThis Standout Features & Integrations
Features include marketing dashboards that display KPIs from multiple external sources, a CSV file import system, unlimited client accounts, templates and cloning options, report sharing (email, PDF, URL), white labeling services, and a custom widget editor.
Integrations include Tiktok Ads, Google Ads, GA4, and Facebook Ads among others.
Pros and Cons
Pros:
- Easy to use
- Integration capabilities
- Responsive customer support
Cons:
- Limited advanced features
- Costly for smaller teams
New Product Updates from DashThis

DashThis Launches Shopify Integration in Beta
DashThis’s Shopify integration is now available to all users in beta, adding Shopify metrics, dimensions, and preset widgets to report on ecommerce performance alongside other marketing channels. For more information, visit DashThis's official site.
 .
.
Brand24 is a marketing dashboard tool that tracks brand mentions across 25 million+ sources, including social, news, forums, and podcasts. It gives you a visual, real-time view of how people are talking about your brand—segmenting sentiment, reach, and intent—so you can monitor campaigns and make data-informed decisions.
Why I Picked Brand24: I picked Brand24 for its ability to help you understand how people feel about your brand at scale. Its dashboards go beyond vanity metrics, letting you dig into the emotional tone of mentions across platforms in real time. I also appreciated how it surfaces actionable insights—automated alerts flag unusual spikes, and real-time data is pushed to Slack so your team can quickly decide how to respond. If you need brand performance stats without the guesswork, this one’s worth exploring.
Brand24 Standout Features & Integrations
Features include topic analysis, intent detection, influence scoring, reputation and presence metrics, customizable reports, emoji-based emotion tracking, and project-level comparison dashboards.
Integrations include Slack, HubSpot, Trello, Asana, Buffer, Google Analytics, Hootsuite, Facebook, Instagram, LinkedIn, Telegram, TikTok, and Spotify.
Pros and Cons
Pros:
- Tracks campaign hashtags with reach and volume metrics
- Alerting system for mention spikes and anomalies
- Sentiment, reach, and intent metrics in one view
Cons:
- Some integrations (like CRM) require manual setup
- Dashboards can feel cluttered with high volume data
New Product Updates from Brand24

Brand24 Adds Spoken Mention Detection for YouTube Videos
Brand24 now detects spoken brand mentions in YouTube videos by analyzing auto-generated captions, surfacing results with timestamps, filters, and alerts. The feature helps teams find brand mentions in video audio even when they are not included in titles, descriptions, or comments. For more information, visit Brand24’s official site.
 .
.
TikTok is a popular social media platform that focuses on short-form video sharing. Marketers can monitor the performance of their content and track trends in the platform, helping them create more engaging content and tap into trending challenges, formats, audio, and more.
Why I picked TikTok: I chose to include TikTok because its analytics dashboard offers insights into video performance that help you act on trends quickly to increase visibility. You can track audience engagement and discover which trends are resonating most with your audience. By using TikTok’s trend data, your team can adjust campaigns in real-time and stay connected with what’s working. This makes it a strong choice for those looking to base marketing decisions on real-time trends and data.
TikTok Standout Features & Integrations
Features include trend analysis, video performance insights, and audience engagement metrics. You can track which trends are gaining momentum and act quickly to align your content. TikTok’s analytics give your team a real-time view of how your content is performing.
Integrations include Shopify, WooCommerce, BigCommerce, Magento, and Square.
Pros and Cons
Pros:
- Built-in tools for collaborations
- Quick access to audience engagement
- Offers detailed video insights
Cons:
- Hard to predict viral success
- Not suitable for multi-platform analytics

Coefficient is a data integration and reporting tool that connects marketing platforms, CRMs, and databases directly to Google Sheets or Excel. Marketing teams can sync live data into spreadsheets to build dashboards, track campaign performance, and automate reporting without manual exports. By keeping data updated automatically, Coefficient helps marketing operations teams spend less time preparing reports and more time analyzing results.
Why I Picked Coefficient
I picked Coefficient for its ability to turn spreadsheets into a live reporting environment for marketing data. Teams can connect tools like CRMs and analytics platforms, pull data into spreadsheets automatically, and build dashboards using familiar spreadsheet formulas and visualizations. Automated refreshes keep dashboards current, while AI-assisted features help you generate formulas and analyze data more efficiently.
Coefficient Key Features
In addition to its data modeling capabilities, Coefficient includes several features that support effective marketing dashboard reporting:
- Cross-channel data connections: Pull live data from Google Analytics, Meta Ads, Google Ads, HubSpot, Salesforce, LinkedIn, and other marketing platforms into a single reporting workflow.
- Scheduled refreshes: Automatically update dashboards and reports to keep campaign and performance data current without manual exports.
- AI-assisted dashboard building: Use natural language prompts to create dashboards, reports, formulas, and data transformations more efficiently.
- Automated alerts: Trigger Slack or email notifications when key metrics reach defined thresholds, enabling faster responses to performance changes.
Coefficient Integrations
Integrations include Salesforce, Google Search Console, Google Sheets, Microsoft Excel, Snowflake, HubSpot, Google Analytics, Google Ads, Facebook Ads, and Slack. Coefficient also provides an API for custom integrations.
Pros and Cons
Pros:
- Ability to create automated workflows
- Automated data enrichment
- Allows real-time data syncing from diverse sources
Cons:
- Lacks advanced visualization options compared to dedicated BI tools
- Dependence on external data sources for full functionality
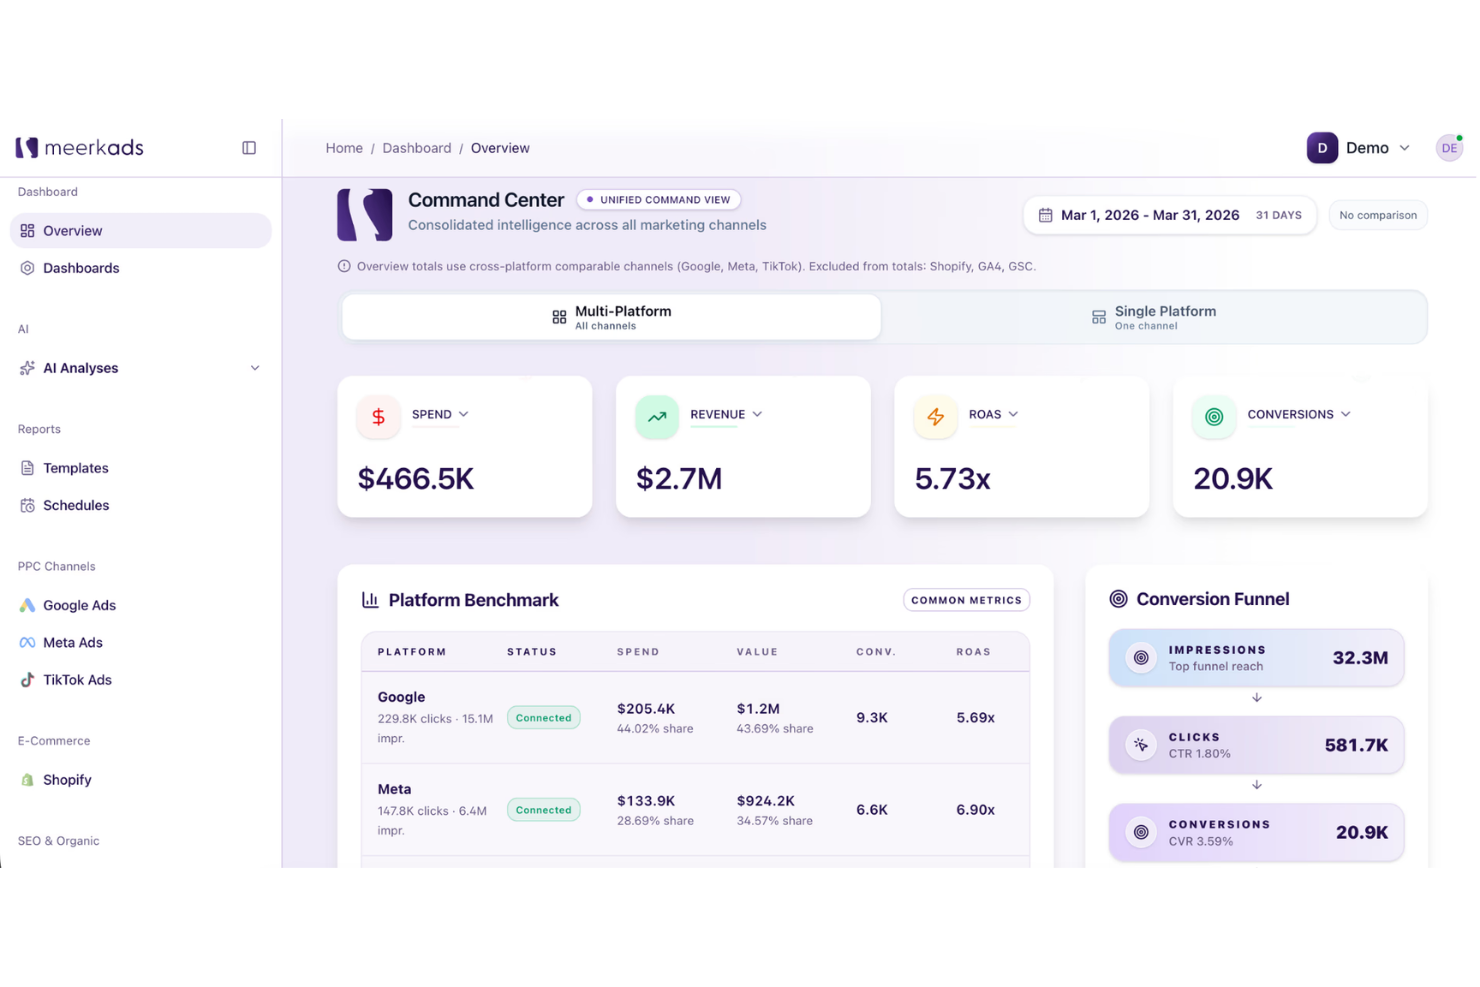
Meerkads helps ecommerce brands, agencies, and paid media teams replace scattered ad platform reports with real-time marketing dashboards. It pulls data from Google Ads, Meta Ads, TikTok Ads, and Shopify, then uses AI-powered analysis to surface campaign issues, creative performance trends, and product-level revenue insights.
Who Is Meerkads Best For?
Meerkads is a strong fit for paid media managers and performance marketing agencies that need a centralized view of ad spend and results across multiple platforms.
Why I Picked Meerkads
I picked Meerkads because it makes PPC campaign results easier to compare across Google Ads, Meta Ads, and TikTok Ads from one dashboard. You can track ROAS, CPA, CTR, spend, and conversions side by side, which helps your team spot which channels and campaigns are driving the strongest results. I also like its campaign and ad-level breakdowns because they make it easier to review performance without jumping between separate ad platforms. Its AI performance scoring adds another useful layer by grading campaigns, so you can quickly identify underperforming ads and prioritize what needs attention first.
Meerkads Key Features
Some other features in Meerkads help teams monitor ad performance, report results, and connect campaign data to ecommerce revenue:
- Creative fatigue detection: Flags ads that are losing performance over time so your team knows when to refresh creative.
- White-labeled shareable dashboards: Creates dashboard links that clients or stakeholders can view without needing a Meerkads login.
- Automated performance alerts: Notifies your team when metrics like ROAS or CPA move outside your set thresholds.
- Shopify sales data overlay: Connects Shopify revenue data with ad spend to show ROAS based on actual order values.
Meerkads Integrations
Integrations include Google Search Console, TikTok Ads, Meta Ads, Google Ads, GA4, and Shopify.
Pros and Cons
Pros:
- Combines Google, Meta, TikTok, and Shopify performance data
- Shows real ROAS using ecommerce revenue and ad spend
- Supports white-labeled dashboards and reports for agency clients
Cons:
- No SEO or organic marketing dashboards
- Limited to paid ad channel data sources
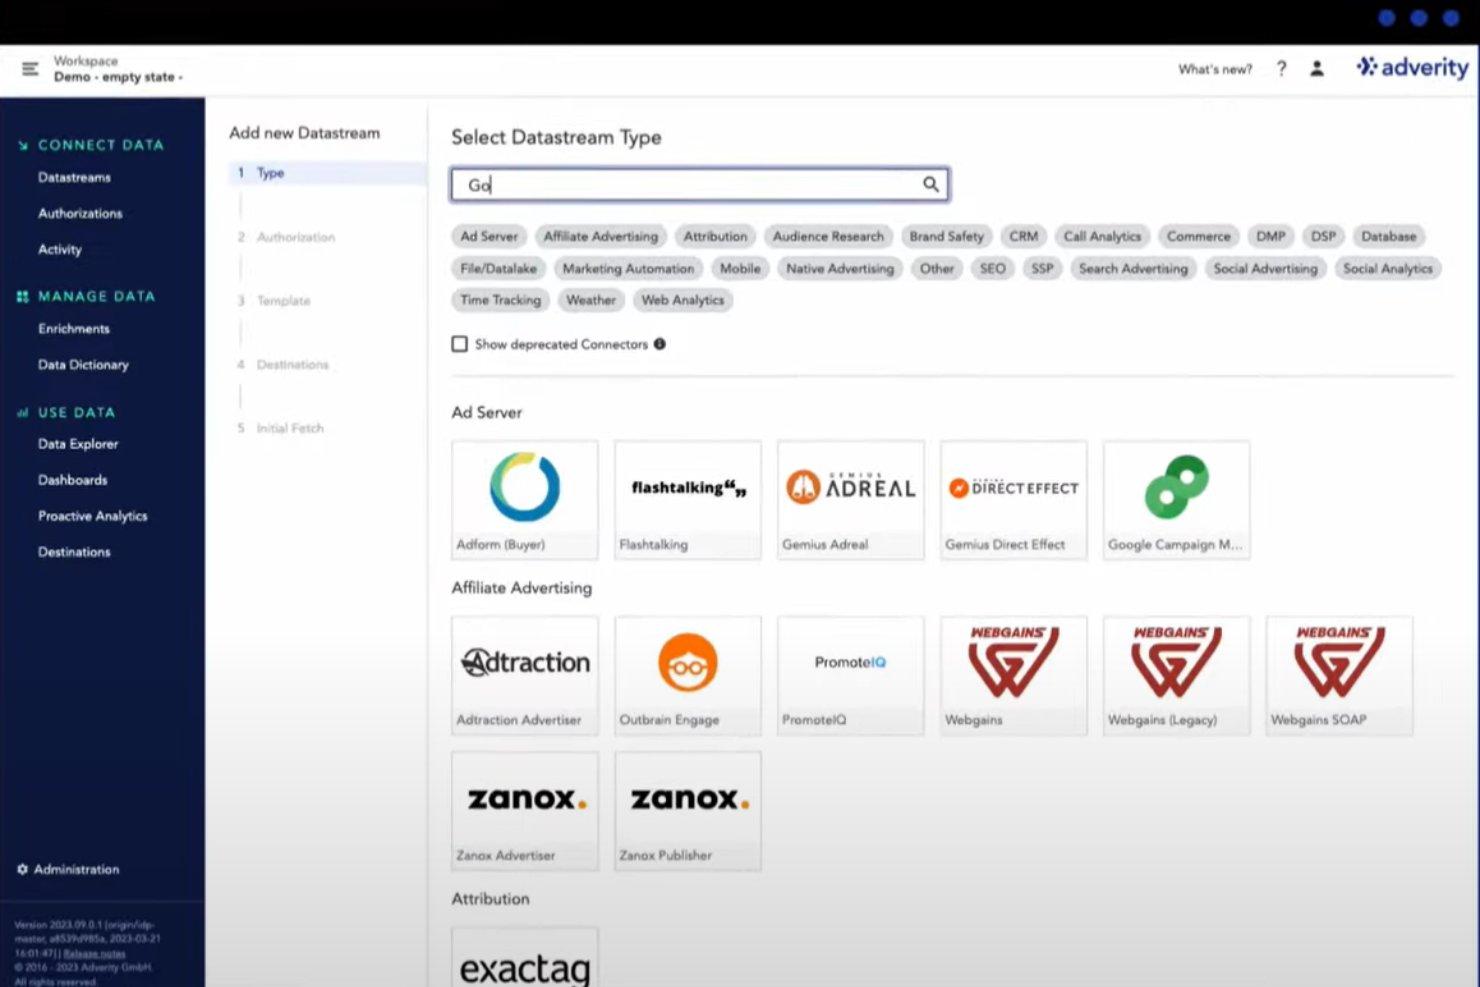
Adverity is a data intelligence platform designed to help marketing teams collect, prepare, and analyze data from various sources. It lets you build dashboards that provide insights into campaign performance and marketing spend.
Why I Picked Adverity: Adverity offers AI-driven features that enhance your dashboards with proactive insights. Its AI capabilities automatically identify critical patterns and anomalies in your data, presenting them in a straightforward manner. This allows you to quickly spot issues or opportunities, such as reallocating budgets or adjusting campaigns, without the need for manual analysis or data science expertise. I also like Adverity's transformation copilot, which simplifies the process of cleaning and enriching data. By using natural language prompts, you can transform complex datasets into ready-to-use insights without writing code.
Adverity Standout Features & Integrations
Features include data quality monitoring, dashboard sharing options, widget-based dashboard construction, real-time data updates, customizable dashboard themes, data export capabilities, public dashboard links, dashboard collaboration tools, and version control.
Integrations include Google Ads, Facebook Ads, TikTok Ads, Amazon Ads, Google BigQuery, Looker Studio, Google Drive, Hubspot, Salesforce, Zendesk, App Annie, and Google Analytics.
Pros and Cons
Pros:
- Provides the ability to create personalized dashboards
- Can harmonize data from various sources
- Scalable for businesses of various sizes
Cons:
- The initial setup can be complex and time-consuming
- Certain features may require technical knowledge
New Product Updates from Adverity
Adverity Enhances Connectors and Adds TikTok GMV Max
Adverity updates connectors for Amazon Ads, SmartNews Ads, Indeed, and monday.com, and introduces the TikTok GMV Max connector. These updates improve data accuracy, control, and performance across integrations. For more information, visit Adverity’s official site.
 .
.
Whatagraph is a marketing analytics and social media reporting platform that provides multi-channel reports, custom data widgets, team management, filtering options, pre-made templates, branded white label, image uploads, and commenting.
Why I Picked Whatagraph: Whatagraph is a powerful tool for email marketing analytics, offering several features that make it stand out in this area. With Whatagraph, users can gather data from email marketing platforms, such as open rates, click-through rates, conversions, and subscriber engagement metrics, and visualize this data in easy-to-understand and visually appealing reports. The platform allows for customization, enabling users to tailor their reports to specific metrics, timeframes, or target audiences. Whatagraph also offers automated reporting capabilities, allowing users to schedule regular email performance reports and receive them directly in their inbox.
Whatagraph Standout Features & Integrations
Features analytics, calendar management, dashboard, data import/export, data visualization, external integrations, keyword tracking, link tracking, marketing automation, multi-user, notifications, referral tracking, scheduling, seo, and social-media integration.
Integrations include Adroll, Authority Ads, Bing Ads, CallRail, Campaign Monitor, Celtra, Cvent, Emma, Facebook, Google Analytics and Ads, Instagram, YouTube, Oath (Yahoo), LinkedIn, Mailchimp, SEMrush, Twitter, Snapchat, Tubemogul, Hubspot, CSV, Excel, and more.
Pros and Cons
Pros:
- Multi-channel integration
- User-friendly interface
- Strong automated reporting
Cons:
- Limited data manipulation capabilities
- Learning curve for setup

Looker Studio (was: Google Data Studio) is a dashboard reporting solution for users who want to go above and beyond what Google Analytics has to offer. Data Studios, like many Google services, is free to use. Additionally, Looker Studio is feature-rich and constantly updating, so you won’t feel anything lacking.
Why I Picked Looker Studio: Looker Studio is highly regarded for its capabilities in building marketing dashboards from scratch. The platform offers a range of tools and features that empower users to create customized and visually appealing dashboards tailored to their specific marketing needs. With Looker Studio, users can leverage its drag-and-drop interface and intuitive design elements to easily design and arrange widgets, charts, and visualizations. The platform's robust data modeling capabilities enable users to connect to multiple data sources, perform complex calculations, and create calculated fields, providing flexibility and control over the data displayed in the dashboard. Looker Studio also offers collaborative features, allowing teams to work together on dashboard creation and share insights seamlessly.
Looker Studio Standout Features & Integrations
Features include data visualizations, custom dashboards, interactive reports, marketing templates, external integrations, data import/export, report sharing, and automated email reports.
Integrations include other Google software, like AdWords, Sheets, Analytics, as well as third-party solutions like Adobe Analytics, Asana, Bing Ads, Facebook Ads, BigQuery, MySQL, PostgreSQL, and Hubspot.
Pros and Cons
Pros:
- Customizable and interactive dashboards
- Powerful data modeling and querying
- Collaboration and sharing
Cons:
- Complex implementation and setup
- Learning curve
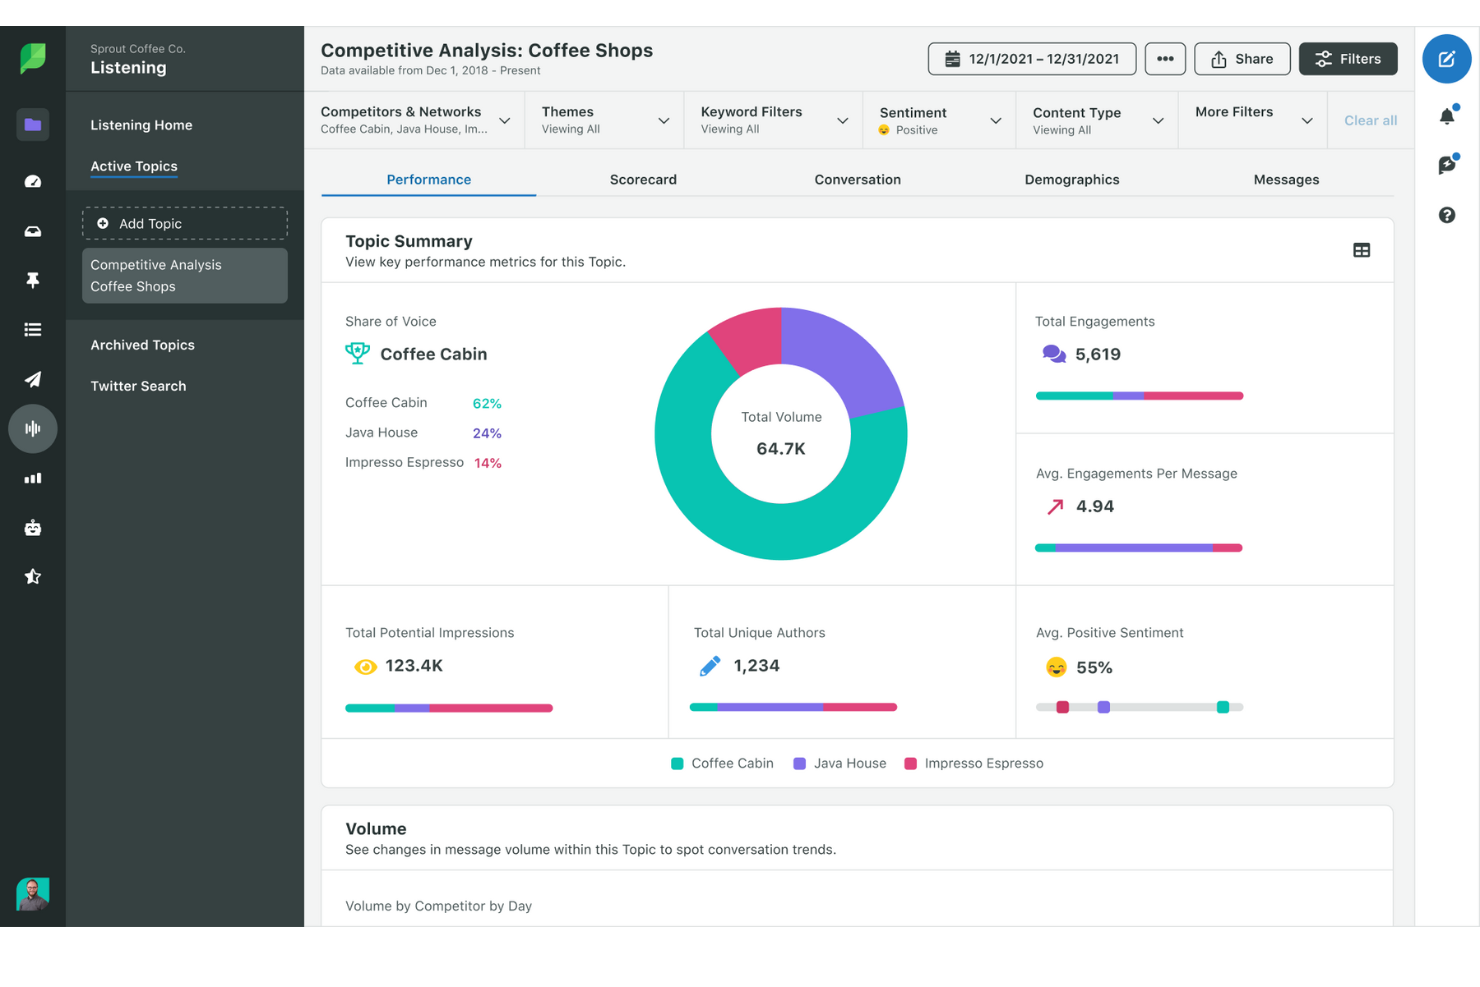
Sprout Social is a social media management platform designed to give businesses the tools they need to succeed in their social media efforts. Offering a wide range of features, it helps organizations manage their social media presence, engage with audiences, analyze performance, and optimize their strategies.
Why I Picked Sprout Social: As a marketing dashboard software, Sprout Social excels with its robust features tailored for detailed analytics and reporting. Its marketing dashboards are equipped with interactive charts and graphs, allowing users to visualize data more effectively and derive actionable insights. The platform offers customizable dashboards that can be tailored to track the metrics most important to your business. With real-time data and comprehensive reporting tools, Sprout Social enables marketers to make informed decisions and optimize their strategies for better performance.
Sprout Social Standout Features & Integrations
Features include social media listening, competitive analysis, sentiment analysis, trend tracking, custom reporting, campaign performance tracking, engagement metrics, audience demographics, content performance analysis, and cross-platform publishing.
Integrations include Facebook, X (Twitter), Instagram, LinkedIn, Pinterest, YouTube, Google Analytics, HubSpot, Salesforce, Zendesk, and Slack.
Pros and Cons
Pros:
- Content scheduling and planning features
- Wide range of customizable reports
- Social media listening features
Cons:
- Standard plan limited to 5 social profiles
- Price may be high for smaller businesses
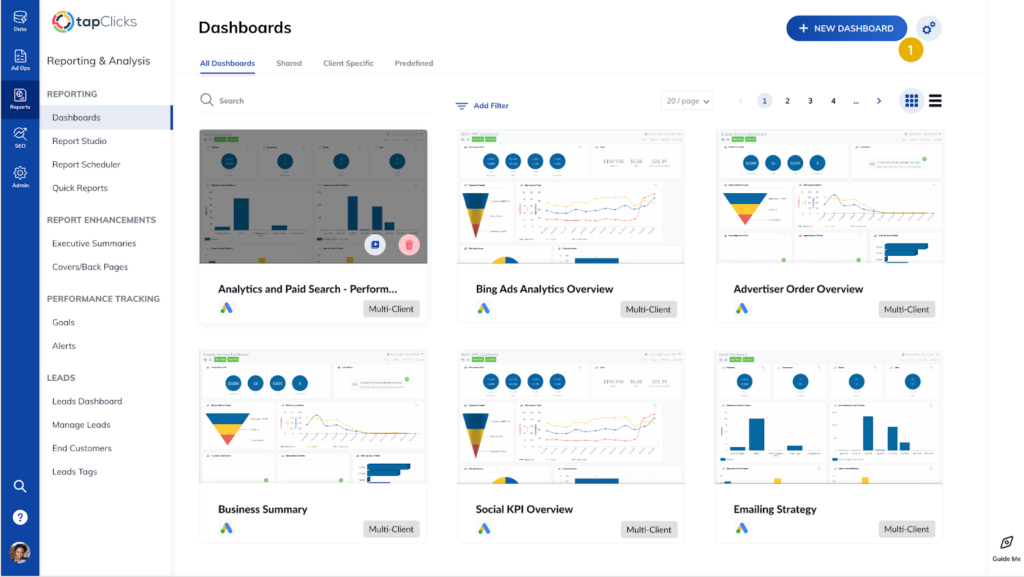
Used by 4000+ agencies and brands, TapClicks is a unified platform for all marketing operations that included features like single-dashboard campaign information, an easy reports generator, company-wide marketing analytics visibility, and more. Tap Analytics is particularly useful if you have custom calculations and metrics that you use to demonstrate business value.
Why I Picked TapClicks: TapClicks is an excellent tool for competitor analysis and intelligence, offering robust features that enable businesses to gain valuable insights into their competitors' strategies and performance. With TapClicks, users can track and analyze competitors' digital marketing activities, including their ad campaigns, social media presence, website traffic, and search engine rankings. The platform provides comprehensive reporting and visualizations, allowing users to compare their own performance against competitors and identify areas for improvement. TapClicks also offers competitive benchmarking and monitoring features, enabling businesses to stay updated on industry trends, identify emerging competitors, and make informed decisions to stay ahead in the market.
TapClicks Standout Features & Integrations
Features include reports, analytics, dashboards, competitor intelligence, business process management, workflow management, site audits, rank tracking, link-building, keyword research, external integrations, and data collaboration.
Integrations include over 200 apps and software, including Google Analytics and Ads, Facebook, Yelp, Twitter, Snapchat, LinkedIn, Criteo, AppNexus, MediaMath, Adobe Marketing Cloud, Instagram, AdRoll, StackAdapt, Bing Ads, YouTube, CallRail, and Mailchimp.
Pros and Cons
Pros:
- Comprehensive data aggregation
- Competitive intelligence features
- Collaboration and client reporting
Cons:
- Learning curve and complexity
- Complex pricing structure
Altri Software per Dashboard di Marketing
Ecco qualche altra soluzione che non è entrata nella classifica principale. Se hai bisogno di ulteriori suggerimenti su dashboard di marketing utili, dai un’occhiata a queste.
- Athenic
For customizable AI dashboards
- Mixpanel
For customizable marketing KPIs
- HighLevel
For consolidating marketing tools
- Power BI
Marketing funnel data
- ClicData
For data collaboration
- Octoboard
For product & ecommerce marketing
- Tracknow
For affiliate marketing
- Impact
For partnership management
- Social Status
For automated social media reports
- Zoho Analytics
Marketing data visualizations
- Supermetrics
For integrating 150+ data sources
- Signara
For automated report delivery by email
- Sisense
Interactive dashboards
- Google Analytics
Free reporting tools by Google
- Klipfolio
Dashboards for startups
- Domo
Marketing executive dashboard
- Tableau
For marketing agencies
- Supermetrics
Marketing dashboards for e-commerce
- Board
Dashboards for finance and insurance companies
- Cyfe
Facebook marketing dashboard software


Criteri di Selezione per il Software di Dashboard di Marketing
Nella scelta dei migliori software per dashboard di marketing da includere in questa lista, ho considerato le esigenze tipiche degli acquirenti e le difficoltà più comuni, come la facilità di integrazione e le capacità di visualizzazione dei dati. Ho anche usato il seguente schema per garantire una valutazione strutturata ed equa:
Funzionalità Principali (25% del punteggio totale)
Per essere preso in considerazione, ogni soluzione doveva soddisfare questi casi d’uso comuni:
- Monitorare i principali indicatori di performance
- Integrare con strumenti di marketing
- Fornire aggiornamenti dei dati in tempo reale
- Offrire dashboard personalizzabili
- Visualizzare le tendenze dei dati
Funzionalità Distintive Aggiuntive (25% del punteggio totale)
Per restringere ulteriormente la selezione, ho ricercato anche funzionalità particolari come:
- Capacità di analisi predittiva
- Insight guidati dall’intelligenza artificiale
- Accessibilità multipiattaforma
- Notifiche di avviso personalizzate
- Opzioni avanzate di filtraggio dei dati
Usabilità (10% del punteggio totale)
Per valutare la facilità d’uso di ciascun sistema, ho preso in considerazione i seguenti aspetti:
- Design dell’interfaccia intuitivo
- Navigazione e layout semplici
- Curva di apprendimento ridotta
- Impostazioni utente personalizzabili
- Design reattivo per l’utilizzo da mobile
Onboarding (10% del punteggio totale)
Per valutare l'esperienza di onboarding di ciascuna piattaforma, ho considerato i seguenti aspetti:
- Disponibilità di video formativi
- Accesso a modelli e guide
- Tour interattivi del prodotto
- Chatbot di supporto e centri assistenza
- Webinar per la formazione degli utenti
Assistenza clienti (10% del punteggio totale)
Per valutare i servizi di assistenza clienti di ciascun fornitore software, ho considerato i seguenti aspetti:
- Assistenza disponibile 24/7
- Molteplici canali di contatto
- Tempi di risposta rapidi
- Accesso a una base di conoscenza
- Opzioni di supporto personalizzate
Rapporto qualità-prezzo (10% del punteggio totale)
Per valutare il rapporto qualità-prezzo di ciascuna piattaforma, ho preso in considerazione quanto segue:
- Modelli di prezzo competitivi
- Disponibilità di prova gratuita
- Opzioni di prezzo a più livelli
- Costo rispetto alle funzionalità offerte
- Sconti per abbonamenti annuali
Recensioni dei clienti (10% del punteggio totale)
Per comprendere il grado di soddisfazione generale dei clienti, ho considerato i seguenti elementi nella lettura delle recensioni:
- Punteggi di soddisfazione degli utenti
- Feedback sulla facilità d'uso
- Commenti sull'efficacia delle funzionalità
- Feedback sull'esperienza di supporto
- Affidabilità complessiva dello strumento
Come scegliere un software per dashboard di marketing
È facile perdersi tra lunghe liste di funzionalità e strutture di prezzo complesse. Per aiutarti a rimanere concentrato durante il processo di selezione del software più adatto alle tue esigenze, ecco una checklist di fattori da considerare:
| Fattore | Cosa Considerare |
|---|---|
| Scalabilità | Il software può crescere insieme alla tua azienda? Considera il volume di dati e il numero di utenti futuri. Assicurati che possa soddisfare le crescenti esigenze senza costi aggiuntivi o problemi di performance. |
| Integrazioni | È compatibile con gli strumenti che già utilizzi? Verifica la compatibilità con CRM, social media e piattaforme email. L'integrazione automatica riduce il lavoro manuale e le barriere tra dati. |
| Personalizzazione | Puoi personalizzare le dashboard in base alle tue necessità? Cerca opzioni per layout flessibili e widget. Le visualizzazioni personalizzate dovrebbero essere in linea con gli obiettivi e i parametri del tuo team. |
| Facilità d'uso | L'interfaccia è intuitiva? Un design user-friendly riduce il tempo necessario per la formazione. Testalo con i membri del team per verificare che sappiano orientarsi facilmente. |
| Implementazione e onboarding | Quanto velocemente puoi iniziare a utilizzare il software? Controlla la disponibilità di risorse come tutorial e supporto. Un onboarding efficace aiuta il tuo team ad adottare rapidamente lo strumento e a trarne valore sin da subito. |
| Costo | Rientra nel tuo budget? Confronta i piani tariffari, inclusi eventuali costi nascosti. Valuta il rapporto tra costi e benefici e verifica che sia in linea con i tuoi vincoli finanziari. |
| Tutele di sicurezza | I dati sono protetti? Controlla che ci siano crittografia, controlli di accesso degli utenti e conformità alle normative sulla protezione dei dati. La sicurezza deve essere una priorità per proteggere le informazioni sensibili. |
Cos'è un software per dashboard di marketing?
I software per dashboard di marketing sono strumenti che visualizzano in un unico luogo i principali indicatori e dati di marketing. Professionisti del marketing, analisti e manager utilizzano generalmente questi strumenti per monitorare le performance e prendere decisioni informate.
Aggiornamenti dei dati in tempo reale, dashboard personalizzabili e capacità di integrazione facilitano l'analisi e la reportistica. Nel complesso, questi strumenti semplificano la gestione dei dati e migliorano il processo decisionale.
Funzionalità
Quando scegli un software per dashboard di marketing, presta attenzione alle seguenti funzionalità chiave:
- Aggiornamenti dei dati in tempo reale: Fornisce informazioni aggiornate al minuto, consentendo decisioni tempestive e modifiche di strategia rapide.
- Dashboard personalizzabili: Permette agli utenti di adattare la visualizzazione delle metriche e dei dati in linea con obiettivi e necessità aziendali specifiche.
- Capacità di integrazione: Si connette senza problemi agli strumenti e piattaforme di marketing già in uso per consolidare i dati e ridurre l’inserimento manuale.
- Strumenti di visualizzazione dei dati: Trasforma dati complessi in grafici e diagrammi facilmente comprensibili, facilitando un’analisi rapida.
- Controlli di accesso utente: Garantisce la sicurezza dei dati permettendo agli amministratori di impostare permessi e controllare chi può visualizzare o modificare le informazioni.
- Analisi predittiva: Offre intuizioni sulle tendenze future grazie ai dati storici, aiutando il team ad anticipare e pianificare le sfide imminenti.
- Accessibilità multipiattaforma: Consente l’accesso alle dashboard da vari dispositivi, assicurando che i team restino informati anche in mobilità.
- Notifiche di allerta: Invia avvisi automatici per cambiamenti o tendenze importanti, mantenendo il team proattivo invece che reattivo.
- Risorse formative: Offre tutorial, guide e supporto per aiutare gli utenti a familiarizzare rapidamente e massimizzare l’uso dello strumento.
Vantaggi
L’implementazione di un software per dashboard di marketing offre numerosi benefici per il tuo team e per la tua azienda. Ecco alcuni vantaggi da cui potrai trarre beneficio:
- Migliore processo decisionale: Gli aggiornamenti dati in tempo reale e l’analisi predittiva forniscono le informazioni necessarie per decisioni consapevoli.
- Maggiore efficienza: Le capacità di integrazione riducono l’inserimento manuale, permettendo al team di concentrarsi su attività strategiche.
- Maggiore chiarezza dei dati: Dashboard personalizzabili e strumenti di visualizzazione rendono i dati complessi più chiari e facilmente utilizzabili.
- Migliore collaborazione: L’accessibilità multipiattaforma garantisce che tutti i membri del team abbiano accesso alle stesse informazioni, ovunque si trovino.
- Gestione proattiva: Le notifiche di allerta aiutano ad anticipare problematiche e opportunità, mantenendo il team sempre un passo avanti.
- Garanzia di sicurezza: I controlli di accesso utente proteggono i dati sensibili, assicurando che solo il personale autorizzato possa accedere a determinate informazioni.
Costi & Prezzi
Scegliere un software per dashboard di marketing richiede la comprensione dei vari modelli e piani di prezzo disponibili. I costi variano in base alle funzionalità, alla dimensione del team, agli add-on e altro ancora. La tabella sottostante riassume i piani più comuni, i prezzi medi e le funzionalità tipiche incluse nelle soluzioni di software per dashboard di marketing:
Tabella comparativa dei piani per software di dashboard di marketing
| Tipo di piano | Prezzo medio | Funzionalità comuni |
|---|---|---|
| Piano gratuito | $0 | Visualizzazione di dati di base, integrazioni limitate e dashboard standard. |
| Piano personale | $10-$30/user/month | Dashboard personalizzabili, più opzioni di integrazione e capacità di esportazione dati. |
| Piano business | $50-$150/user/month | Analisi avanzate, strumenti di collaborazione di team e funzionalità di sicurezza potenziate. |
| Piano enterprise | $200+/user/month | Integrazioni illimitate, supporto dedicato al cliente e funzionalità complete di governance dei dati. |
Domande frequenti sul software di dashboard di marketing
Ecco alcune risposte alle domande più comuni sul software di dashboard di marketing:
Come gestiscono questi strumenti i dati provenienti da diversi canali di marketing?
La maggior parte delle piattaforme si collega direttamente a varie fonti di dati come social media, piattaforme pubblicitarie e strumenti email. La qualità e la velocità di queste connessioni variano in base alle integrazioni API dello strumento. Alcune aggiornano i dati quasi in tempo reale, mentre altre possono sincronizzare solo poche volte al giorno.
Le metriche e KPI personalizzati sono supportati dai vari strumenti?
Molte piattaforme consentono di definire metriche personalizzate, ma la flessibilità dipende da come lo strumento elabora e visualizza i dati. Alcune richiedono conoscenze SQL o formule, mentre altre offrono interfacce punta e clicca. Il supporto per campi calcolati e metriche combinate varia molto.
Come vengono gestiti l'accesso degli utenti e i permessi?
La maggior parte degli strumenti offre accessi basati su ruoli per controllare chi può visualizzare, modificare o condividere le dashboard. Le impostazioni di amministrazione variano: alcuni offrono livelli di permesso dettagliati per metrica o report, altri forniscono solo ruoli base di visualizzazione/modifica.
Lo strumento può collegarsi direttamente a piattaforme pubblicitarie come Google Ads o Meta Ads?
Molte piattaforme di dashboard offrono connessioni dirette, ma la stabilità e la profondità dei dati raccolti sono diverse. Alcune supportano solo dati a livello di campagna, mentre altre permettono di approfondire su gruppi di annunci, keyword e creatività. Anche la frequenza di aggiornamento e le metriche disponibili dipendono dallo strumento.
Questi strumenti supportano il monitoraggio dei dati storici?
Sì, anche se la profondità storica dei dati spesso dipende dall’integrazione e dalla configurazione della sincronizzazione. Alcuni strumenti archiviano dati storici internamente, altri dipendono dal recupero diretto dalla fonte. Le politiche di conservazione dei dati e le opzioni di esportazione cambiano in base alla piattaforma.
Cosa succede ora:
Se stai valutando software di dashboard di marketing, mettiti in contatto con un consulente SoftwareSelect per ricevere gratuitamente consigli personalizzati.
Compili un modulo e poi fai una rapida chiacchierata per approfondire le tue esigenze. Successivamente riceverai una shortlist di software da valutare. Sarai accompagnato durante l’intero processo d’acquisto, incluse eventuali trattative sul prezzo.