10 Strumenti di Analisi Web Scelti per 2026

10 Elenco degli Strumenti di Web Analytics


Gli strumenti di web analytics sono piattaforme software che tracciano, misurano e generano report sul traffico del sito e sul comportamento degli utenti. Se stai cercando i migliori strumenti di web analytics, probabilmente vuoi capire come i visitatori interagiscono con il tuo sito, identificare opportunità di crescita e prendere decisioni basate sui dati che impattano i tuoi risultati di marketing.
Molte piattaforme moderne sono soluzioni SaaS e includono funzionalità attente alla privacy, per aiutare i team a rispettare le normative sui dati in continua evoluzione, mantenendo comunque preziose informazioni. Con così tante opzioni disponibili, può essere difficile capire quale piattaforma si adatti alle tue esigenze, al tuo stack tecnologico e ai tuoi obiettivi di reportistica. Questo elenco ti aiuterà a confrontare le soluzioni leader per il 2026, così da poter scegliere con sicurezza lo strumento giusto per monitorare le prestazioni, ottimizzare le campagne e allineare l’analisi agli obiettivi di business.
Perché Fidarti delle Nostre Recensioni Software
Testiamo e recensiamo software di marketing dal 2022. Essendo noi stessi esperti di marketing, sappiamo quanto sia critico e difficile prendere la decisione giusta nella scelta di un software. Investiamo in una ricerca approfondita per aiutare il nostro pubblico a prendere decisioni migliori sugli acquisti software. Abbiamo testato oltre 2.000 strumenti per diversi casi d’uso nel marketing e scritto più di 1.000 recensioni approfondite. Scopri come rimaniamo trasparenti & la nostra metodologia di recensione software.
Riepilogo degli Strumenti di Web Analytics
Questa tabella comparativa riassume i dettagli sui prezzi dei miei migliori strumenti di web analytics per aiutarti a trovare il software ideale per il tuo budget e le necessità del tuo business.
| Tool | Best For | Trial Info | Price | ||
|---|---|---|---|---|---|
| 1 | Best for quick website audit reports | 14-day free trial available | From $29/month | Website | |
| 2 | Best for real-time digital experience insights | Free demo available | Pricing upon request | Website | |
| 3 | Best for competitor traffic benchmarking | Free trial + free demo available | Pricing upon request | Website | |
| 4 | Best for session replay and user journey analysis | Free plan + free demo available | Pricing upon request | Website | |
| 5 | Best for monitoring on-page SEO health | 14-day free trial available | From $50/month | Website | |
| 6 | Best for enterprise SEO performance tracking | Free demo available | Pricing upon request | Website | |
| 7 | Best for advanced cross-channel attribution | Free demo available | Pricing upon request | Website | |
| 8 | Best for customizable data visualization | Free plan available | Pricing upon request | Website | |
| 9 | Best for technical site crawling | Free plan available | From $279/license/year | Website | |
| 10 | Best for optimizing Bing search presence | Not available | Free forever | Website |
-

Eloqua
Visit WebsiteThis is an aggregated rating for this tool including ratings from Crozdesk users and ratings from other sites.4.3 -
Optimizely
Visit WebsiteThis is an aggregated rating for this tool including ratings from Crozdesk users and ratings from other sites.4.2 -
Uberflip
Visit WebsiteThis is an aggregated rating for this tool including ratings from Crozdesk users and ratings from other sites.4.3


Recensioni degli Strumenti di Web Analytics
Di seguito trovi le mie sintesi dettagliate degli strumenti di web analytics selezionati. Le mie recensioni offrono uno sguardo approfondito su caratteristiche, casi d’uso ideali e integrazioni di ciascuna piattaforma per aiutarti a trovare quella più adatta a te.
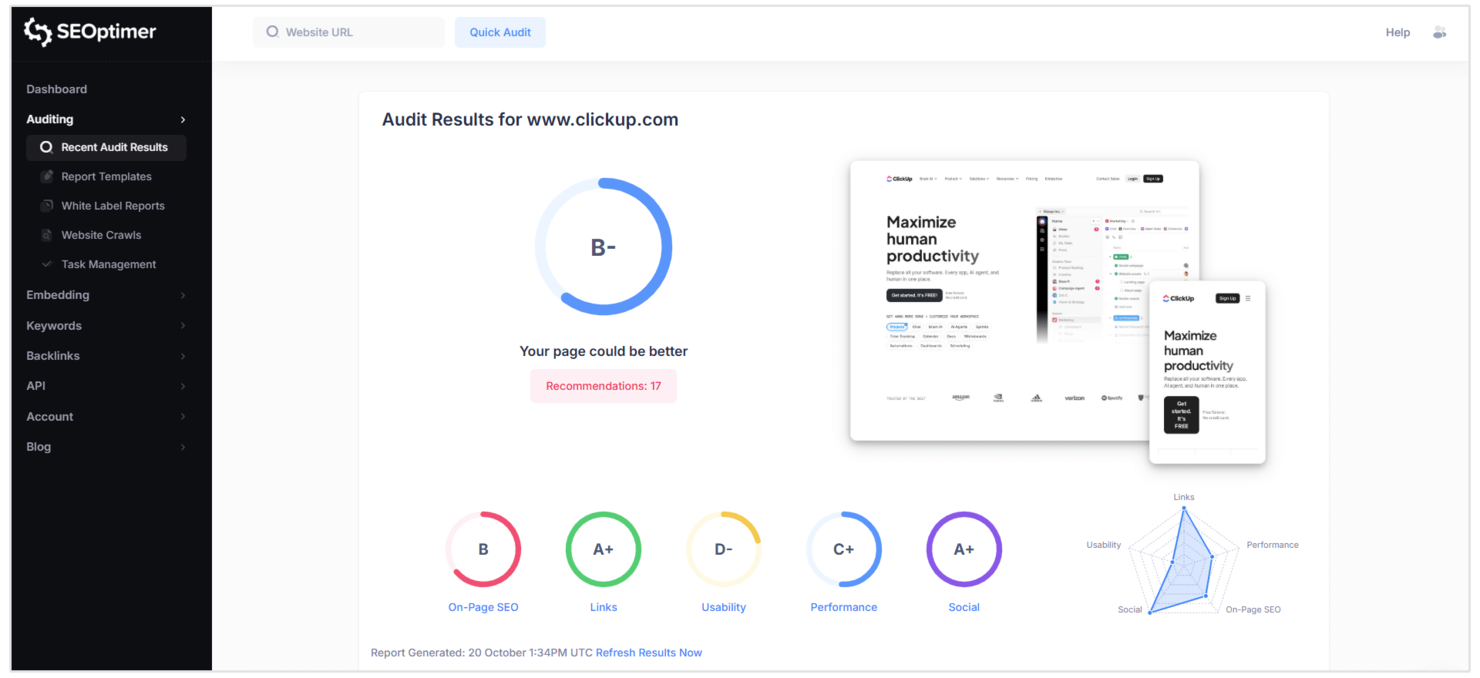
SEOptimer is built for marketers and small business owners who need fast, actionable website audit reports. The tool delivers clear, prioritized recommendations across SEO, usability, and performance in just seconds. If you want a straightforward way to spot and fix site issues without digging through complex analytics, SEOptimer is a practical choice.
Why I Picked SEOptimer
What drew me to SEOptimer is how quickly it generates detailed website audit reports, which is especially useful for teams that need instant feedback on site health. The platform scans your site and delivers a clear, prioritized checklist covering SEO, mobile usability, and technical performance. I appreciate that you can download branded PDF reports, making it easy to share findings with clients or stakeholders. For anyone who needs actionable insights without waiting or wading through complex dashboards, SEOptimer delivers on speed and clarity.
SEOptimer Key Features
Some other features make SEOptimer useful for web analytics teams:
- White Label Reporting: Create custom-branded audit reports for clients or internal teams.
- Embeddable Audit Tool: Add a website audit widget directly to your own site to capture leads.
- Keyword Tracking: Monitor keyword rankings over time for multiple websites.
- Backlink Analysis: Review your site’s backlink profile and identify new link opportunities.
SEOptimer Integrations
Integrations include Zapier and a native API for custom integrations.
Pros and Cons
Pros:
- Includes an embeddable audit tool for lead capture
- Offers white-label PDF reporting for agencies
- Generates audit reports in under a minute
Cons:
- Backlink analysis is less detailed than competitors
- Lacks real-time traffic analytics dashboard
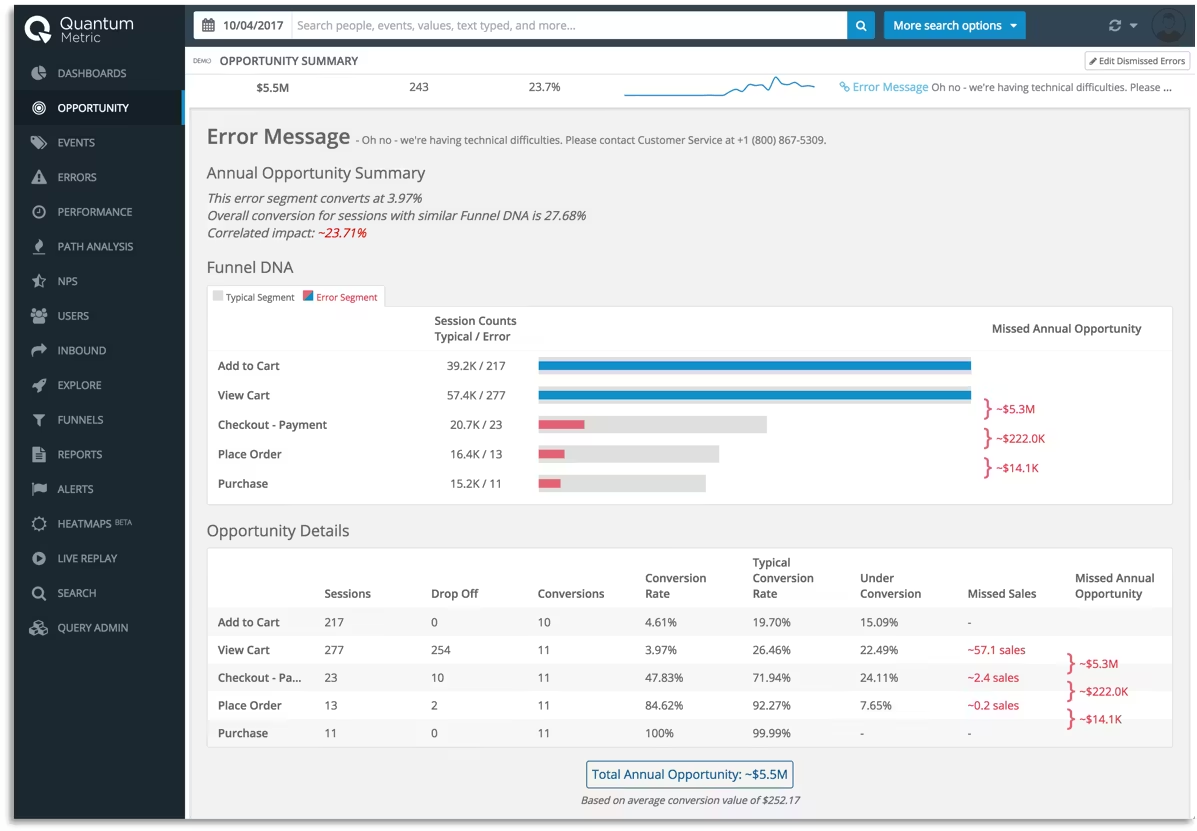
If you need to pinpoint digital experience issues as they happen, Quantum Metric delivers real-time insights that help teams act fast. This platform is built for digital product managers, UX teams, and ecommerce leaders who want to understand user behavior at a granular level. Quantum Metric stands out for its ability to surface friction points and quantify their impact on revenue in the moment.
Why I Picked Quantum Metric
What drew me to Quantum Metric is its focus on delivering real-time digital experience insights that go beyond standard web analytics. The platform captures user sessions and surfaces friction points as they occur, so teams can quickly identify and prioritize issues impacting conversion. I appreciate how Quantum Metric quantifies the business impact of each user struggle, making it easier to align technical fixes with revenue goals. For anyone who needs to react to digital experience problems as they happen, this tool offers the immediacy and depth that traditional analytics platforms often lack.
Quantum Metric Key Features
Some other features that make Quantum Metric valuable for web analytics teams include:
- Session Replay: Watch real user sessions to see exactly how visitors interact with your site or app.
- Automated Anomaly Detection: Get alerts when user behavior deviates from expected patterns.
- Journey Analytics: Visualize and analyze user flows across multiple touchpoints.
- Tagless Data Capture: Collect behavioral data without manual tagging or code changes.
Quantum Metric Integrations
Integrations include AB Tasty, Split, Novotech, Botcopy, ServiceNow, Qualtrics, Salesforce Service Cloud, Looker, Slack, and more.
Pros and Cons
Pros:
- Tagless data capture reduces manual setup
- Automated anomaly detection flags sudden issues
- Session replay shows exact user interactions
Cons:
- Advanced features need dedicated onboarding
- Data exports require additional configuration steps
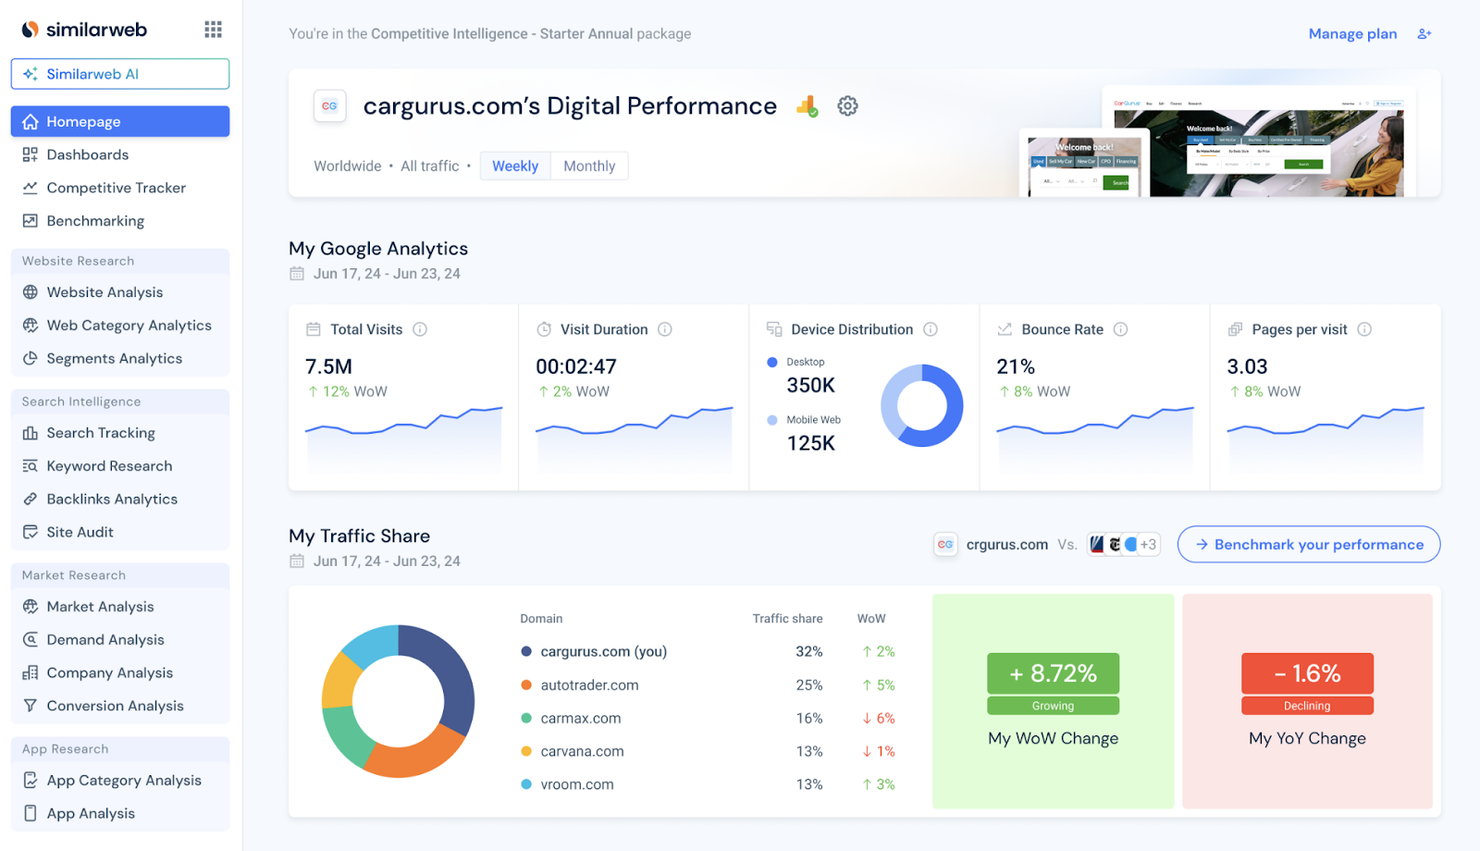
If you need to benchmark your website’s traffic against competitors, Similarweb gives you that visibility. The platform is designed for marketing teams, growth strategists, and digital analysts who want to understand market share, audience overlap, and traffic sources across any industry. Similarweb helps you uncover competitor strategies and spot new opportunities by providing detailed traffic and engagement data for any site.
Why I Picked Similarweb
For teams focused on understanding their position in the market, Similarweb offers unmatched competitor traffic benchmarking. I picked Similarweb because it provides detailed estimates of website visits, engagement metrics, and traffic sources for any domain, not just your own. The platform also breaks down audience demographics and referral channels, so you can see exactly where competitors are gaining traction. If you want to compare your digital performance to others in your industry, Similarweb gives you the data to do it.
Similarweb Key Features
Some other features make Similarweb valuable for digital market analysis:
- Keyword Research Tool: Discover top-performing keywords for any website or industry.
- Industry Analysis Reports: Access pre-built reports that summarize trends and benchmarks across entire sectors.
- Mobile App Analytics: Track downloads, usage, and engagement for mobile apps alongside web data.
- API Access: Integrate Similarweb data into your own dashboards or business intelligence tools.
Similarweb Integrations
Integrations include HubSpot and Salesforce.
Pros and Cons
Pros:
- Audience overlap analysis for market mapping
- Industry benchmarks available for multiple sectors
- Competitor traffic estimates cover global websites
Cons:
- Limited historical data for some smaller sites
- Data accuracy varies for low-traffic domains
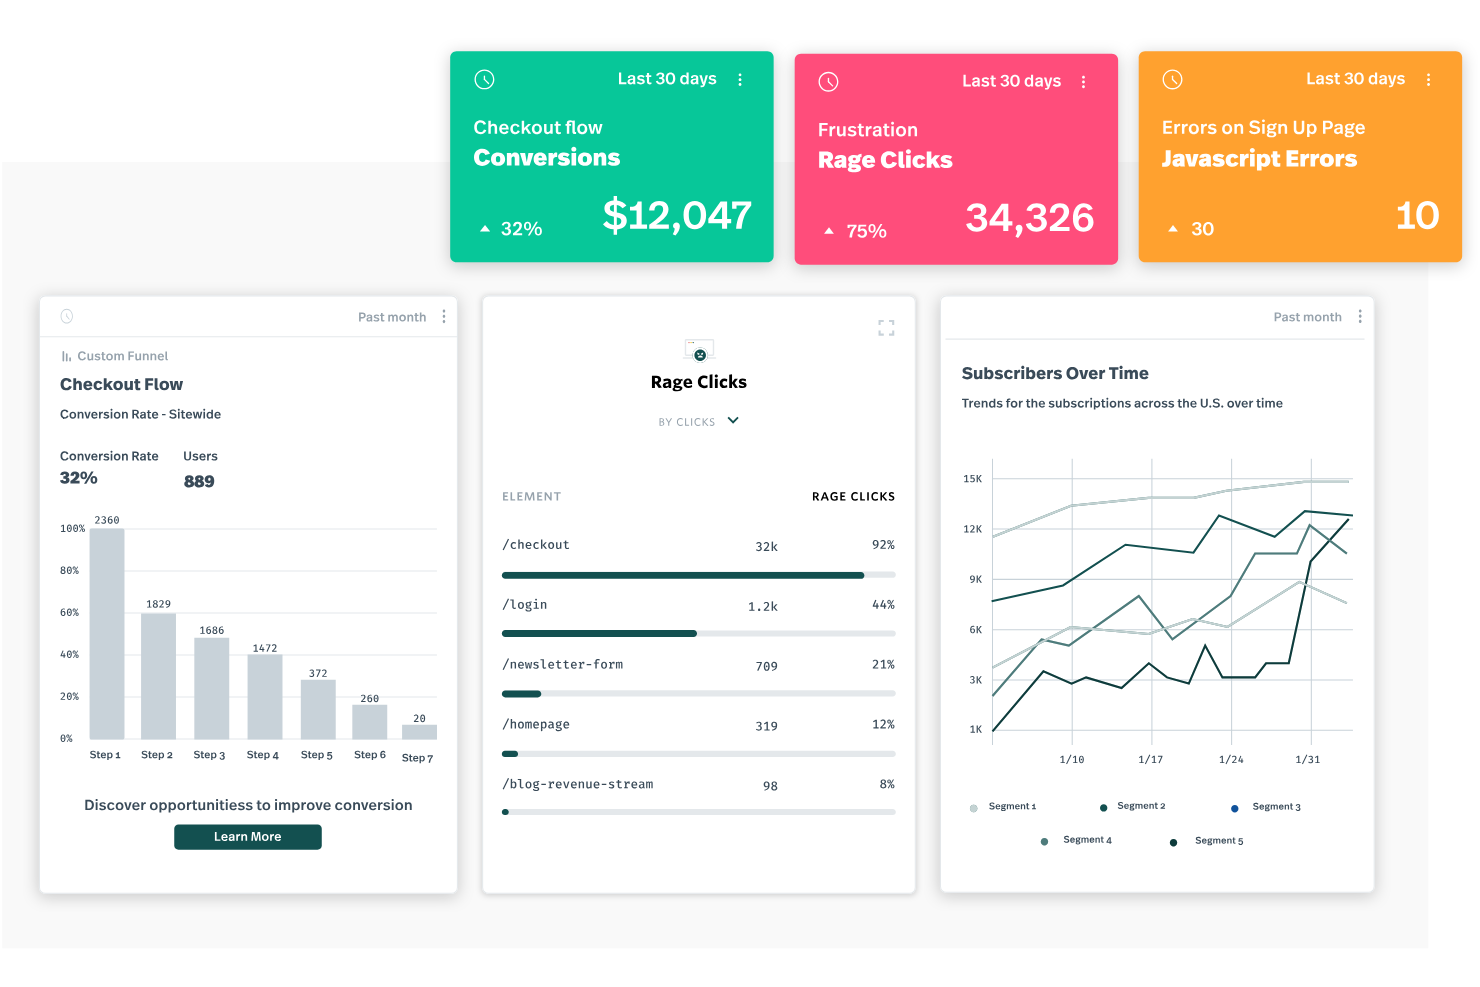
Fullstory gives product teams and digital marketers a way to see exactly how users interact with their websites and apps. The platform’s session replay and journey mapping features help you pinpoint friction points and understand user behavior in detail. If you need to visualize the full customer experience and uncover hidden UX issues, Fullstory offers a unique lens into real user journeys.
Why I Picked Fullstory
What sets Fullstory apart for me is its ability to capture and replay every user session, making it much easier to diagnose where users struggle or drop off. The session replay feature lets you watch real interactions, so you can see exactly what users experience on your site or app. I also like how Fullstory’s journey mapping visualizes the entire user path, helping you spot patterns and bottlenecks that traditional analytics might miss. For teams focused on optimizing user experience and conversion, these capabilities make Fullstory a strong choice.
Fullstory Key Features
Some other features make Fullstory valuable for web analytics teams:
- Heatmaps: Visualize aggregate user clicks, scrolls, and mouse movements across your site.
- Conversion Funnels: Build and analyze funnels to track where users drop off in key flows.
- Custom Event Tracking: Define and monitor specific user actions or behaviors without extra coding.
- Error Detection: Automatically surface JavaScript errors and user frustration signals during sessions.
Fullstory Integrations
Integrations include Segment, Google Analytics, Adobe Analytics, Slack, Jira, Zendesk, Optimizely, HubSpot, Salesforce, and more.
Pros and Cons
Pros:
- Frustration signals highlight UX pain points
- Heatmaps visualize aggregate user behavior
- Session replay shows full user interactions
Cons:
- Exporting raw data options are restricted
- Data sampling may miss some user sessions
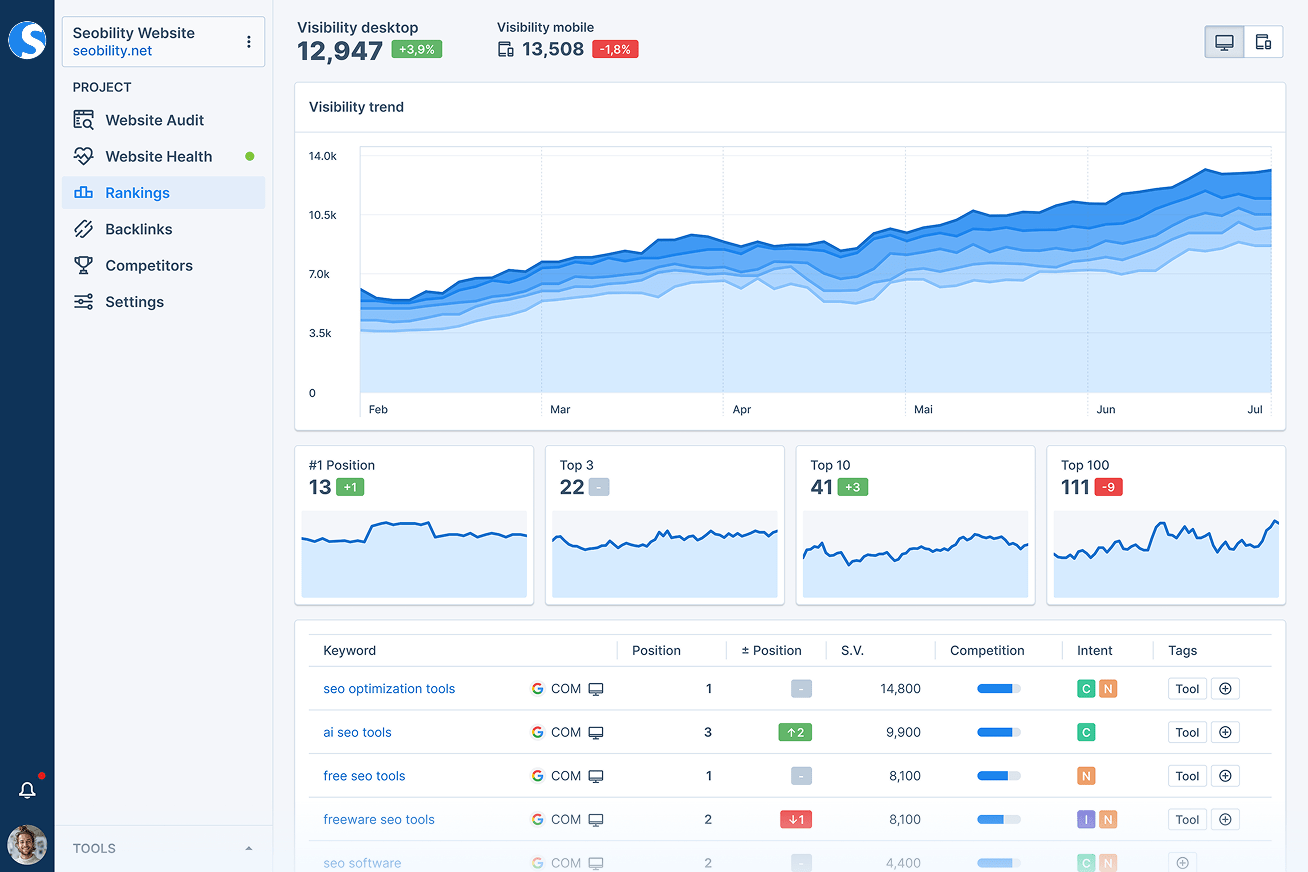
Seobility is designed for marketers and SEO specialists who need to keep a close eye on on-page SEO health. The platform automatically scans your website for technical issues, duplicate content, and optimization gaps that can impact search rankings. If you’re managing multiple sites or complex web properties, Seobility helps you spot and address on-page problems before they affect your visibility.
Why I Picked Seobility
For teams focused on maintaining strong on-page SEO health, Seobility offers targeted analytics that go beyond surface-level reporting. The tool continuously crawls your site to flag technical errors, broken links, and duplicate content that can hurt your rankings. I picked Seobility because its on-page audit reports and keyword monitoring features help you quickly identify and prioritize issues that matter most for search visibility. If you want a web analytics tool that specializes in keeping your site optimized for search engines, Seobility is built for that purpose.
Seobility Key Features
I also found several other features that make Seobility useful for web analytics and SEO management:
- Competitor Analysis: Track and compare your site’s SEO performance against selected competitors.
- Rank Tracking: Monitor keyword rankings across different search engines and locations.
- On-Page SEO Checker: Get actionable suggestions for improving individual page optimization.
- Backlink Monitoring: Analyze and track the status of your site’s backlinks over time.
Seobility Integrations
Native integrations are not currently listed.
Pros and Cons
Pros:
- Competitor analysis includes keyword and backlink data
- On-page SEO checker provides actionable suggestions
- Automated site crawling detects technical SEO issues
Cons:
- Site audit frequency is restricted on lower plans
- Lacks real-time traffic or user behavior data
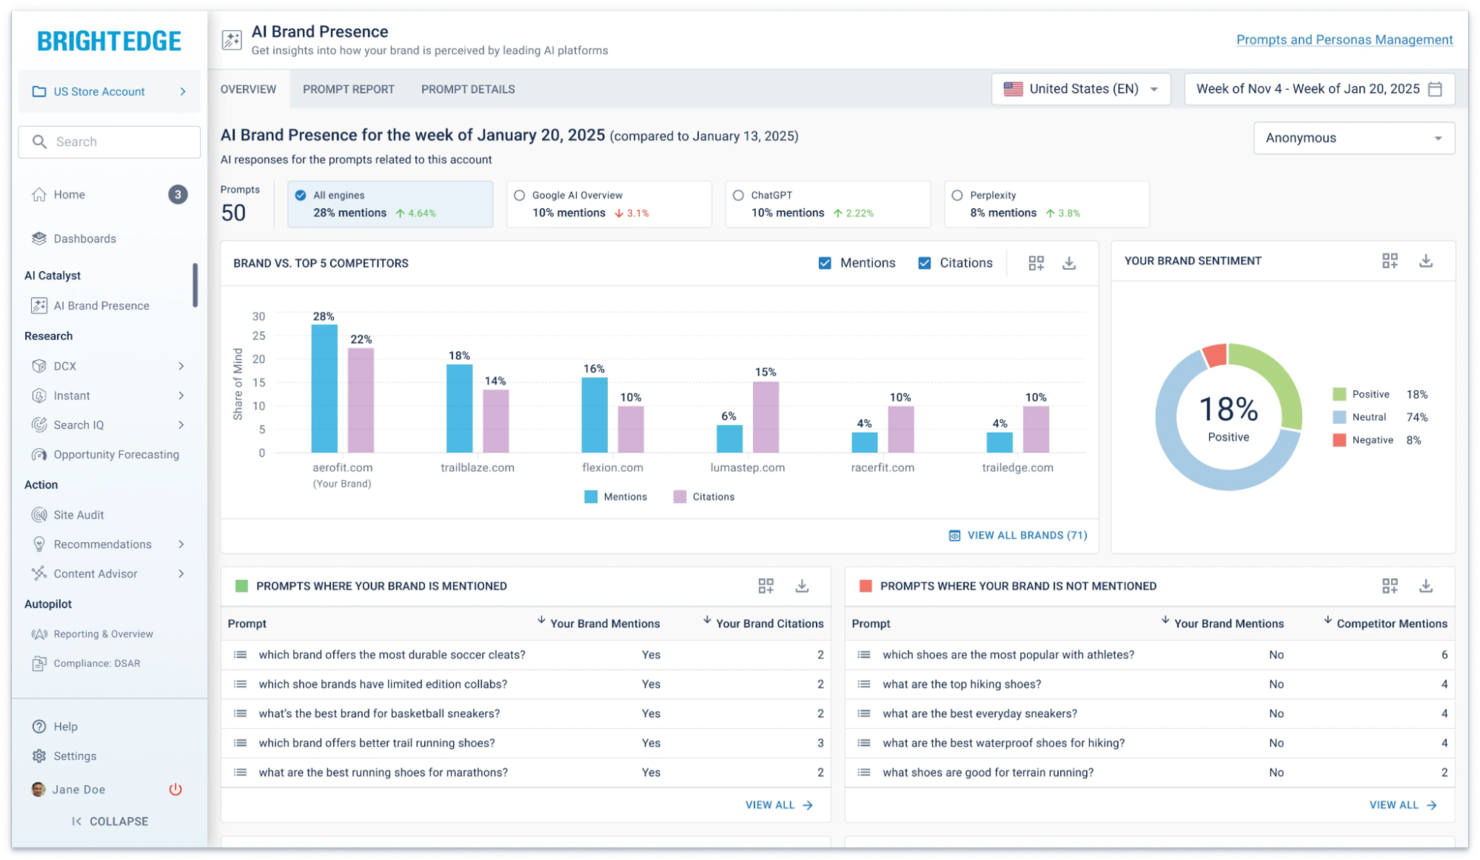
BrightEdge is designed for large organizations that need to track and optimize SEO performance at scale. Enterprise marketing teams and SEO professionals use it to monitor keyword rankings, analyze competitors, and measure the real business impact of organic search. Its focus on connecting SEO data directly to revenue and content performance makes it a strong fit for businesses where search visibility drives growth.
Why I Picked BrightEdge
BrightEdge stands out for its ability to track SEO performance at an enterprise level, which is essential for organizations managing large, complex websites. I picked it because it offers daily keyword tracking and competitive analysis tools that help you understand your position in search results across multiple markets. The platform’s Data Cube feature lets you analyze massive sets of search and content data, making it easier to connect SEO activities to business outcomes. For teams focused on tying organic search efforts directly to revenue and growth, BrightEdge delivers the depth and scale needed.
BrightEdge Key Features
Some other features make BrightEdge a strong choice for enterprise web analytics teams:
- Content Performance Tracking: Monitor how individual pages and content types perform in search and drive engagement.
- Site Audit Tools: Scan your website for technical SEO issues and receive prioritized recommendations for fixes.
- Opportunity Forecasting: Estimate the potential impact of SEO changes on traffic and revenue using built-in forecasting models.
- Automated Reporting: Set up scheduled, customizable reports to share SEO insights with stakeholders across your organization.
BrightEdge Integrations
Integrations include Google Analytics, Adobe Analytics, Google Search Console, Salesforce Marketing Cloud, Domo, OptimizelyOne, Adobe Marketing Cloud, and more.
Pros and Cons
Pros:
- Includes automated technical site audits
- Offers daily keyword and competitor updates
- Tracks SEO impact on actual revenue
Cons:
- Limited flexibility for custom dashboard layouts
- Requires annual contract commitment for access
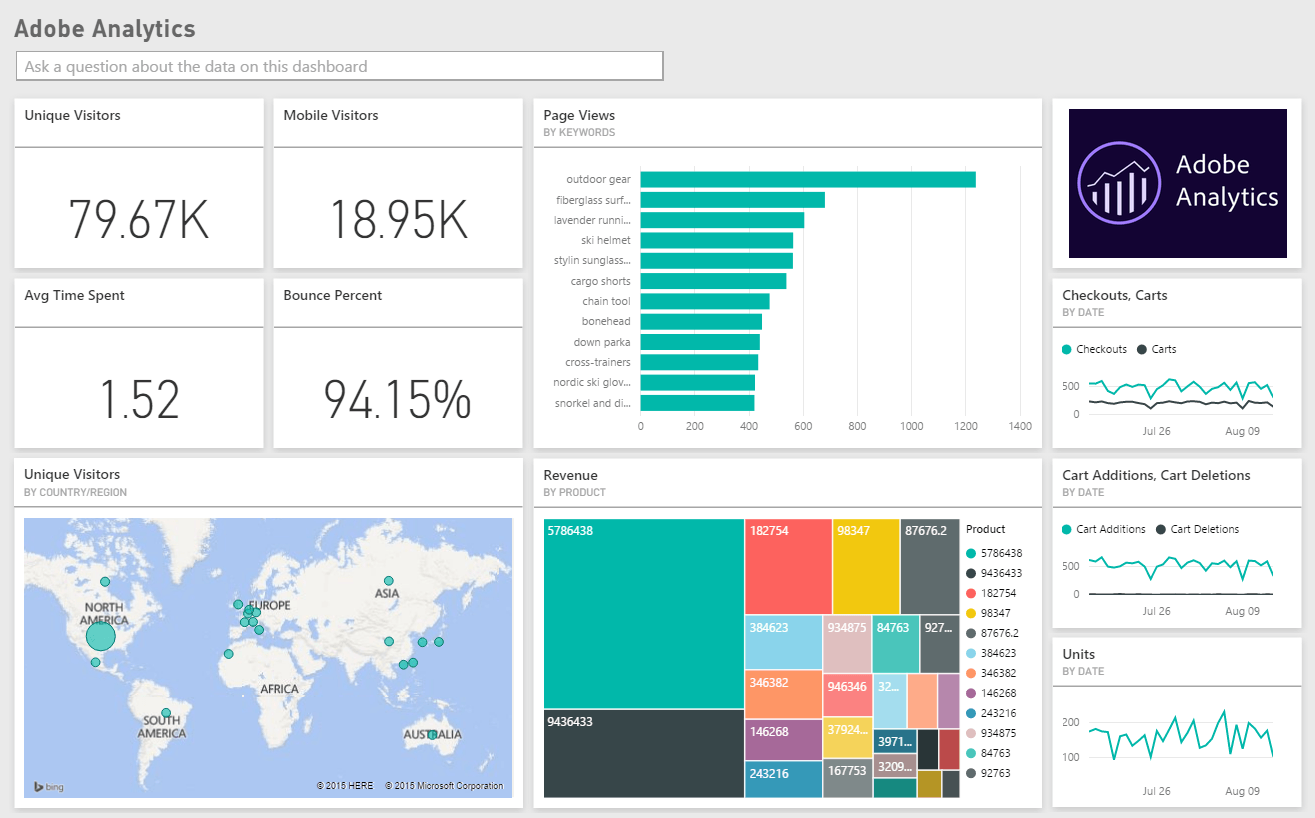
For marketing teams that need to understand how every channel contributes to conversions, Adobe Analytics offers advanced cross-channel attribution and deep data analysis. It’s designed for enterprise organizations and data-driven professionals who want to connect customer journeys across web, mobile, and offline touchpoints. The platform stands out for its ability to unify complex datasets and surface granular insights that drive strategic decisions.
Why I Picked Adobe Analytics
When you need to track and attribute user journeys across multiple channels, Adobe Analytics stands out for its advanced cross-channel attribution capabilities. I picked this tool because it lets you connect data from web, mobile, email, and even offline sources to build a unified view of customer behavior. The platform’s attribution modeling tools help you assign value to every touchpoint, so you can see exactly which channels drive conversions. For teams focused on optimizing multi-channel campaigns, Adobe Analytics offers the depth and flexibility needed to analyze complex customer paths.
Adobe Analytics Key Features
In addition to its attribution modeling, Adobe Analytics offers several other advanced capabilities:
- Real-Time Data Reporting: Access up-to-the-minute analytics dashboards for immediate performance monitoring.
- Custom Segmentation: Build and analyze audience segments using a wide range of behavioral and demographic criteria.
- Predictive Analytics: Use machine learning models to forecast trends and identify potential opportunities or risks.
- Data Visualization Tools: Create interactive reports and visualizations to share insights across your organization.
Adobe Analytics Integrations
Integrations include Adobe Experience Platform, Adobe Target, Adobe Campaign, Adobe Journey Optimizer, Adobe Real-Time CDP, and more.
Pros and Cons
Pros:
- Predictive analytics surfaces actionable trends
- Real-time dashboards update with live data
- Attribution models support complex customer journeys
Cons:
- Limited support for non-Adobe marketing plat
- Implementation requires technical expertise and planning

If you need to turn complex web data into clear, interactive dashboards, Looker Studio offers a flexible solution. This platform is especially useful for marketing teams and analysts who want to build custom reports that pull from multiple data sources. Its drag-and-drop interface and wide range of visualization options help you present analytics in a way that’s easy for stakeholders to understand.
Why I Picked Looker Studio
What sets Looker Studio apart for web analytics is its deep focus on customizable data visualization. I picked it because you can design dashboards that fit your exact reporting needs, using a wide range of chart types, filters, and calculated fields. The platform lets you blend data from multiple sources, so you can compare website metrics alongside campaign or sales data in one place. This level of flexibility is especially valuable if you need to present analytics to different stakeholders or tailor insights for specific business questions.
Looker Studio Key Features
Some other features make Looker Studio a versatile choice for web analytics teams:
- Scheduled Report Delivery: Set up automated email delivery of dashboards and reports to keep stakeholders updated on a regular basis.
- Data Source Connectors: Access a large library of built-in and partner connectors to pull data from platforms like Google Analytics, BigQuery, and SQL databases.
- Collaboration Tools: Invite team members to view or edit dashboards in real time, supporting shared analysis and feedback.
- Custom Branding: Apply your organization’s logo, colors, and design elements to dashboards for a consistent, professional look.
Looker Studio Integrations
Integrations include Google Analytics, Google Ads, BigQuery, Google Sheets, Google Search Console, YouTube Analytics, Google Campaign Manager 360, and more.
Pros and Cons
Pros:
- Supports real-time data visualization updates
- Offers highly customizable dashboard layouts
- Connects to a wide range of Google products
Cons:
- Some connectors require third-party add-ons
- Lacks built-in predictive analytics features

Screaming Frog stands out for digital marketers and SEO specialists who need deep technical insights into their websites. The tool’s site crawling engine uncovers broken links, duplicate content, and crawl issues that can impact search performance. If you’re looking to audit large or complex sites for technical SEO problems, Screaming Frog offers a level of detail and flexibility that’s hard to match.
Why I Picked Screaming Frog
For technical site crawling, Screaming Frog offers a level of depth that’s hard to find in other web analytics tools. The crawler scans every page, image, and resource on your site, surfacing issues like broken links, missing metadata, and redirect chains. I picked Screaming Frog because it gives you granular control over crawl parameters, so you can tailor audits to your site’s unique structure. If you need to diagnose technical SEO problems and ensure your site is search engine-friendly, this tool delivers the detail and flexibility required.
Screaming Frog Key Features
Some other features make Screaming Frog especially useful for technical web audits:
- XML Sitemap Generation: Create XML sitemaps directly from your site crawl data.
- Custom Extraction: Pull specific data from web pages using CSS Path, XPath, or regex.
- JavaScript Rendering: Crawl and analyze content loaded dynamically with JavaScript.
- Google Analytics Integration: Overlay crawl data with Google Analytics metrics for deeper analysis.
Screaming Frog Integrations
Native integrations are not currently listed.
Pros and Cons
Pros:
- Supports custom extraction with XPath or regex
- Finds orphan pages missed by other tools
- Crawls large sites without cloud limits
Cons:
- Requires desktop installation, not browser-based
- No built-in dashboards for ongoing monitoring

If your team is focused on growing visibility in Bing search results, Bing Webmaster Tools offers analytics and optimization features tailored for that channel. The platform gives digital marketers and SEO professionals direct access to Bing’s search performance data, crawl diagnostics, and indexing controls. For anyone managing sites where Bing traffic matters, this tool helps you identify and address issues that specifically impact Bing rankings.
Why I Picked Bing Webmaster Tools
When optimizing for Bing search, presence is a priority. Bing Webmaster Tools gives you direct access to the data and controls that matter most for this channel. The platform provides detailed reports on how your site performs in Bing search, including impressions, clicks, and keyword rankings. I picked Bing Webmaster Tools because it also offers site scanning and indexing management features that help you address issues unique to Bing’s algorithm. For marketers who want to maximize their reach on Bing, these analytics and diagnostic tools are essential.
Bing Webmaster Tools Key Features
Some other features make Bing Webmaster Tools valuable for web analytics and site management:
- Backlink Analysis: View detailed reports on inbound links pointing to your site.
- SEO Reports: Access automated SEO recommendations and issue detection.
- URL Inspection Tool: Check the indexing status and crawl information for specific URLs.
- Disavow Links Tool: Submit a list of links you want Bing to ignore for ranking purposes.
Bing Webmaster Tools Integrations
Integrations include WordPress and Microsoft Advertising. Native API access is also available for custom integrations.
Pros and Cons
Pros:
- URL inspection tool for Bing crawling
- Backlink data unique to Bing’s index
- Built-in malware and spam detection alerts
Cons:
- No support for multi-user team management
- Data focuses only on Bing search traffic
Altri Strumenti di Web Analytics
Ecco alcune ulteriori opzioni di strumenti di web analytics che non sono entrate nella mia selezione principale, ma che vale comunque la pena conoscere:
- MonsterInsights
For WordPress integration
- Neil Patel
For actionable SEO recommendations
- Chartbeat
For real-time editorial insights
- Plausible
For privacy-focused tracking


Criteri di Selezione degli Strumenti di Web Analytics
Nella selezione dei migliori strumenti di web analytics da includere in questo elenco, ho tenuto conto dei bisogni comuni degli acquirenti e delle difficoltà come il tracciamento del comportamento degli utenti su proprietà digitali e l’identificazione dei punti di frizione nel percorso dell’utente. Ho utilizzato inoltre il seguente framework per mantenere la valutazione strutturata ed equa:
Funzionalità Principali (25% del punteggio totale)
Per essere inclusa in questa lista, ogni soluzione doveva soddisfare questi casi d’uso comuni:
- Tracciare l’attività degli utenti su sito web e app
- Visualizzare metriche di traffico e coinvolgimento
- Segmentare il pubblico per comportamento o dati demografici
- Generare report e dashboard personalizzabili
- Monitorare eventi di conversione e funnel
Ulteriori Funzionalità Distintive (25% del punteggio totale)
Per restringere ulteriormente la scelta, ho valutato anche funzioni uniche, come:
- Rilevamento di anomalie in tempo reale
- Funzionalità di replay della sessione
- Raccolta dati senza etichette/tag o senza codice
- Mappatura avanzata dei percorsi utente
- Analisi predittiva e previsioni
Usabilità (10% del punteggio totale)
Per valutare l’usabilità di ciascun sistema, ho considerato quanto segue:
- Navigazione intuitiva del cruscotto
- Visualizzazioni dei dati chiare
- Requisiti minimi di configurazione
- Prestazioni dell'interfaccia reattive
- Struttura logica di menu e flussi di lavoro
Onboarding (10% del punteggio totale)
Per valutare l’esperienza di onboarding di ciascuna piattaforma, ho considerato i seguenti aspetti:
- Tour guidati passo-passo del prodotto
- Accesso a video formativi e documentazione
- Disponibilità di webinar introduttivi
- Modelli predefiniti per report comuni
- Chat in-app o supporto guidato alla configurazione
Assistenza clienti (10% del punteggio totale)
Per valutare i servizi di assistenza clienti di ciascun fornitore di software, ho preso in considerazione i seguenti aspetti:
- Disponibilità di supporto tramite chat dal vivo o telefono
- Tempo di risposta alle richieste di assistenza
- Accesso a un help center ricercabile
- Forum della community o gruppi di utenti
- Contatti proattivi dai team di successo clienti
Rapporto qualità-prezzo (10% del punteggio totale)
Per valutare il rapporto qualità-prezzo di ciascuna piattaforma, ho considerato i seguenti aspetti:
- Fasce di prezzo trasparenti e flessibili
- Funzionalità incluse per ogni fascia di prezzo
- Disponibilità di prova gratuita o demo
- Nessun costo nascosto o addebiti a sorpresa
- Sconti per impegni annuali o di volume
Recensioni dei clienti (10% del punteggio totale)
Per avere un’idea generale della soddisfazione dei clienti, ho preso in considerazione i seguenti aspetti leggendo le recensioni:
- Feedback positivo sull’accuratezza dei dati
- Segnalazioni di affidabilità e disponibilità della piattaforma
- Soddisfazione per l’assistenza clienti
- Facilità d’integrazione con altri strumenti
- ROI percepito e impatto sul business
Come scegliere gli strumenti di web analytics
È facile perdersi tra lunghe liste di funzionalità e strutture di prezzi complesse. Per aiutarti a restare concentrato durante il tuo processo di selezione del software, ecco un elenco di fattori da tenere a mente:
| Fattore | Cosa Considerare |
| Scalabilità | Lo strumento gestirà i tuoi attuali e futuri volumi di traffico senza costi extra o rallentamenti? |
| Integrazioni | Lo strumento si collega nativamente con strumenti CRM, automazione marketing, A/B testing e data warehouse? |
| Personalizzazione | È possibile adattare dashboard, report e raccolta dati agli specifici KPI e flussi di lavoro del tuo team? |
| Facilità d’uso | Il tuo team avrà bisogno di una formazione approfondita, o la maggior parte degli utenti otterrà valore con un onboarding minimo? |
| Implementazione e onboarding | Quanto tempo ci vorrà per la messa in opera e quali risorse interne o competenze tecniche saranno necessarie per iniziare? |
| Costo | Ci sono costi nascosti per archiviazione dati, licenze utente o supporto premium? Il prezzo cresce con l’utilizzo? |
| Sicurezza | Lo strumento offre crittografia dei dati, controlli di accesso utente e conformità a regolamenti sulla privacy come il GDPR? |
| Disponibilità del supporto | Quali canali di assistenza sono offerti? Sono disponibili durante l’orario lavorativo o solo in alcune regioni? |
Cosa sono gli strumenti di web analytics?
Gli strumenti di web analytics sono piattaforme software che tracciano, misurano e riportano le interazioni degli utenti su siti web e proprietà digitali. Questi strumenti di analisi dei siti aiutano i team marketing a comprendere il comportamento dei visitatori, monitorare le fonti di traffico e analizzare i percorsi di conversione. Offrendo dati azionabili su percorso utente, frequenza di rimbalzo e coinvolgimento, supportano decisioni basate sui dati che migliorano le strategie di marketing, ottimizzano le performance del sito e aumentano l’esperienza utente generale.
Molte piattaforme funzionano come soluzioni di analytics tutto-in-uno, combinando analisi di prodotto con il tracciamento tradizionale e offrendo opzioni come il deployment open source o self-hosted per un maggior controllo. Questi strumenti sono ampiamente utilizzati da startup e team in crescita che desiderano arricchire gli insight, incluse soluzioni come open web analytics per un tracciamento flessibile e personalizzabile.
Funzionalità degli strumenti di web analytics
Quando scegli strumenti di web analytics, presta attenzione alle seguenti funzionalità chiave:
- Tracciamento delle fonti di traffico: Identifica da dove provengono i visitatori del tuo sito web, come motori di ricerca, social media o siti di riferimento, così puoi misurare l'efficacia dei diversi canali di marketing.
- Segmentazione degli utenti: Raggruppa i visitatori in base a caratteristiche come posizione, dispositivo o comportamento, consentendoti di analizzare segmenti specifici di pubblico e adattare le tue strategie di conseguenza.
- Analisi del funnel di conversione: Mappa i passaggi effettuati dagli utenti verso il completamento di un obiettivo, come un acquisto o una registrazione, aiutandoti a individuare dove avvengono gli abbandoni e ottimizzare il percorso utente.
- Tracciamento degli eventi: Monitora azioni specifiche sul tuo sito, come clic su pulsanti, download o riproduzione video, per misurare il coinvolgimento con elementi chiave.
- Replay della sessione: Registra e riproduce le sessioni individuali degli utenti, offrendoti una visione visiva di come i visitatori interagiscono con il sito e dove incontrano problemi.
- Dashboard personalizzabili: Ti permette di creare e modificare dashboard per visualizzare le metriche e i report più rilevanti per il tuo team, supportando analisi e rendicontazione mirate.
- Reportistica in tempo reale: Fornisce dati aggiornati al minuto sull'attività degli utenti, consentendoti di rispondere rapidamente a picchi di traffico, lanci di campagne o problemi tecnici.
- Monitoraggio di obiettivi e conversioni: Ti consente di impostare e monitorare obiettivi di business specifici, come invii di moduli o vendite, per misurare il successo delle iniziative digitali.
- Tracciamento multi-dispositivo: Segue gli utenti su diversi dispositivi e sessioni, offrendoti una visione completa del customer journey da mobile a desktop.
- Esportazione e integrazione dei dati: Permette di esportare i dati delle analitiche o collegarsi con altri strumenti, come piattaforme CRM o di business intelligence, per analisi e reportistica più approfonditi.
Funzionalità AI Comuni degli Strumenti di Web Analytics
Oltre alle funzionalità standard degli strumenti di web analytics elencate sopra, molte di queste soluzioni stanno integrando l'AI con funzionalità come:
- Rilevamento di anomalie: Utilizza algoritmi di AI per identificare automaticamente modelli insoliti o cambiamenti improvvisi nel comportamento degli utenti, avvisando i team su potenziali problemi o opportunità senza monitoraggio manuale.
- Analisi predittiva: Sfrutta l'apprendimento automatico per prevedere tendenze future, come picchi di traffico o tassi di conversione, aiutando i team a pianificare le campagne e allocare risorse in modo più efficace.
- Insight automatizzati: Analizza grandi volumi di dati per mettere in evidenza risultati chiave, tendenze o anomalie, riducendo il tempo speso nell'analisi manuale e sottolineando ciò che conta di più per le decisioni.
- Analisi dell'intento dell'utente: Applica elaborazione del linguaggio naturale e modelli comportamentali per dedurre gli obiettivi e le motivazioni dietro le azioni degli utenti, consentendo un'ottimizzazione più mirata di contenuti ed esperienze.
- Predizione dell'abbandono: Identifica gli utenti che potrebbero disimpegnarsi o abbandonare un processo, permettendo ai team di intervenire con messaggi o offerte personalizzate per trattenere visitatori di valore.
Vantaggi degli Strumenti di Web Analytics
L'implementazione di strumenti di web analytics offre diversi vantaggi per il tuo team e la tua azienda. Eccone alcuni a cui puoi guardare con interesse:
- Comprensione più approfondita dei clienti: Accedi a dati dettagliati su comportamento, percorsi e coinvolgimento degli utenti per informare il targeting del pubblico e la strategia dei contenuti.
- Miglioramento dei tassi di conversione: Identifica e risolvi i punti di attrito nei funnel utilizzando funzionalità come replay della sessione e analisi delle conversioni.
- Decisioni più rapide: Sfrutta dashboard in tempo reale e insight automatizzati per rispondere velocemente alle performance delle campagne e ai problemi del sito.
- Ottimizzazione della spesa di marketing: Traccia le fonti di traffico e l'attribuzione delle campagne per allocare il budget ai canali più efficaci.
- Collaborazione migliorata: Condividi dashboard e report personalizzabili tra i team per allinearsi su obiettivi e metriche di performance.
- Rilevamento proattivo dei problemi: Utilizza il rilevamento delle anomalie basato su AI per individuare e risolvere i problemi prima che impattino l'esperienza utente.
- Strategia guidata dai dati: Integra l'analitica con altri strumenti aziendali per supportare una pianificazione e reportistica completa e basata sui dati.
Costi e Prezzi degli Strumenti di Web Analytics
La scelta degli strumenti di web analytics richiede la comprensione dei diversi modelli e piani tariffari disponibili. I costi variano in base alle funzionalità, alla dimensione del team, alle aggiunte opzionali e altro ancora. La tabella seguente riassume i piani più comuni, i prezzi medi e le caratteristiche tipiche incluse nelle soluzioni di web analytics:
Tabella Comparativa dei Piani per gli Strumenti di Web Analytics
| Tipo di piano | Prezzo medio | Funzionalità comuni |
| Piano gratuito | $0 | Monitoraggio di base del traffico, dashboard limitati, conservazione dei dati ristretta e supporto tramite community. |
| Piano personale | $20-$125/mese | Report standard, segmentazione degli utenti, monitoraggio eventi, supporto email e integrazioni limitate. |
| Piano business | $200-$500/mese | Analitiche avanzate, dashboard personalizzabili, funnel di conversione, accesso multiutente e supporto prioritario. |
| Piano enterprise | $500-$2000/mese | Conservazione illimitata dei dati, account manager dedicato, sicurezza avanzata, integrazioni personalizzate e supporto con SLA. |
FAQ sugli strumenti di web analytics
Ecco alcune risposte alle domande più frequenti sugli strumenti di web analytics:
Come gestiscono gli strumenti di web analytics la privacy degli utenti e la conformità ai dati?
La maggior parte degli strumenti di web analytics offre funzionalità come l’anonimizzazione degli IP, la gestione del consenso ai cookie e il controllo sulla conservazione dei dati per aiutarti a rispettare le normative sulla privacy come il GDPR e il CCPA. Verifica sempre le impostazioni della privacy di ciascuno strumento e assicurati che siano in linea con i requisiti di conformità della tua organizzazione.
Gli strumenti di web analytics possono tracciare gli utenti su più dispositivi e sessioni?
Sì, molti strumenti di web analytics utilizzano identificatori unici o metodi di tracciamento cross-device per seguire gli utenti mentre si spostano tra dispositivi e sessioni. Questo aiuta a costruire un quadro più completo del percorso cliente e a capire come gli utenti interagiscono con il tuo brand nel tempo.
Qual è la differenza tra le analisi in tempo reale e quelle storiche in questi strumenti?
Le analisi in tempo reale mostrano cosa sta succedendo sul tuo sito in questo momento, come gli utenti attivi o gli eventi live, mentre le analisi storiche ti permettono di analizzare tendenze e pattern su giorni, settimane o mesi. Entrambe sono importanti per monitorare le campagne e prendere decisioni basate sui dati.
Quanto è difficile integrare gli strumenti di web analytics con altre piattaforme di marketing?
La maggior parte degli strumenti di web analytics offre integrazioni predefinite o API per collegarsi a CRM, email, piattaforme pubblicitarie e data warehouse. La complessità dipende dal tuo stack tecnologico e dalle esigenze di dati, ma molti strumenti forniscono guide passo passo o supporto dedicato per la configurazione.
Cosa posso fare se i miei dati di web analytics sembrano inaccurati o incompleti?
Inizia verificando l’implementazione del codice di tracciamento, le impostazioni del tag manager e qualsiasi filtro o esclusione nel tuo strumento di analytics. I dati inaccurati spesso derivano da tag mancanti, tracciamenti duplicati o obiettivi mal configurati. La maggior parte dei fornitori offre risorse di troubleshooting o supporto per aiutare a risolvere questi problemi.
Cosa fare dopo:
Se stai cercando strumenti di web analytics, contatta gratuitamente un consulente SoftwareSelect per ricevere consigli personalizzati.
Compila un modulo e fai una breve chiamata durante la quale ti verranno chiesti i dettagli delle tue esigenze. Poi riceverai una selezione di software da valutare. Sarai accompagnato anche in tutto il processo d'acquisto, comprese eventuali negoziazioni di prezzo.