

The best Whatagraph alternatives unify your marketing, sales, and financial data and automate multi-source reporting—giving you the flexibility and control you need when Whatagraph’s setup falls short. If you’re searching for Whatagraph alternatives, you probably need broader integrations, deeper report customization, or client dashboard features scaled for agencies or in-house teams.
This guide cuts through the noise by mapping out top-rated analytics platforms and reporting tools that make it easier to blend data, automate recurring reports, and surface insights for campaign attribution and optimization. You’ll find options that scale with your tech stack and respond to the complex realities of performance marketing right now.
What Is Whatagraph?
Whatagraph is a marketing analytics and reporting platform that lets you combine data from multiple channels into automated reports. You can pull data from ad platforms, web analytics, CRM systems, and more to create custom dashboards or scheduled reports for clients and stakeholders.
Whatagraph is built for agencies and marketing teams that need to unify fragmented campaign data, visualize performance, and automate recurring reporting tasks without relying on manual spreadsheet work.
Why Trust Our Software Recommendations
6,700+
Reviews
20
Industry experts
16+
Evaluation factors
14
Years
Our team has been testing and reviewing software since 2012. As marketing leaders ourselves, we know how difficult—and important—it is to choose the right software.
For this guide, we evaluated tools using hands-on testing and independent research, scoring tools using our selection criteria.
Our reviews reflect our human editorial judgment, not a sales pitch.
Expert reviewers:
 Gui DrusinaCreative Director
- Shriya GhateSenior Marketing Lead
 Amanda JacquesMarketing Ops Leader

Whatagraph Alternatives Comparison Table
Compare pricing and specs, side by side, for the Whatagraph alternatives that made it onto my shortlist.
| Tool | Best For | Trial Info | Price | ||
|---|---|---|---|---|---|
| 1 | Best for formula-driven, cross-source dashboards | 14-day free trial | From $120/month (billed annually) | Website | |
| 2 | Best for structuring data for analytics tools | Free demo available | Pricing upon request | Website | |
| 3 | Best for combining client reporting and invoicing | 14-day free trial available | From $75/month | Website | |
| 4 | Best for syncing ad data to BI tools and warehouses | 14-day free trial | From $44/month | Website | |
| 5 | Best for enterprise performance management | Free demo available | Pricing upon request | Website | |
| 6 | Best for agency client reporting at scale | 14-day free trial | From $20/month (billed annually) | Website | |
| 7 | Best for tracking goals alongside multi-source reports | Free plan + 14-day free trial + free demo available | From $71/month (billed annually) | Website | |
| 8 | Best for enterprise BI and data visualization | 30-day free trial | Pricing upon request | Website | |
| 9 | Best for automating agency marketing operations | Free demo available | Pricing upon request | Website | |
| 10 | Best for end-to-end data warehouse management | Free trial + free demo available | From $265/month (billed annually) | Website |


Whatagraph Alternatives Reviews
Below are my detailed summaries of the best Whatagraph alternatives that made it onto my shortlist. My reviews offer a detailed look at the features, capabilities, and integrations of each platform to help you find the best one for you.
 Best for formula-driven, cross-source dashboards
- 14-day free trial
- From $120/month (billed annually)
Visit WebsiteCustomer Rating:4.7/5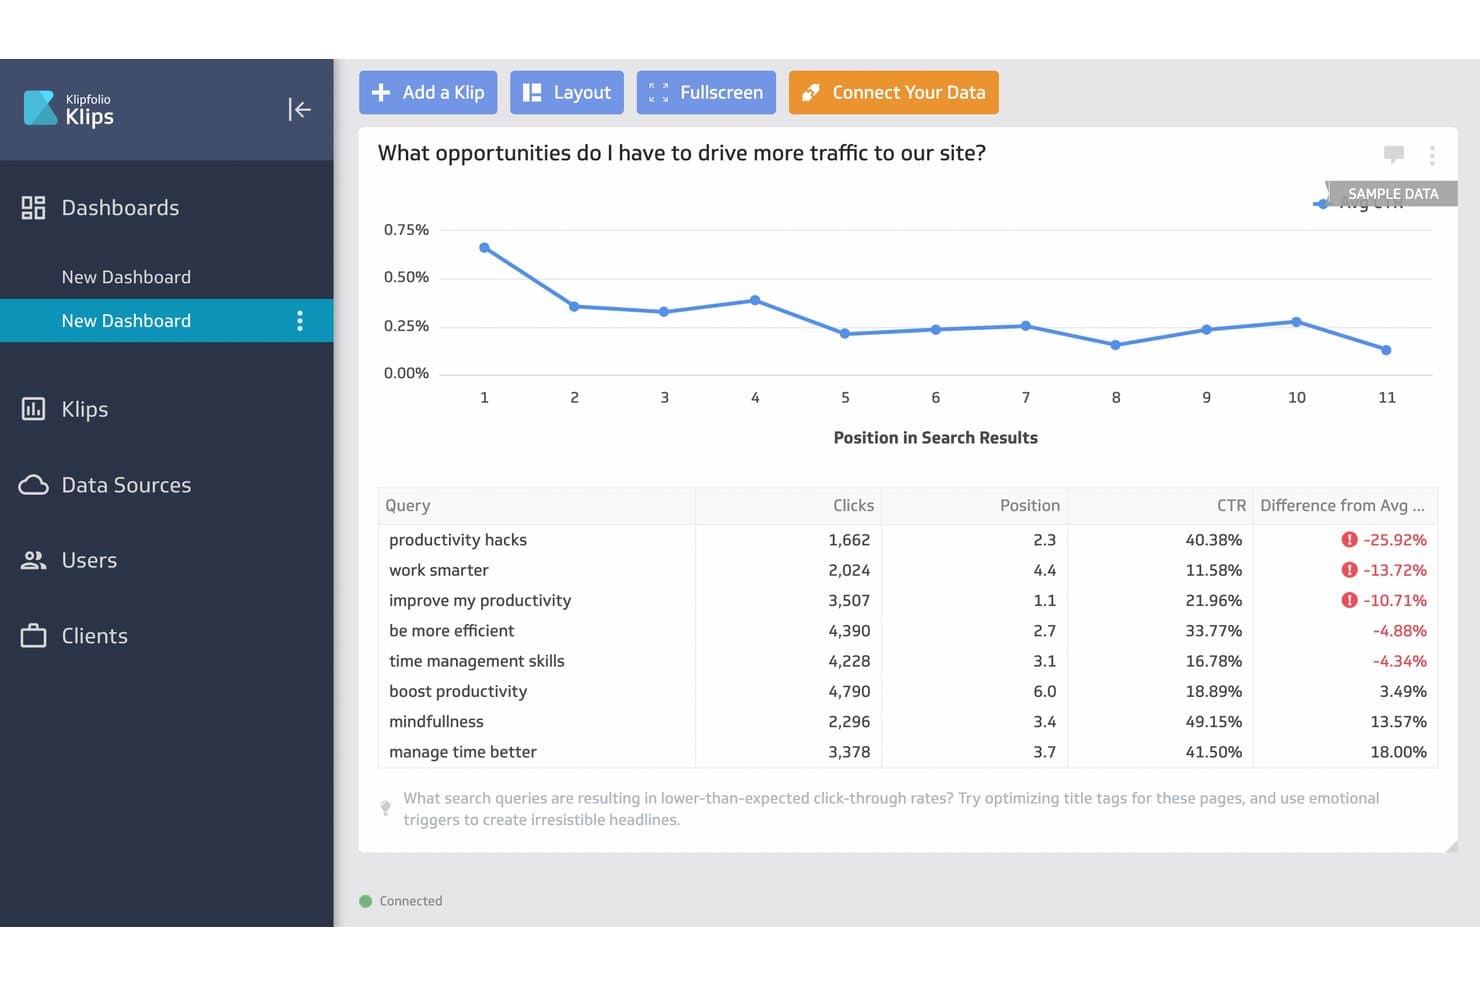
Klipfolio surfaces low-CTR queries to help users improve search traffic. Klipfolio is a cloud-based analytics platform for marketers who need to build custom dashboards using data from multiple sources, making it easier to track KPIs and campaign results in one place.
Who Is Klipfolio Best For?
Klipfolio is a strong fit for marketing teams and agencies that need to consolidate data from multiple channels into interactive dashboards.
Why Klipfolio Is a Good Whatagraph Alternative
I picked Klipfolio as a standout alternative because I can build custom dashboards using formulas across multiple data sources, not just blend preset metrics. In practice, this helps my team track cross-channel KPIs and tailor visualizations to match even the most complex marketing reporting needs.
Klipfolio Key Features
- Pre-built data connectors: Connect to hundreds of marketing and analytics platforms without custom development.
- Scheduled data refresh: Set automatic intervals for data updates so dashboards stay current.
- Custom user roles and permissions: Control who can edit, view, or share dashboards within your workspace.
- White label options: Brand dashboards and reports with your own logo and colours for client-facing use.
Klipfolio Integrations
Klipfolio offers 100+ native integrations, including Google Analytics, Facebook Ads, HubSpot, Salesforce, Google Sheets, Slack, SQL databases, Dropbox, Shopify, Xero, and QuickBooks, with an API available for custom integrations. It also connects with Zapier.
Pros and Cons
Pros:
- Connects unstructured data sources
- Offers dynamic data filtering
- Lets you write formulas for custom KPIs
Cons:
- Limits cross-channel blending
- No templates for ready-to-use reports
Learn more about Klipfolio: Best for structuring data for analytics tools
- Free demo available
- Pricing upon request
Visit WebsiteCustomer Rating:4.5/5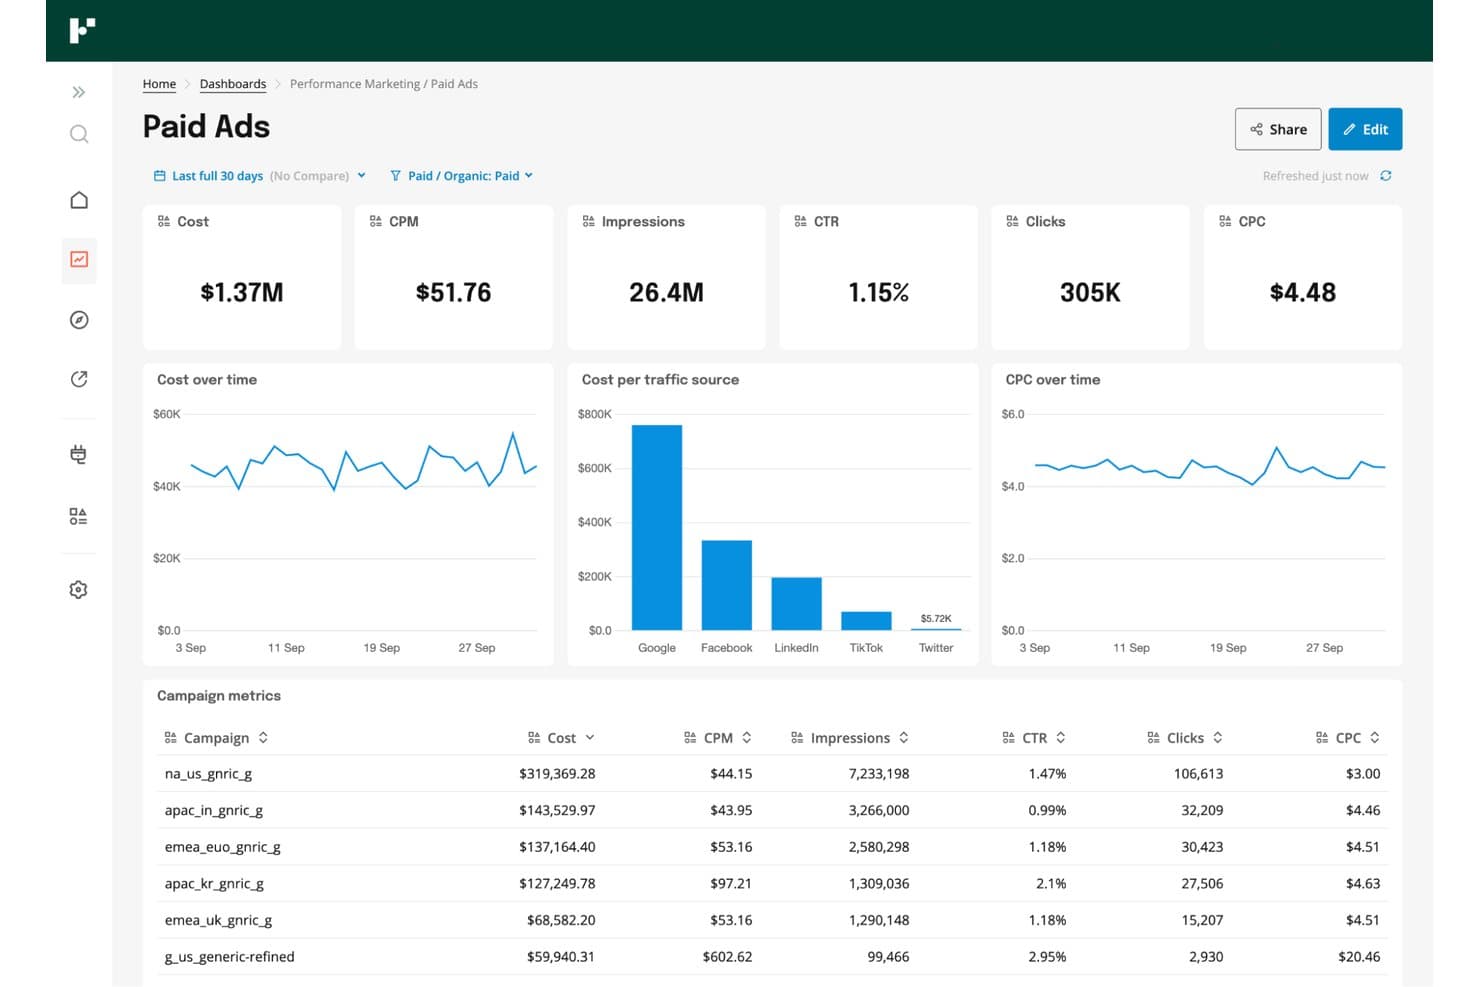
Funnel centralizes paid ads metrics across channels in one dashboard. Funnel is a data integration platform designed for marketers and analytics teams who need to connect, centralize, and prepare marketing data from multiple sources to support better reporting, campaign optimization, and spend analysis across all channels.
Who Is Funnel Best For?
Funnel is a solid choice for marketing teams and analytics professionals at mid-sized to large companies who need to centralize and prep data from multiple channels.
Why Funnel Is a Good Whatagraph Alternative
I like Funnel because my team can centralize and organize marketing data from dozens of sources in one place without manual prep. Funnel’s data transformation and normalization tools let us structure spend and campaign data consistently for analytics platforms, making cross-channel analysis much faster and far more reliable.
Funnel Key Features
- Data connectors: Connect to hundreds of advertising, analytics, and CRM platforms without custom development.
- Scheduled data refresh: Set automatic data import schedules to keep marketing dashboards current and accurate.
- Multi-destination exports: Send prepared data to tools like Google Data Studio, Tableau, Snowflake, and spreadsheets.
- Access management: Control user permissions and manage data access for teams and individual users.
Funnel Integrations
Funnel offers native integrations with platforms like Google Analytics, Google Ads, Facebook Ads, HubSpot, Salesforce, Amazon Ads, LinkedIn Ads, TikTok Ads, Twitter Ads, and Snowflake. An API is available for custom integrations.
Pros and Cons
Pros:
- Granular user permissions for team data governance
- Prepares channel data for analytics tool exports
- Automates data normalization across multiple ad platforms
Cons:
- Does not include built-in visualization tools
- Manual setup can be time-intensive
Learn more about Funnel: Best for combining client reporting and invoicing
- 14-day free trial available
- From $75/month
Visit WebsiteCustomer Rating:4.5/5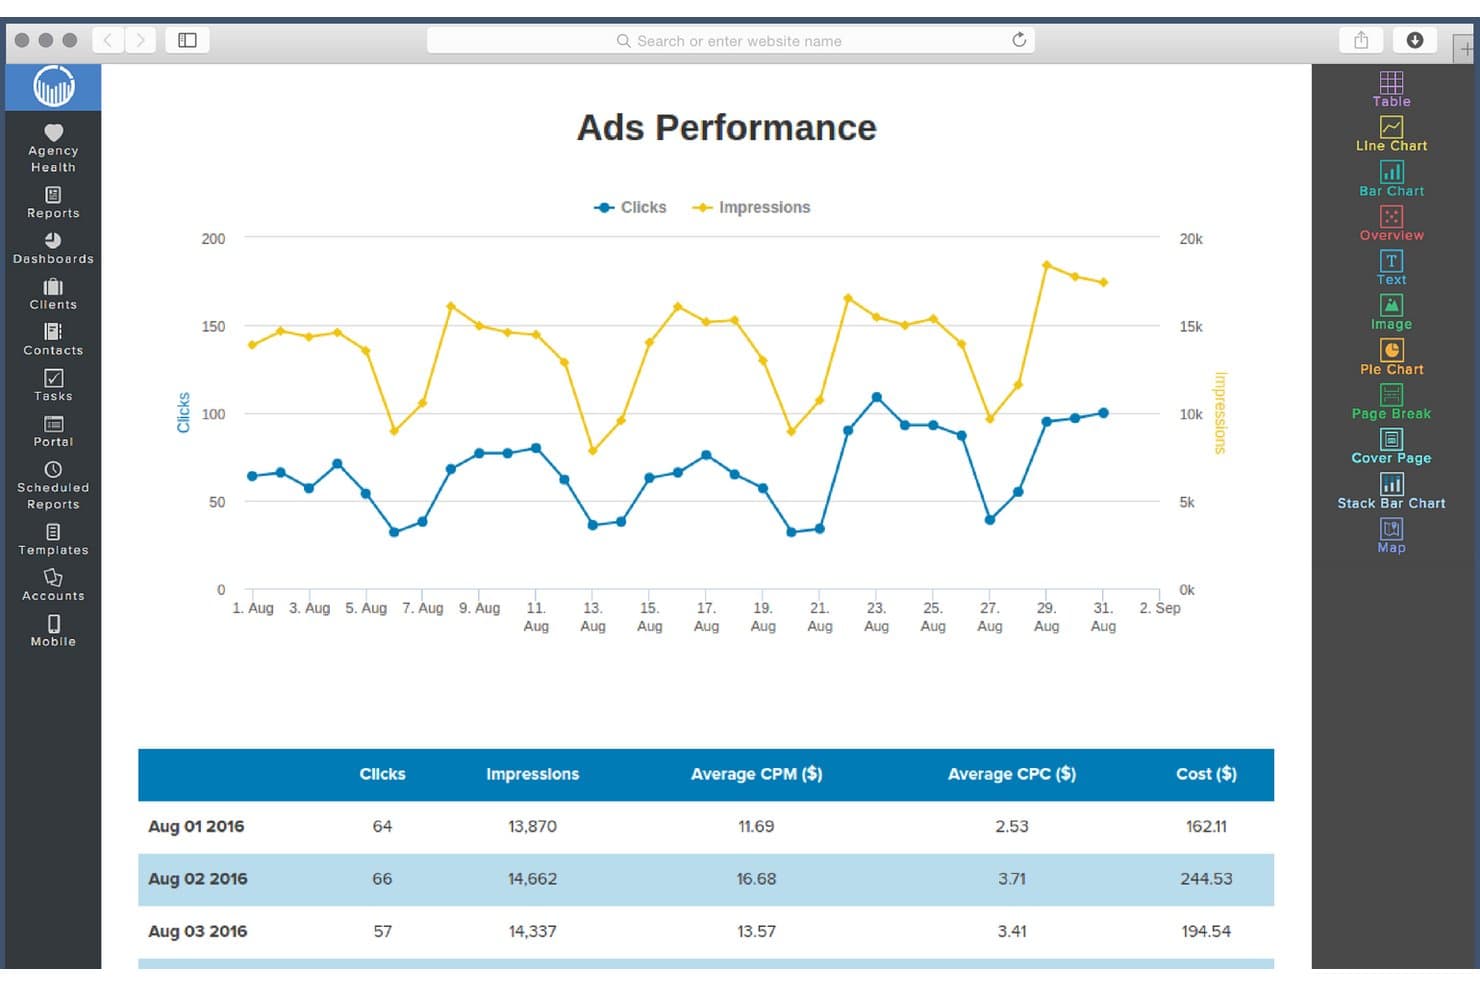
ReportGarden tracks ads clicks and impressions via interactive line charts. ReportGarden gives marketing agencies and freelancers tools for managing analytics, automating client reporting, and connecting ad accounts, helping you centralize campaign data and enhance client transparency in one place.
Who Is ReportGarden Best For?
ReportGarden is a good fit for marketing agencies and freelancers who need to centralize client analytics, reporting, and invoicing in one platform.
Why ReportGarden Is a Good Whatagraph Alternative
I picked ReportGarden as one of my top Whatagraph alternatives because I can blend client reporting with invoicing in one workspace. My team uses its analytics dashboards to connect multiple ad accounts for live performance data, and we automate both report delivery and invoicing workflows for tighter campaign management.
ReportGarden Key Features
- White-label dashboards: Present data on fully branded dashboards for each client account.
- Custom report templates: Create reusable templates tailored to your reporting needs across different clients or campaigns.
- Ad platform integrations: Connect ad accounts from Google Ads, Facebook Ads, Bing, and other major platforms for unified analytics.
- Automated report scheduling: Set automated delivery schedules so recurring reports go out to clients without manual intervention.
ReportGarden Integrations
ReportGarden offers native integrations with Google Ads, Facebook Ads, Bing Ads, Twitter Ads, LinkedIn Ads, Google Analytics, and Mailchimp. An API is available for custom integrations.
Pros and Cons
Pros:
- White-label dashboards for client branding
- Offers reusable custom report templates
- Combines client reporting and invoicing workflows
Cons:
- Limited options for non-ad platform analytics
- Lacks predictive analytics capabilities
Learn more about ReportGarden: Best for syncing ad data to BI tools and warehouses
- 14-day free trial
- From $44/month
Visit WebsiteCustomer Rating:4.4/5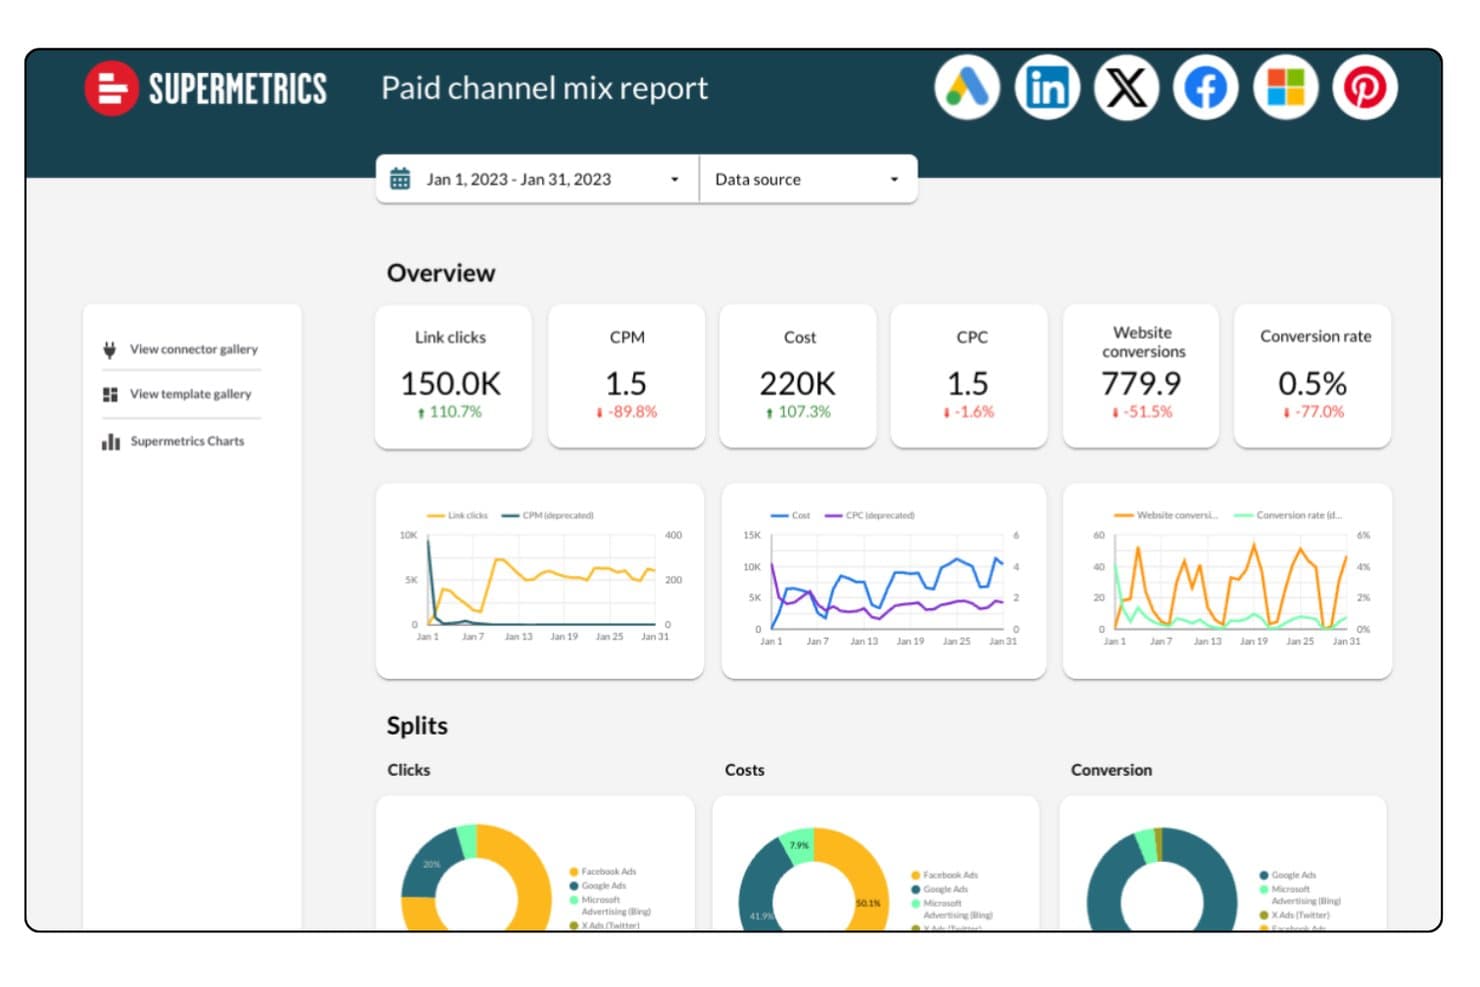
Supermetrics unifies paid channel data across platforms in one report. Supermetrics is a marketing data automation platform built for marketing and analytics teams who need to centralize ad and analytics data from dozens of sources into their existing BI tools, spreadsheets, and data warehouses.
Who Is Supermetrics Best For?
Supermetrics is a solid choice for marketing and analytics teams at mid-sized to large companies who need to centralize data from multiple ad platforms into their existing reporting tools.
Why Supermetrics Is a Good Whatagraph Alternative
I rate Supermetrics highly because my team can easily move ad and analytics data from dozens of sources into our reporting warehouse without manual exports. I like that Supermetrics centralizes channel data feeds, then pipes them directly into BI tools and spreadsheets, letting us build automated dashboards and granular performance models at scale.
Supermetrics Key Features
- Pre-built data connectors: Access a wide range of connectors for ad platforms, analytics services, and social channels.
- Custom query builder: Select and filter exactly what data you want to pull from each source.
- Scheduled data transfers: Automate regular data syncs to keep reports up to date without manual intervention.
- Data transformation tools: Clean, map, and modify data within Supermetrics before sending it to your warehouse or dashboard.
Supermetrics Integrations
Supermetrics offers native integrations with platforms like Google Sheets, Microsoft Excel, Looker Studio, BigQuery, Snowflake, Amazon Redshift, Azure Synapse, Google Analytics, Facebook Ads, Instagram Insights, and HubSpot. An API is available for custom integrations.
Pros and Cons
Pros:
- Custom queries pull only needed data
- Scheduled transfers automate regular report updates
- Data connectors cover dozens of ad platforms
Cons:
- Data sampling issues with very large queries
- Limited custom script additions
Learn more about Supermetrics: Best for enterprise performance management
- Free demo available
- Pricing upon request
Visit WebsiteCustomer Rating:4.2/5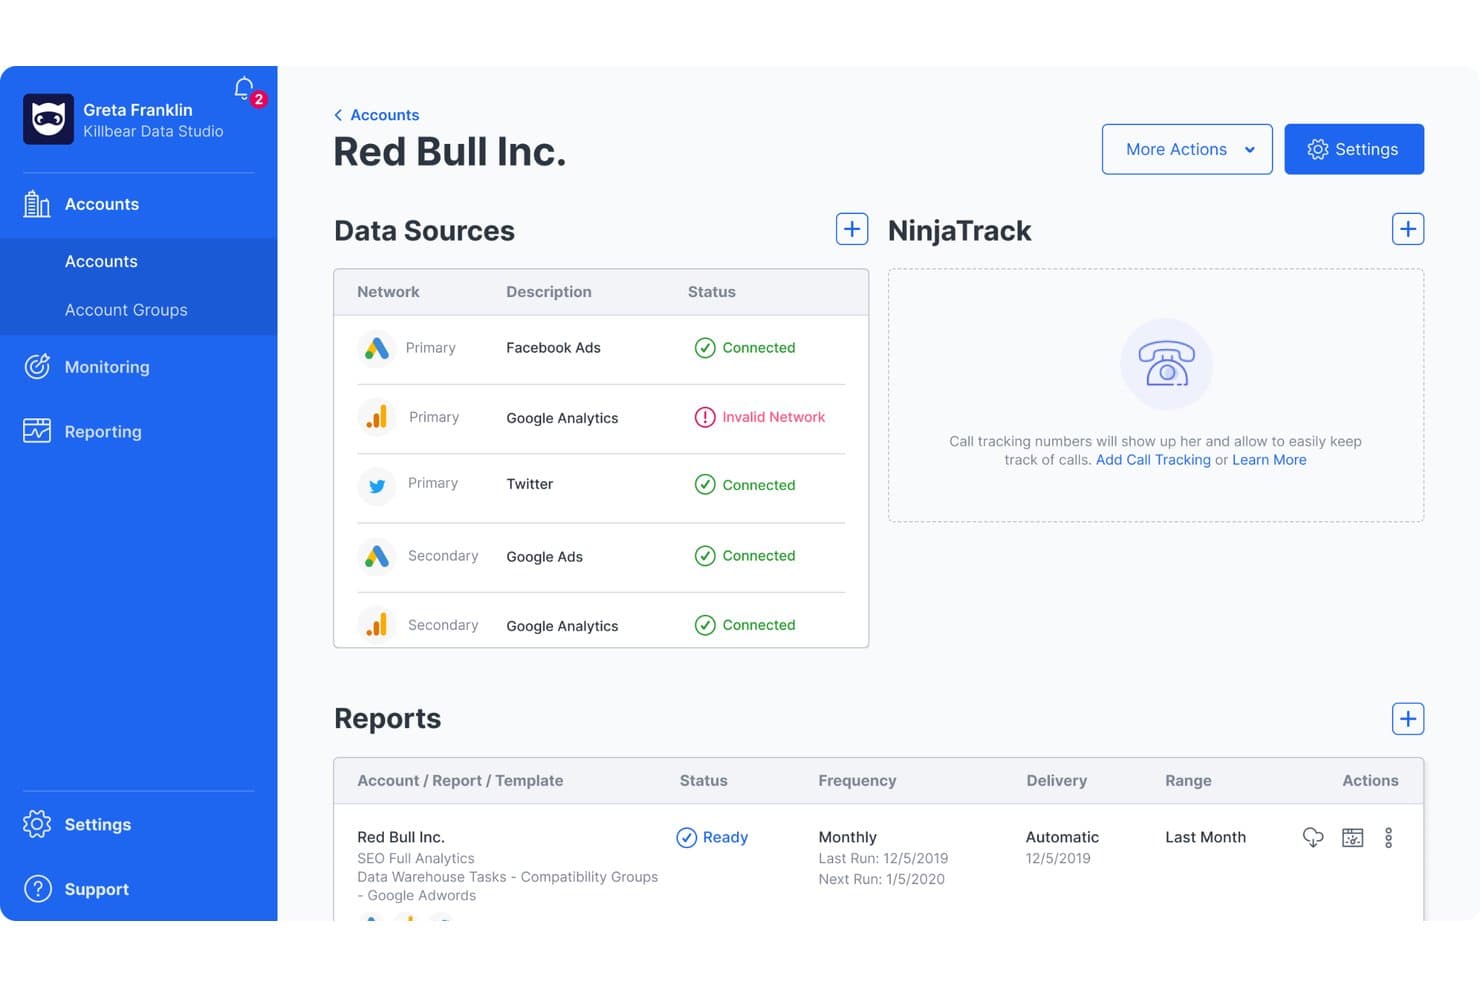
NinjaCat centralizes multi-source ad and analytics data in one account view. NinjaCat is a marketing analytics platform designed for agencies and enterprises that need to unify campaign data, automate client reporting, and manage multi-channel performance from one place.
Who Is NinjaCat Best For?
NinjaCat is a good fit for marketing teams at agencies and large enterprises that need to manage complex, multi-channel reporting and analytics.
Why NinjaCat Is a Good Whatagraph Alternative
I picked NinjaCat as one of the best options because it centralizes multi-channel campaign data, letting my team automate complex client reporting at scale. The platform's focus on enterprise performance management means I can handle large, segmented datasets for agencies and brands needing unified analytics. I use its dashboards and customizable reporting to track granular KPIs across all our digital channels.
NinjaCat Key Features
- White-label reporting: Customize reports with your agency or client branding.
- Multi-source data connectors: Pull data from search, social, and ad platforms into one dashboard.
- Scheduled automated reports: Set up recurring report delivery to clients or stakeholders.
- Call tracking integration: Link inbound call data with campaign analytics for attribution.
NinjaCat Integrations
NinjaCat offers native integrations with Google Ads, Facebook Ads, Google Analytics, Microsoft Advertising, LinkedIn Ads, CallRail, CallTrackingMetrics, Google Sheets, Facebook Insights, Google Search Console, and an API for custom integrations.
Pros and Cons
Pros:
- Merges paid, organic, and offline channels
- Supports custom, white-labeled enterprise dashboards
- Handles high-volume, multi-brand reporting needs
Cons:
- Delays with report template updates and changes
- Requires onboarding to fully configure reports
Learn more about NinjaCat: Best for agency client reporting at scale
- 14-day free trial
- From $20/month (billed annually)
Visit WebsiteCustomer Rating:4.7/5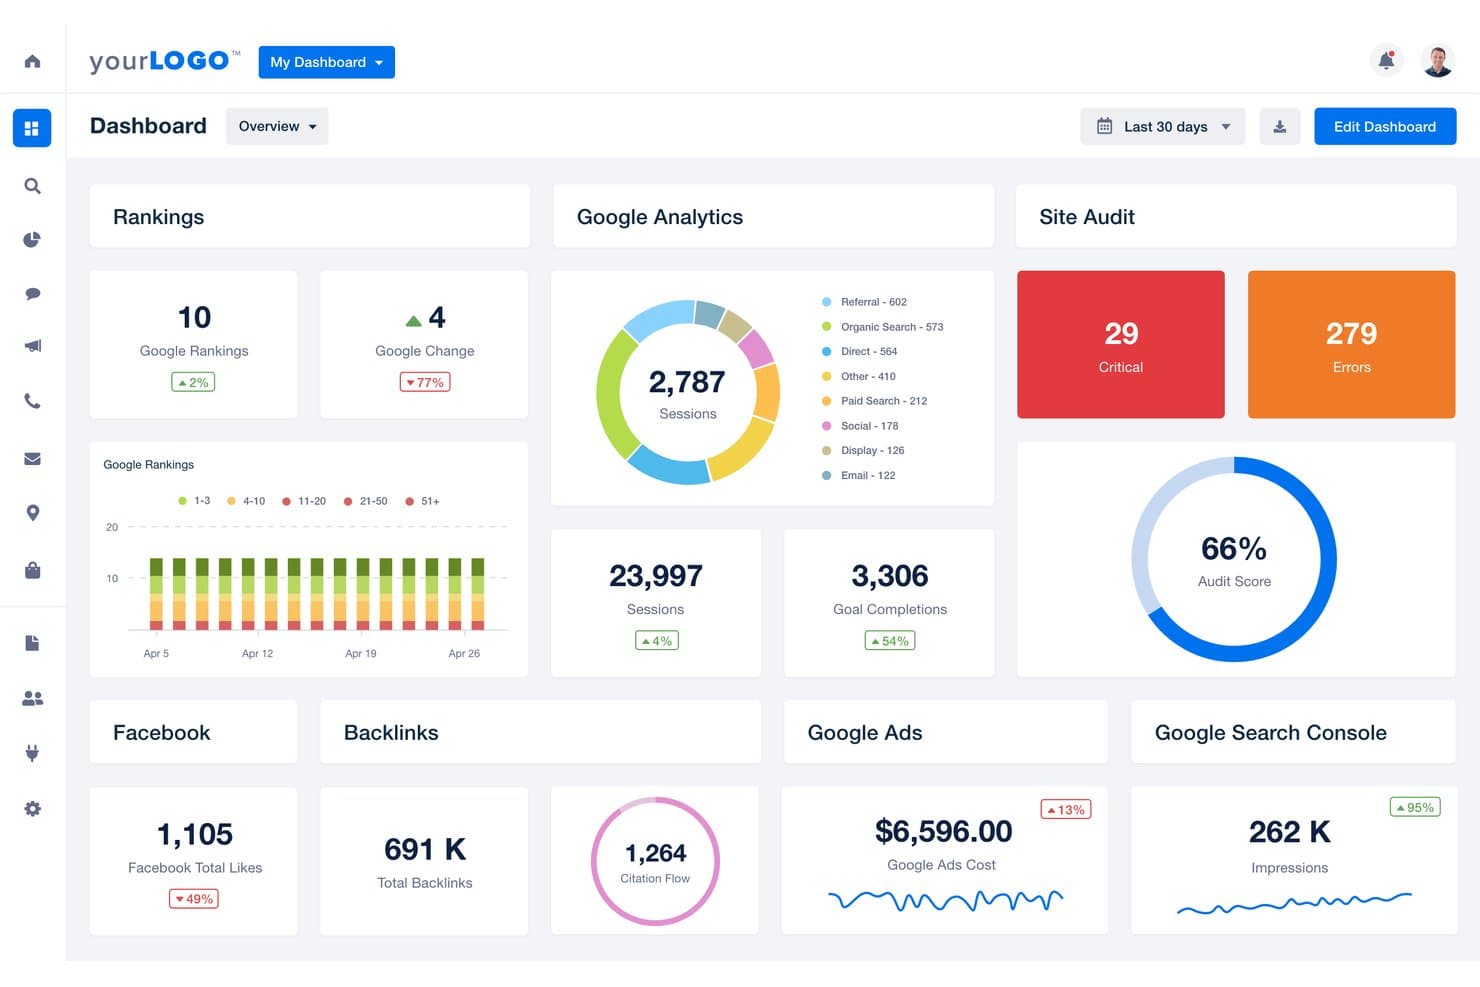
AgencyAnalytics centralizes SEO, ads, and audit data in one dashboard. AgencyAnalytics offers a unified platform for marketing agencies that need to simplify client reporting, monitor campaign KPIs, and centralize analytics across multiple channels.
Who Is AgencyAnalytics Best For?
AgencyAnalytics is a strong fit for marketing agencies that handle reporting and analytics for multiple clients across many channels.
Why AgencyAnalytics Is a Good Whatagraph Alternative
I picked AgencyAnalytics because I need to deliver polished, multi-channel reports at scale without manual data pulls. My team relies on its customizable dashboards, white-label reporting, and automated scheduling to keep hundreds of client stakeholders in the loop. Managing cross-channel KPIs for large portfolios is fast and organized with AgencyAnalytics.
AgencyAnalytics Key Features
- Drag-and-drop dashboard builder: Create custom client dashboards from pre-built widgets and templates.
- SEO audit tools: Run site audits, track keyword rankings, and monitor backlink profiles within your workspace.
- Automated client notifications: Configure instant alerts for metric changes or campaign anomalies across integrated channels.
- Report approval workflow: Review, approve, and comment on scheduled or draft reports before sending them to clients.
AgencyAnalytics Integrations
AgencyAnalytics offers 80+ native integrations, including Google Analytics, Google Ads, Facebook Ads, Facebook Pages, Instagram Insights, LinkedIn Pages, LinkedIn Ads, Twitter, Mailchimp, HubSpot, and Salesforce. An API is available for custom integrations.
Pros and Cons
Pros:
- Automates multi-channel reporting at large scale
- Custom report approvals keep accountability high
- Easy to white-label reports for each client
Cons:
- Visualizations lack advanced customization options
- No granular user permissions for dashboards
Learn more about AgencyAnalytics: Best for tracking goals alongside multi-source reports
- Free plan + 14-day free trial + free demo available
- From $71/month (billed annually)
Visit WebsiteCustomer Rating:4.5/5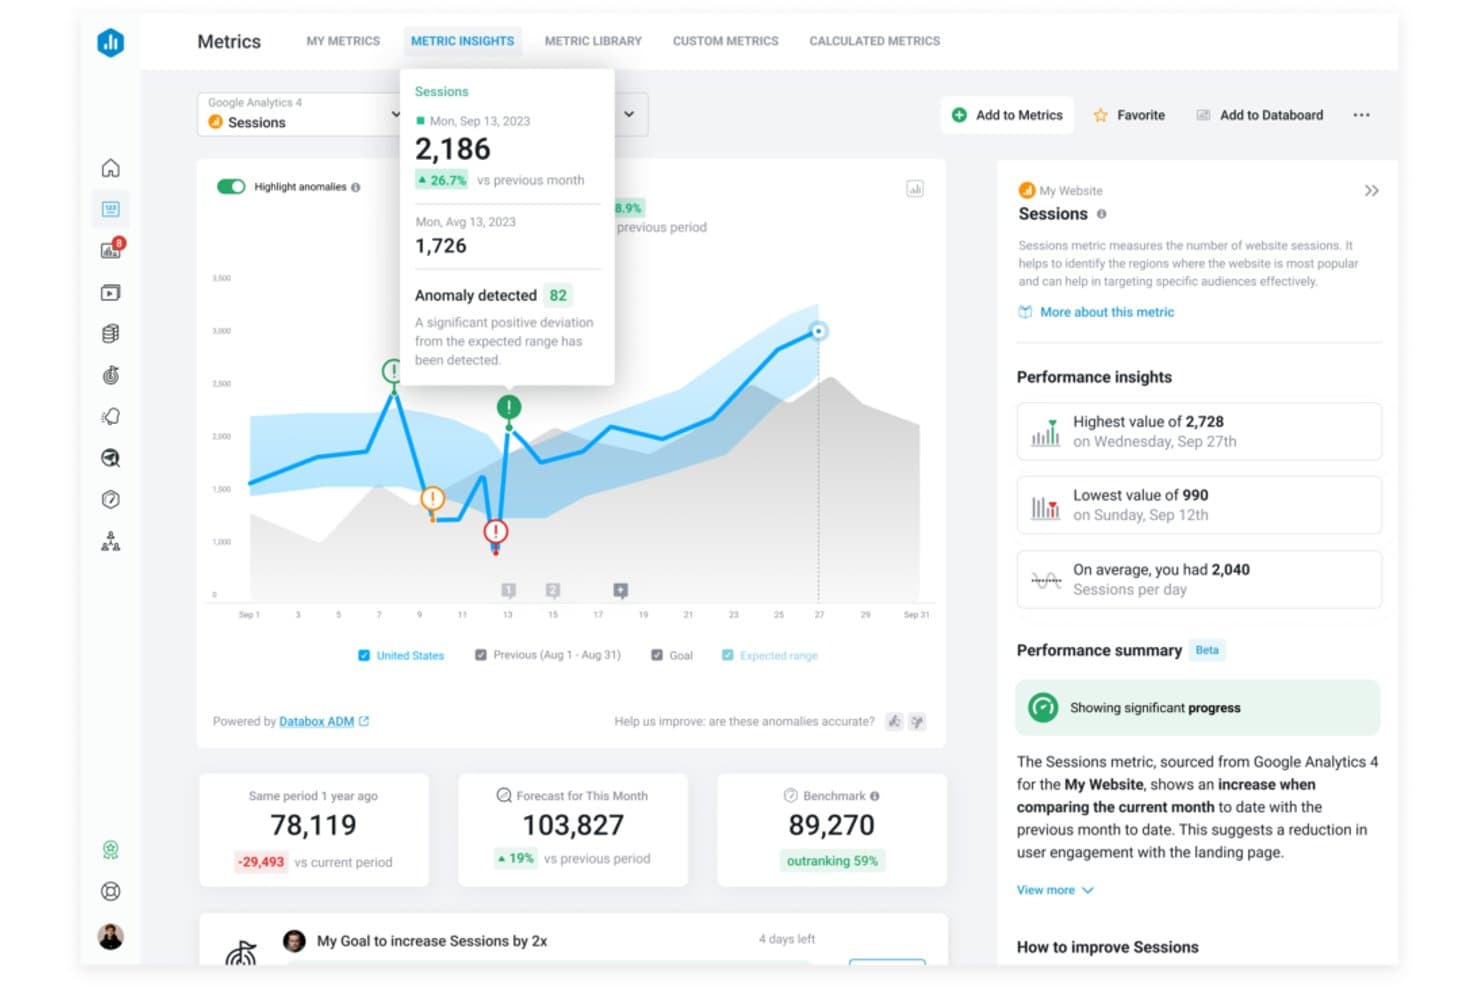
Databox flags session anomalies and surfaces AI-driven performance insights. Databox is a marketing analytics platform built for marketers and agencies who need to centralize and visualize data from multiple sources, making it easier to track campaign performance and inform strategy decisions.
Who Is Databox Best For?
Databox is a good fit for marketing agencies and teams who need to monitor multiple campaigns and data sources in one place.
Why Databox Is a Good Whatagraph Alternative
I picked Databox as one of the best because I can track progress toward specific marketing goals right alongside multi-source dashboards. I use its goal-tracking tools to set and visualize targets across data pulled in from various platforms, helping my team easily align every campaign with our broader objectives.
Databox Key Features
- Custom dashboard builder: Quickly assemble dashboards to visualize data using drag-and-drop widgets.
- Automated data syncing: Connect a wide range of marketing and business data sources for regular updates without manual imports.
- Mobile analytics app: Access and monitor reports or dashboards from Android or iOS devices on the go.
- Alerts and scorecards: Set up custom alerts or daily/weekly scorecards delivered by email or mobile notification.
Databox Integrations
Databox offers 100+ native integrations, including Google Analytics, HubSpot, Google Ads, Facebook Ads, Salesforce, Shopify, Mailchimp, LinkedIn Ads, Intercom, and Stripe. An API is available for custom integrations.
Pros and Cons
Pros:
- Mobile analytics app supports on-the-go monitoring
- Customizes dashboards using drag-and-drop widgets
- Visualizes marketing goals alongside multi-source data
Cons:
- Lacks advanced calculated metrics options
- Lacks predictive modelling features
Learn more about Databox: 8Best for enterprise BI and data visualization
Domo
- 30-day free trial
- Pricing upon request
Visit WebsiteCustomer Rating:4.4/5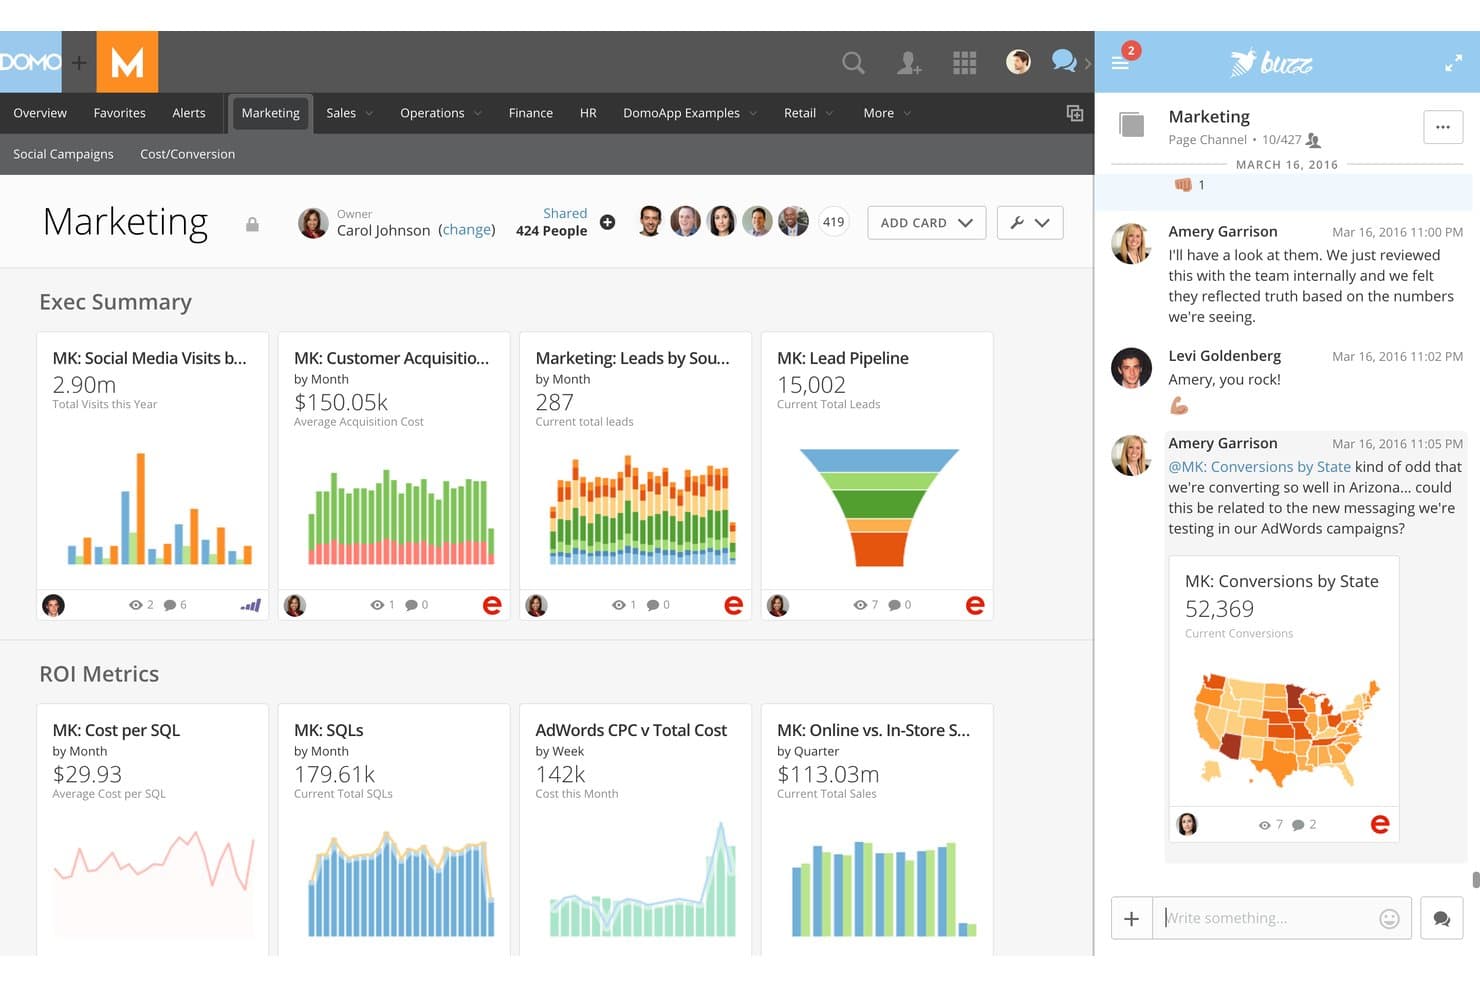
Domo enables real-time team collaboration directly within marketing dashboards. Domo is a marketing analytics platform built for enterprise teams that need to unify complex data, create advanced visualizations, and drive insights across departments. It appeals to businesses that want to bring scattered sources into one interactive environment.
Who Is Domo Best For?
Large marketing teams at enterprise organizations that need to unify and visualize complex data across multiple departments and sources.
Why Domo Is a Good Whatagraph Alternative
I picked Domo as one of the best because it lets my team unite enterprise data from hundreds of complex sources, create interactive dashboards, and share sophisticated visualizations across departments. Domo’s platform handles large-scale data blending, which is a must for aligning marketing analytics in bigger organizations.
Domo Key Features
- App store for custom solutions: Access a marketplace with pre-built apps to extend analytics and reporting.
- Data governance controls: Set user permissions and data access rules for privacy and compliance.
- Mobile analytics app: Review dashboards and alerts from any device with their dedicated mobile app.
- Automated data refresh: Schedule automated updates for data sources so dashboards always show current information.
Domo Integrations
Domo offers over 1,000 native integrations, including Salesforce, Google Analytics, Google Sheets, Facebook Ads, HubSpot, Marketo, Shopify, NetSuite, Snowflake, and Microsoft 365. An API is available for custom integrations.
Pros and Cons
Pros:
- Mobile analytics application available
- Offers a marketplace for pre-built analytics apps
- Handles large-scale, multi-source data blending
Cons:
- Visualization tools can overwhelm smaller teams
- Dashboard setup requires extensive configuration time
Learn more about Domo: Best for automating agency marketing operations
- Free demo available
- Pricing upon request
Visit WebsiteCustomer Rating:4.3/5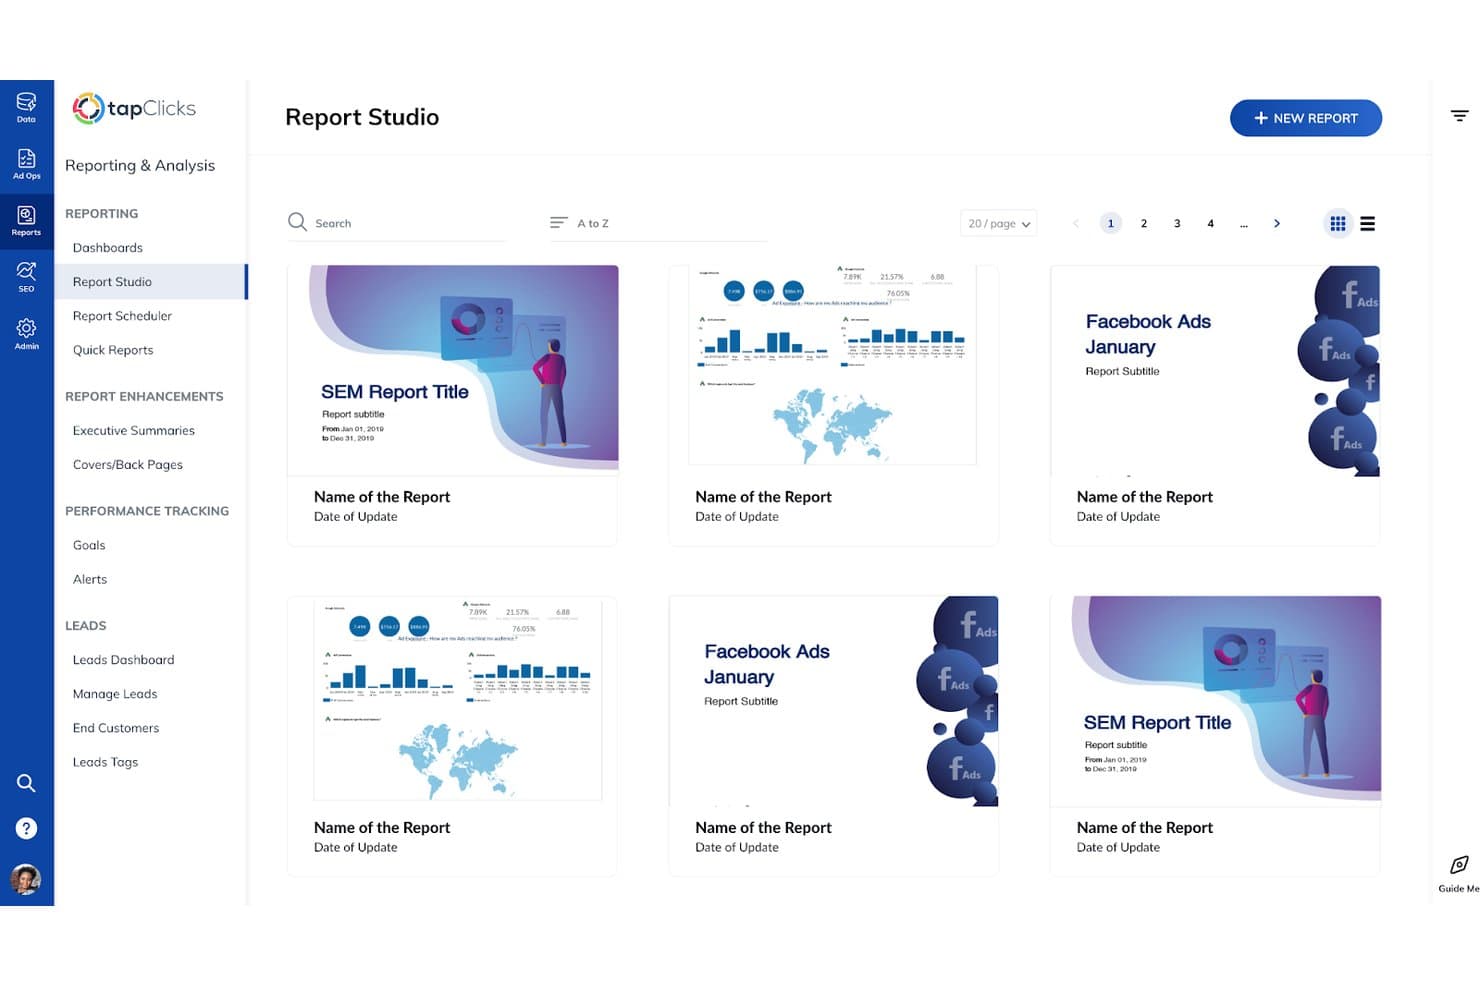
TapClicks lets users browse and manage saved reports in Report Studio. TapClicks is a unified marketing operations platform designed for agencies and multi-brand businesses that want to centralize analytics, automate reporting, and simplify managing diverse client campaigns.
Who Is TapClicks Best For?
TapClicks is a good fit for marketing agencies and multi-brand businesses that need a unified platform to manage analytics and client campaigns at scale.
Why TapClicks Is a Good Whatagraph Alternative
I picked TapClicks as one of the best because it makes it easy to automate reporting across dozens of client accounts and campaigns. I rely on its unified dashboard to centralize analytics, and my team uses built-in workflow automation to reduce manual tasks when managing multi-channel campaigns for agency clients.
TapClicks Key Features
- White-label dashboard: Offers customizable dashboards with your agency’s branding for client-facing reports.
- Data connector library: Provides integrations with hundreds of marketing, advertising, and analytics platforms.
- Role-based access control: Lets you manage permissions for team members and clients at a granular level.
- Automated data import scheduling: Allows you to schedule and automate regular data pulls from connected sources.
TapClicks Integrations
TapClicks offers native integrations with over 250 marketing, advertising, and analytics platforms, including Google Ads, Facebook Ads, HubSpot, Mailchimp, LinkedIn Ads, Google Analytics, Salesforce, Shopify, Twitter Ads, and Adobe Analytics. An API is also available for custom integrations.
Pros and Cons
Pros:
- Triggers automated workflow alerts
- Automates reporting for recurring client needs
- Unifies analytics across multiple client accounts
Cons:
- Initial setup for data connectors takes time
- Advanced dashboard customization requires onboarding
Learn more about TapClicks: 10Best for end-to-end data warehouse management
ClicData
- Free trial + free demo available
- From $265/month (billed annually)
Visit WebsiteCustomer Rating:4.4/5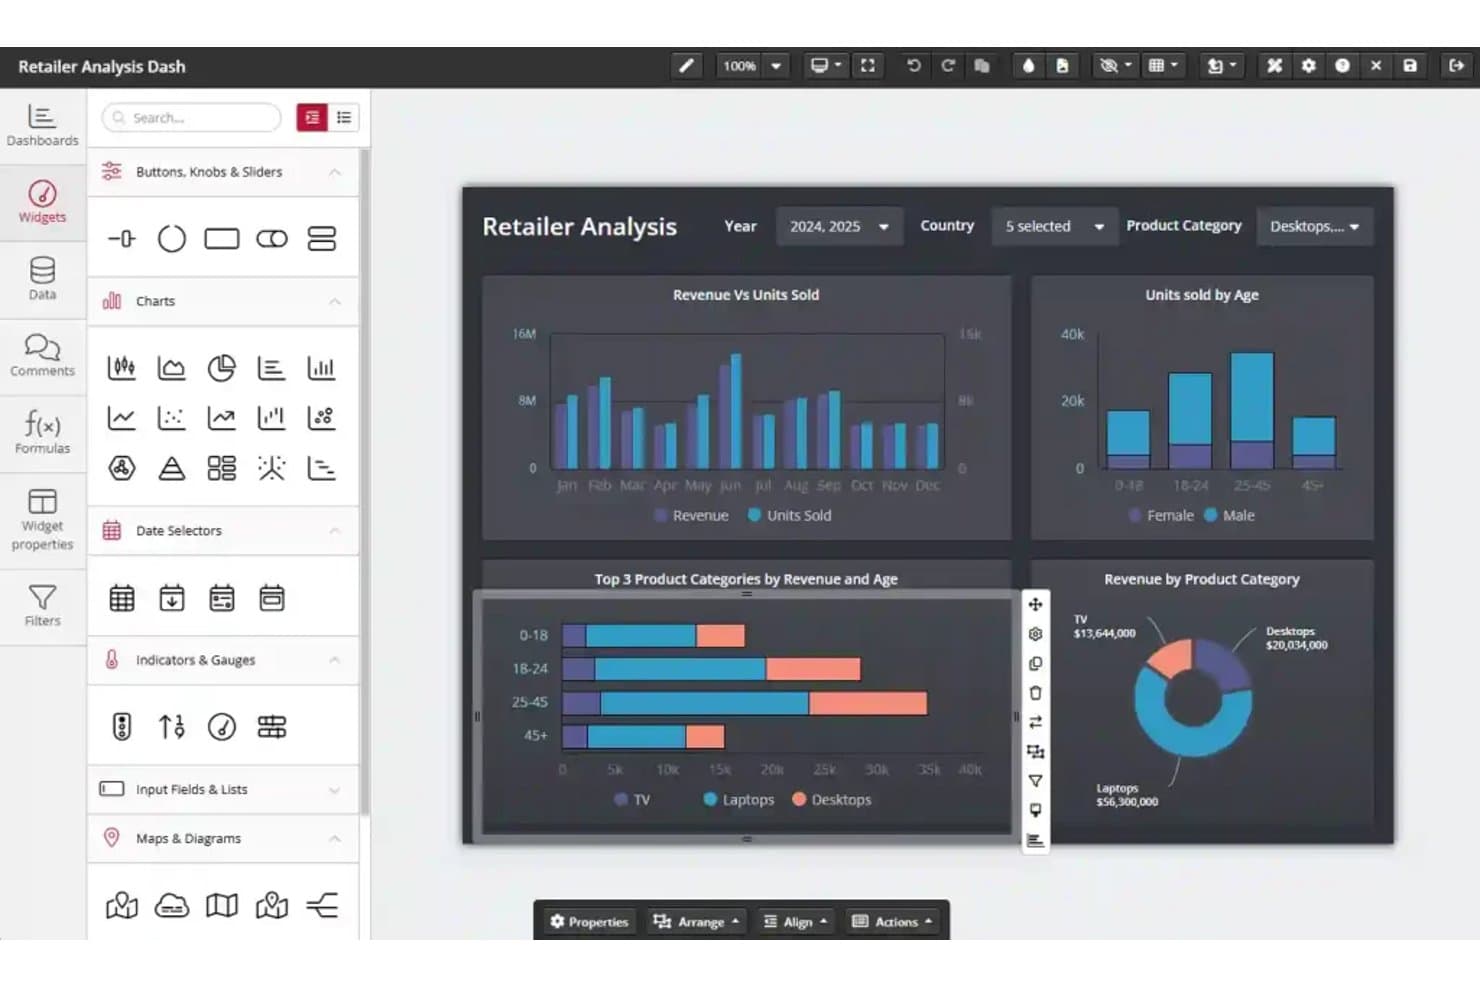
ClicData's drag-and-drop dashboard editor builds retail analytics reports. ClicData is a cloud-based analytics platform built for marketing teams and agencies that want to centralize data, automate reporting, and design custom dashboards to track campaign performance across multiple sources.
Who Is ClicData Best For?
ClicData is a solid option for marketing teams and agencies that need centralized cloud reporting across multiple data sources.
Why ClicData Is a Good Whatagraph Alternative
I picked ClicData because it brings end-to-end data warehouse management to marketing analytics. I pull campaign data from multiple platforms into one cloud hub, automate data refreshes, and build unified dashboards. That lets my team track cross-channel performance and spot trends without juggling spreadsheets or exporting reports.
ClicData Key Features
- Data connectors: Connect to over 250 sources including advertising, CRM, social, and cloud apps.
- Scheduled reporting: Set automated schedules for dashboard delivery to teams or clients.
- Data transformation tools: Clean, merge, and prep data with an in-platform drag-and-drop editor.
- User access controls: Assign user roles and permissions to tailor data visibility and dashboard access.
ClicData Integrations
ClicData offers native integrations with Google Analytics, Facebook Ads, HubSpot, Salesforce, Google Ads, MySQL, SQL Server, Dropbox, OneDrive, and Shopify. An API is available for custom integrations.
Pros and Cons
Pros:
- Automated dashboard delivery to teams and clients
- Centralizes reporting across multiple data sources
- Drag-and-drop editor for data transformation
Cons:
- Learning advanced data prep features takes time
- Mobile dashboard experience can feel limited
Learn more about ClicData:
Other Whatagraph Alternatives
Here are some additional Whatagraph alternatives that didn’t make it onto my shortlist, but are still worth checking out:
- 11Coupler.ioBest for blending 400+ sources into one report
- 12Zoho AnalyticsBest for blending ad, CRM, and finance data
- 13AdverityBest for warehouse-native marketing data pipelines
- 14SwydoBest for per-data-source agency reporting
- 15DashThisBest for white-label client reporting on any plan
- 16ImprovadoBest for enterprise-scale marketing data consolidation
- 17Two Minute ReportsBest for Google Sheets-based client reporting
- 18OctoboardBest for AI-annotated agency reports
- 19Salesforce Marketing Cloud IntelligenceBest for Salesforce-stack marketing intelligence
- 20PorterBest for Looker Studio agency reporting
How I Evaluate Whatagraph Alternatives
I split my evaluation into two layers: core functionality every tool in this category must offer—like multi-source integrations, automated report scheduling, and customizable dashboards—and differentiating factors like AI-powered insights, goal tracking, or data warehouse sync that separate one platform from another.
Core Functionality (Table Stakes for This List)
When I'm selecting tools for my list, I rank each one on a scale from 0 (does not offer the functionality) to 5 (excels in this area) for each core functionality listed below. I then calculate the tool's total score as a percentage, using 65% as a benchmark to help assess its overall fit for the list.
- Multi-source integrations: I check for native connectors to the channels marketing teams actually use daily—Google Ads, Meta Ads, GA4, LinkedIn Ads, and CRM platforms.
- Automated report scheduling: Recurring report delivery matters, so I evaluate whether you can set cadences, add multiple recipients, and choose formats like PDF or live links.
- Customizable dashboards: I look for drag-and-drop editors that let you build views with flexible chart types, calculated metrics, and layout control beyond rigid templates.
- White-label branding: Agency teams need client-facing polish, so custom logos, colours, branded domains, and the ability to remove vendor references all factor into my evaluation.
- Cross-channel data blending: Comparing Google Ads spend against GA4 conversions in a single widget is a real need—I evaluate how each tool joins and calculates across sources.
- Template library: Pre-built templates for common channels like Meta Ads, Google Ads, or SEO speed up onboarding, so I check both quantity and channel coverage.
Once I have a list of tools that meet the criteria, I consider what sets each platform apart.
Differentiating Factors (What Sets Vendors Apart)
Here's how I compare and contrast different vendors:
Standout Features
I evaluate whether a tool offers goal and pacing tracking with visual indicators against budgets or KPIs. This matters when an agency needs to spot underperformance mid-flight rather than after a campaign ends. I also look for data warehouse sync capabilities, since teams using BigQuery or Snowflake need blended marketing data pushed directly into their BI stack. AI-powered insights that surface anomalies and generate natural-language summaries save real time during weekly reporting cycles.
Beyond Features
Pricing predictability matters a lot when you're scaling from five clients to fifty. I look at whether a tool charges per data source, per user, or per client workspace, since that directly affects how costs grow as your agency adds accounts. Onboarding speed is another factor I evaluate closely—template libraries and guided connector wizards can cut time-to-first-report from days to minutes, which is the difference between a team adopting a tool or abandoning it. I also check how each platform handles multi-client workspace isolation, role permissions, and bulk dashboard duplication, because agencies juggling dozens of brands need those operational shortcuts daily.
Why Look For a Whatagraph Alternative?
While Whatagraph is a good choice of marketing analytics platform, there are a number of reasons why some users seek out Whatagraph alternatives. You might be looking for a Whatagraph alternative because…
- Needing more in-depth custom reporting controls from your reporting software, like support for automated reporting via Power BI, Looker Studio, or Data Studio
- Wanting integrations with less common or niche platforms to expand your data connections across new data destinations
- Handling large volumes of data extraction and data transformation across many clients, requiring an ETL tool to handle the processing while maintaining GDPR compliance
- Requiring stronger data warehouse or BI tool connections for a more advanced marketing intelligence platform
- Looking for more flexible pricing as your agency scales
- Needing better access controls or multi-client management features
If any of these sound like you, you’ve come to the right place. My list contains several marketing reporting platform options that are better suited for teams facing these challenges with Whatagraph and looking for alternative solutions.
Whatagraph Key Features
Here are some of the key features of Whatagraph to help you contrast and compare what alternative solutions offer:
- Multi-source integrations: Connect Whatagraph to a wide range of marketing platforms, ad networks, web analytics tools, and CRM systems, so you can gather all your campaign and performance data in one place for unified reporting.
- Automated report scheduling: Set custom schedules for automated report delivery to stakeholders, clients, or team members, reducing manual effort and ensuring timely updates on campaign progress.
- Customizable dashboards: Build interactive dashboards using drag-and-drop widgets, calculated metrics, and clear data visualization, so you can focus on the KPIs and data that matter most to each audience.
- White-label branding: Add your agency’s logo, brand colours, custom domains, and remove Whatagraph references via white-label reporting, letting you deliver polished, professional reports and dashboards that match your brand identity.
- Cross-channel data blending: Combine and compare metrics from different marketing channels—such as linking Google Ads spend with Meta Ads conversions—using data blending directly in a single widget or dashboard, revealing how campaigns work together.
- Template library: Access a collection of pre-built templates for common use cases like Google Ads reports, SEO performance, or social media analytics, so you can launch new client reports quickly.
- Live client dashboards: Share dynamic, real-time dashboards with clients or leadership, so they always have access to the most recent campaign data without needing new file exports.
- Role-based access controls: Set permissions for team members or clients, defining who can edit, view, or share specific reports and dashboards to maintain data security and control.
- Calculated metrics: Create custom formulas for metrics that aren’t available natively in your marketing platforms, so you can report on unique KPIs or track blended performance indicators.
- Scheduled data refreshing: Ensure your data remains current with automated sync intervals, so every dashboard and report always reflects the latest results pulled from integrated sources.
Costs and Pricing of Whatagraph Alternatives
Selecting Whatagraph alternatives requires an understanding of the various pricing models and plans available. Costs vary based on features, team size, add-ons, and more. The table below summarizes common plans, their average prices, and typical features included in Whatagraph alternatives solutions:
Plan Comparison Table for Whatagraph Alternatives
| Plan Type | Average Price | Common Features |
| Free Plan | $0 | Supports basic integrations, provides limited dashboards, offers standard report templates, and allows for basic sharing. |
| Personal Plan | $20-$50/user/month | Includes more integrations, adds some dashboard customization, supports scheduled reporting, and gives access to template libraries. |
| Business Plan | $50-$150/user/month | Offers advanced multi-source integrations, enables white-label branding, provides cross-channel data blending, supports advanced scheduling, and introduces role-based permissions. |
| Enterprise Plan | $150-$400+/month | Delivers unlimited integrations, offers advanced custom metrics, provides data warehouse sync, supports multi-client workspaces, and includes premium onboarding and support. |