

Encontrar o software de painel de marketing adequado pode ser um verdadeiro desafio. Com tantas ferramentas a afirmarem que simplificam a análise, é difícil saber quais cumprem realmente o que prometem. A plataforma certa pode fazer toda a diferença, transformando dados complexos em informações claras e ajudando a sua equipa a tomar decisões mais inteligentes.
Testei e analisei várias opções de referência para o ajudar a escolher a solução mais adequada. O meu objetivo é apresentar recomendações honestas, baseadas em investigação e centradas no que é realmente importante.
Neste artigo, encontrará uma análise das principais funcionalidades, vantagens e desvantagens, bem como dos preços, para poder escolher com confiança o software de painel de marketing que melhor funciona para a sua equipa.
Why Trust Our Software Recommendations
6,700+
Reviews
20
Industry experts
16+
Evaluation factors
14
Years
Our team has been testing and reviewing software since 2012. As marketing leaders ourselves, we know how difficult—and important—it is to choose the right software.
For this guide, we evaluated tools using hands-on testing and independent research, scoring tools using our selection criteria.
Our reviews reflect our human editorial judgment, not a sales pitch.
Expert reviewers:
 Gui DrusinaCreative Director
- Shriya GhateSenior Marketing Lead
 Amanda JacquesMarketing Ops Leader

Tabela comparativa: software de painéis de marketing
Esta tabela comparativa resume os detalhes dos preços das minhas principais seleções de software de painéis de marketing.
| Tool | Best For | Trial Info | Price | ||
|---|---|---|---|---|---|
| 1 | Best multi-integration dashboards | Free trial available | From $44/mo (billed annually) | Website | |
| 2 | Best for sentiment analysis | Free trial available | From $199/month (billed annually) | Website | |
| 3 | Best for tracking trends to act on | Free demo available | Available upon request | Website | |
| 4 | Best for visualizing PPC campaign results | 7-day free trial | From $49/month/brand | Website | |
| 5 | Best for governed AI marketing queries | Free demo available | Pricing upon request | Website | |
| 6 | Best for partnership management | Free demo available | From $30/mo | Website | |
| 7 | Best for multi-source marketing intelligence | Free demo available | Pricing upon request | Website | |
| 8 | Best for email marketing analytics | Free demo available | From $812/month (billed annually) | Website | |
| 9 | Best for building custom dashboards from scratch | Free trial + free demo available | Pricing upon request | Website | |
| 10 | Best for interactive charts and graphs | 30-day free trial | From $79/user/month (billed annually) | Website |


Análises dos melhores softwares de painéis de marketing
Eis uma breve descrição de cada uma das ferramentas apresentadas nesta lista.
 Best multi-integration dashboards
- Free trial available
- From $44/mo (billed annually)
Visit WebsiteCustomer Rating:4.8/5
DashThis can pull data from multiple integrated sources and display them on one unified dashboard. DashThis is an easy-to-use software that will save you time in generating your automated reports and creating dashboards. Access to your data sources is unlimited and the platform connects to over 34 of the most commonly used digital marketing tools. The number of users is also not limited like with other tools on the market.
Why I Picked DashThis: DashThis excels in handling multi-integration dashboards by seamlessly integrating with various data sources, such as Google Analytics, Facebook Ads, Instagram, and LinkedIn. With its user-friendly interface, users can easily connect multiple platforms, import data, and customize their dashboards to display key performance indicators (KPIs) from different sources in a cohesive and visually appealing manner. DashThis provides a centralized hub for marketers to track and analyze data from multiple channels, empowering them to gain comprehensive insights, make informed decisions, and optimize their marketing strategies efficiently.
DashThis Standout Features & Integrations
Features include marketing dashboards that display KPIs from multiple external sources, a CSV file import system, unlimited client accounts, templates and cloning options, report sharing (email, PDF, URL), white labeling services, and a custom widget editor.
Integrations include Tiktok Ads, Google Ads, GA4, and Facebook Ads among others.
Pros and Cons
Pros:
- Easy to use
- Integration capabilities
- Responsive customer support
Cons:
- Limited advanced features
- Costly for smaller teams
Learn more about DashThis: Best for sentiment analysis
- Free trial available
- From $199/month (billed annually)
Visit WebsiteCustomer Rating:4.7/5
Brand24’s homepage highlights its AI-powered social listening dashboard, showing metrics for brand mentions, reach, and sentiment across real-time digital sources. Brand24 is a marketing dashboard tool that tracks brand mentions across 25 million+ sources, including social, news, forums, and podcasts. It gives you a visual, real-time view of how people are talking about your brand—segmenting sentiment, reach, and intent—so you can monitor campaigns and make data-informed decisions.
Why I Picked Brand24: I picked Brand24 for its ability to help you understand how people feel about your brand at scale. Its dashboards go beyond vanity metrics, letting you dig into the emotional tone of mentions across platforms in real time. I also appreciated how it surfaces actionable insights—automated alerts flag unusual spikes, and real-time data is pushed to Slack so your team can quickly decide how to respond. If you need brand performance stats without the guesswork, this one’s worth exploring.
Brand24 Standout Features & Integrations
Features include topic analysis, intent detection, influence scoring, reputation and presence metrics, customizable reports, emoji-based emotion tracking, and project-level comparison dashboards.
Integrations include Slack, HubSpot, Trello, Asana, Buffer, Google Analytics, Hootsuite, Facebook, Instagram, LinkedIn, Telegram, TikTok, and Spotify.
Pros and Cons
Pros:
- Tracks campaign hashtags with reach and volume metrics
- Alerting system for mention spikes and anomalies
- Sentiment, reach, and intent metrics in one view
Cons:
- Some integrations (like CRM) require manual setup
- Dashboards can feel cluttered with high volume data
Learn more about Brand24: Best for tracking trends to act on
- Free demo available
- Available upon request
Visit WebsiteCustomer Rating:5/5
TikTok's analytics dashboard let you track your content's performance and keep an eye on trends you can capitalize on. TikTok is a popular social media platform that focuses on short-form video sharing. Marketers can monitor the performance of their content and track trends in the platform, helping them create more engaging content and tap into trending challenges, formats, audio, and more.
Why I picked TikTok: I chose to include TikTok because its analytics dashboard offers insights into video performance that help you act on trends quickly to increase visibility. You can track audience engagement and discover which trends are resonating most with your audience. By using TikTok’s trend data, your team can adjust campaigns in real-time and stay connected with what’s working. This makes it a strong choice for those looking to base marketing decisions on real-time trends and data.
TikTok Standout Features & Integrations
Features include trend analysis, video performance insights, and audience engagement metrics. You can track which trends are gaining momentum and act quickly to align your content. TikTok’s analytics give your team a real-time view of how your content is performing.
Integrations include Shopify, WooCommerce, BigCommerce, Magento, and Square.
Pros and Cons
Pros:
- Built-in tools for collaborations
- Quick access to audience engagement
- Offers detailed video insights
Cons:
- Hard to predict viral success
- Not suitable for multi-platform analytics
Learn more about TikTok: Best for visualizing PPC campaign results
- 7-day free trial
- From $49/month/brand
Visit WebsiteCustomer Rating:5/5
Meerkads dashboard compares spend, revenue, ROAS, and conversions Meerkads helps ecommerce brands, agencies, and paid media teams replace scattered ad platform reports with real-time marketing dashboards. It pulls data from Google Ads, Meta Ads, TikTok Ads, and Shopify, then uses AI-powered analysis to surface campaign issues, creative performance trends, and product-level revenue insights.
Who Is Meerkads Best For?
Meerkads is a strong fit for paid media managers and performance marketing agencies that need a centralized view of ad spend and results across multiple platforms.
Why I Picked Meerkads
I picked Meerkads because it makes PPC campaign results easier to compare across Google Ads, Meta Ads, and TikTok Ads from one dashboard. You can track ROAS, CPA, CTR, spend, and conversions side by side, which helps your team spot which channels and campaigns are driving the strongest results. I also like its campaign and ad-level breakdowns because they make it easier to review performance without jumping between separate ad platforms. Its AI performance scoring adds another useful layer by grading campaigns, so you can quickly identify underperforming ads and prioritize what needs attention first.
Meerkads Key Features
Some other features in Meerkads help teams monitor ad performance, report results, and connect campaign data to ecommerce revenue:
- Creative fatigue detection: Flags ads that are losing performance over time so your team knows when to refresh creative.
- White-labeled shareable dashboards: Creates dashboard links that clients or stakeholders can view without needing a Meerkads login.
- Automated performance alerts: Notifies your team when metrics like ROAS or CPA move outside your set thresholds.
- Shopify sales data overlay: Connects Shopify revenue data with ad spend to show ROAS based on actual order values.
Meerkads Integrations
Integrations include Google Search Console, TikTok Ads, Meta Ads, Google Ads, GA4, and Shopify.
Pros and Cons
Pros:
- Combines Google, Meta, TikTok, and Shopify performance data
- Shows real ROAS using ecommerce revenue and ad spend
- Supports white-labeled dashboards and reports for agency clients
Cons:
- No SEO or organic marketing dashboards
- Limited to paid ad channel data sources
Learn more about Meerkads: Best for governed AI marketing queries
- Free demo available
- Pricing upon request
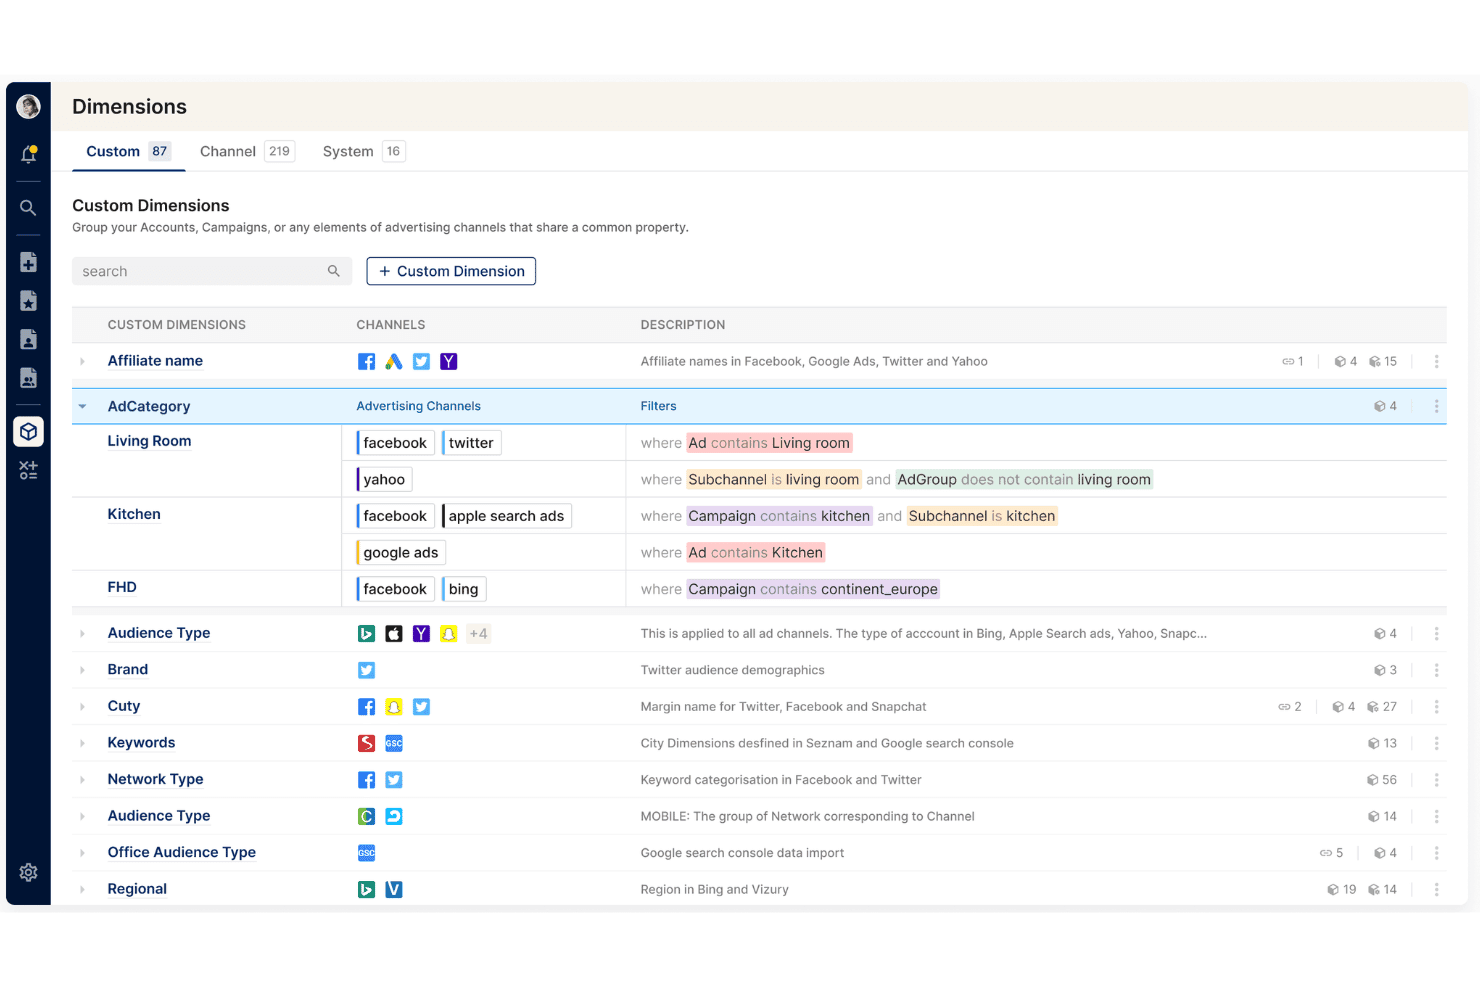
Clarisights lets users group ad elements into custom dimensions with filters. Clarisights is an enterprise marketing analytics platform that unifies channel, attribution, and backend data across 300+ integrations for cross-channel reporting, creative analysis, and self-service exploration.
Who Is Clarisights Best For?
Clarisights is a strong fit for enterprise marketing teams that need a single place to unify channel, attribution, and backend data for cross-channel analysis and reporting.
Why I Picked Clarisights
I've included Clarisights in my top picks because its Marketing Data MCP is genuinely unlike anything else in this category: it connects your unified marketing data directly to AI clients like Claude and ChatGPT, letting you run governed aggregate, trend, and group queries without leaving your AI workflow. What I find compelling is that access is permission-bound to each user's existing Clarisights credentials, so there's no risk of exposing data outside established access rights. Pair that with Reporting Hub's version-controlled, annotated report sharing across internal teams and external partners, and you get a platform built for structured, accountable analysis.
Clarisights Key Features
- Cross-channel performance diagnosis: Lets you drill from high-level metrics into campaign, channel, or creative-level data to investigate what's driving performance changes.
- No-code metric and dashboard creation: Lets marketers build, edit, and filter custom metrics, dashboards, and reports without SQL or data team support.
- Budget and pacing alerts: Integrates budgets and targets directly into performance views and sends alerts when spend or pacing shifts.
- Aggregated warehouse exports: Pushes unified marketing data to your data warehouse for use in finance pipelines, MMM, or company-wide dashboards.
Clarisights Integrations
Clarisights claims 300+ native API integrations, including Google Ads, Facebook Ads, TikTok Ads, Google Analytics 4, LinkedIn Ads, AppsFlyer, Shopify, Salesforce, HubSpot, and Klaviyo. Its Marketing Data MCP connects with Claude, ChatGPT, Cursor, and Gemini.
Pros and Cons
Pros:
- Responsive CSM support praised by reviewers
- Custom cross-channel reports drill into creative detail
- Governed AI queries respect user permissions
Cons:
- No documented automated report delivery scheduling
- Dashboard data delays hinder real-time monitoring
Learn more about Clarisights:

impact.com's tracking features allow users to customize dashboards to monitor different marketing metrics and analyze data to optimize campaigns. impact.com is a partnership management platform that helps businesses manage and grow various types of partnerships, including affiliates, influencers, and brand-to-brand collaborations. It offers tools to automate the entire partnership lifecycle, from discovery and recruitment to tracking and optimization.
Why I Picked impact.com: impact.com provides detailed tracking capabilities that let you monitor customer interactions throughout their journey, across different devices. This means you can see how users engage with your partnership marketing efforts at each stage, helping you understand which strategies lead to conversions. By having this insight, you can adjust your tactics to improve your return on investment. Another useful feature is the platform's data visualization tools. impact.com offers clear visuals of metrics and trends, making it easier to spot patterns and anomalies in your marketing data.
impact.com Standout Features & Integrations
Features include a cross-device identity graph, real-time data reporting, customizable dashboards, partner performance analytics, anomaly detection, forecasting tools, and deferred deep linking.
Integrations include Shopify, BigCommerce, HubSpot, Adobe Commerce (Magento), AppsFlyer, Adjust, AnyTrack, Branch, mParticle, Segments, Google Analytics, and Salesforce.
Pros and Cons
Pros:
- Fraud detection capabilities
- Supports the entire partnership lifecycle
- Comprehensive reporting features
Cons:
- Occasional delays in payment processing
- May take time to set up the platform
Learn more about Impact: Best for multi-source marketing intelligence
- Free demo available
- Pricing upon request
Visit WebsiteCustomer Rating:4.5/5
Adverity offers a wide range of pre-built datastream connectors to unify marketing data from multiple platforms. Adverity is a data intelligence platform designed to help marketing teams collect, prepare, and analyze data from various sources. It lets you build dashboards that provide insights into campaign performance and marketing spend.
Why I Picked Adverity: Adverity offers AI-driven features that enhance your dashboards with proactive insights. Its AI capabilities automatically identify critical patterns and anomalies in your data, presenting them in a straightforward manner. This allows you to quickly spot issues or opportunities, such as reallocating budgets or adjusting campaigns, without the need for manual analysis or data science expertise. I also like Adverity's transformation copilot, which simplifies the process of cleaning and enriching data. By using natural language prompts, you can transform complex datasets into ready-to-use insights without writing code.
Adverity Standout Features & Integrations
Features include data quality monitoring, dashboard sharing options, widget-based dashboard construction, real-time data updates, customizable dashboard themes, data export capabilities, public dashboard links, dashboard collaboration tools, and version control.
Integrations include Google Ads, Facebook Ads, TikTok Ads, Amazon Ads, Google BigQuery, Looker Studio, Google Drive, Hubspot, Salesforce, Zendesk, App Annie, and Google Analytics.
Pros and Cons
Pros:
- Provides the ability to create personalized dashboards
- Can harmonize data from various sources
- Scalable for businesses of various sizes
Cons:
- The initial setup can be complex and time-consuming
- Certain features may require technical knowledge
Learn more about Adverity: Best for email marketing analytics
- Free demo available
- From $812/month (billed annually)
Visit WebsiteCustomer Rating:4.5/5
Track reach and budget for all marketing campaigns goals, including email marketing. Whatagraph is a marketing analytics and social media reporting platform that provides multi-channel reports, custom data widgets, team management, filtering options, pre-made templates, branded white label, image uploads, and commenting.
Why I Picked Whatagraph: Whatagraph is a powerful tool for email marketing analytics, offering several features that make it stand out in this area. With Whatagraph, users can gather data from email marketing platforms, such as open rates, click-through rates, conversions, and subscriber engagement metrics, and visualize this data in easy-to-understand and visually appealing reports. The platform allows for customization, enabling users to tailor their reports to specific metrics, timeframes, or target audiences. Whatagraph also offers automated reporting capabilities, allowing users to schedule regular email performance reports and receive them directly in their inbox.
Whatagraph Standout Features & Integrations
Features analytics, calendar management, dashboard, data import/export, data visualization, external integrations, keyword tracking, link tracking, marketing automation, multi-user, notifications, referral tracking, scheduling, seo, and social-media integration.
Integrations include Adroll, Authority Ads, Bing Ads, CallRail, Campaign Monitor, Celtra, Cvent, Emma, Facebook, Google Analytics and Ads, Instagram, YouTube, Oath (Yahoo), LinkedIn, Mailchimp, SEMrush, Twitter, Snapchat, Tubemogul, Hubspot, CSV, Excel, and more.
Pros and Cons
Pros:
- Multi-channel integration
- User-friendly interface
- Strong automated reporting
Cons:
- Limited data manipulation capabilities
- Learning curve for setup
 Best for building custom dashboards from scratch
- Free trial + free demo available
- Pricing upon request
Visit WebsiteCustomer Rating:4.4/5
If you already use Google tools, Looker will fit nicely into your marketing strategy. Looker Studio (was: Google Data Studio) is a dashboard reporting solution for users who want to go above and beyond what Google Analytics has to offer. Data Studios, like many Google services, is free to use. Additionally, Looker Studio is feature-rich and constantly updating, so you won’t feel anything lacking.
Why I Picked Looker Studio: Looker Studio is highly regarded for its capabilities in building marketing dashboards from scratch. The platform offers a range of tools and features that empower users to create customized and visually appealing dashboards tailored to their specific marketing needs. With Looker Studio, users can leverage its drag-and-drop interface and intuitive design elements to easily design and arrange widgets, charts, and visualizations. The platform's robust data modeling capabilities enable users to connect to multiple data sources, perform complex calculations, and create calculated fields, providing flexibility and control over the data displayed in the dashboard. Looker Studio also offers collaborative features, allowing teams to work together on dashboard creation and share insights seamlessly.
Looker Studio Standout Features & Integrations
Features include data visualizations, custom dashboards, interactive reports, marketing templates, external integrations, data import/export, report sharing, and automated email reports.
Integrations include other Google software, like AdWords, Sheets, Analytics, as well as third-party solutions like Adobe Analytics, Asana, Bing Ads, Facebook Ads, BigQuery, MySQL, PostgreSQL, and Hubspot.
Pros and Cons
Pros:
- Customizable and interactive dashboards
- Powerful data modeling and querying
- Collaboration and sharing
Cons:
- Complex implementation and setup
- Learning curve
Learn more about Looker: Best for interactive charts and graphs
- 30-day free trial
- From $79/user/month (billed annually)
Visit WebsiteCustomer Rating:4.3/5
Sprout Social offers visual dashboards that can display reports on various metrics, from social media engagement to competitive analyses. Sprout Social is a social media management platform designed to give businesses the tools they need to succeed in their social media efforts. Offering a wide range of features, it helps organizations manage their social media presence, engage with audiences, analyze performance, and optimize their strategies.
Why I Picked Sprout Social: As a marketing dashboard software, Sprout Social excels with its robust features tailored for detailed analytics and reporting. Its marketing dashboards are equipped with interactive charts and graphs, allowing users to visualize data more effectively and derive actionable insights. The platform offers customizable dashboards that can be tailored to track the metrics most important to your business. With real-time data and comprehensive reporting tools, Sprout Social enables marketers to make informed decisions and optimize their strategies for better performance.
Sprout Social Standout Features & Integrations
Features include social media listening, competitive analysis, sentiment analysis, trend tracking, custom reporting, campaign performance tracking, engagement metrics, audience demographics, content performance analysis, and cross-platform publishing.
Integrations include Facebook, X (Twitter), Instagram, LinkedIn, Pinterest, YouTube, Google Analytics, HubSpot, Salesforce, Zendesk, and Slack.
Pros and Cons
Pros:
- Content scheduling and planning features
- Wide range of customizable reports
- Social media listening features
Cons:
- Standard plan limited to 5 social profiles
- Price may be high for smaller businesses
Learn more about Sprout Social:
Outros softwares de painéis de marketing
Eis mais algumas opções que não entraram na lista principal. Se precisar de sugestões adicionais de painéis de marketing úteis, consulte estas opções.
- 11SupermetricsBest for integrating 150+ data sources
- 12TapClicksBest for competitor intelligence
- 13AthenicBest for customizable AI dashboards
- 14MixpanelBest for customizable marketing KPIs
- 15GoHighLevelBest for consolidating marketing tools
- 16Power BIBest marketing funnel data
- 17ClicDataBest for data collaboration
- 18CoefficientBest for spreadsheet-based marketing dashboards
- 19OctoboardBest for product & ecommerce marketing
- 20TracknowBest for affiliate marketing
- 21Social StatusBest for automated social media reports
- 22Zoho AnalyticsBest marketing data visualizations
- 23SignaraBest for automated report delivery by email
- 24SisenseBest interactive dashboards
- 25Google AnalyticsBest free reporting tools by Google
- 26KlipfolioBest dashboards for startups
- 27DomoBest marketing executive dashboard
- 28TableauBest for marketing agencies
- 29SupermetricsBest marketing dashboards for e-commerce
- 30BoardBest dashboards for finance and insurance companies
How I Evaluate Marketing Dashboard Software
I split each evaluation into two layers: baseline requirements like pulling Meta Ads and GA4 into one view, and the differentiators that separate the best options.
Core Functionality (Table Stakes For This List)
When I'm selecting tools for my list, I rank each one on a scale from 0 (does not offer the functionality) to 5 (excels in this area) for each core functionality listed below. Then, I calculate the tool's total score into a percentage. Each tool needs to achieve a minimum total score of 65% to be considered for inclusion.
- Multi-Source Data Integration: I check how many native connectors each tool offers to platforms like Google Ads, Meta Ads, GA4, LinkedIn, HubSpot, and Shopify.
- Real-Time KPI Visualization: Dashboards should display live metrics—spend, conversions, CPA, ROAS—with auto-refreshing widgets rather than requiring manual data pulls.
- Customizable Dashboard Builder: I look for drag-and-drop builders where you can arrange widgets, apply filters, and tailor layouts to a specific campaign or channel view.
- Automated Reporting & Scheduling: Tools should let you schedule recurring reports in formats like PDF or CSV and send them to stakeholders on a set cadence.
- Cross-Channel Metric Blending: I evaluate whether you can create calculated fields that combine data across sources—like comparing paid social CPA against organic conversion rates.
- Sharing & White-Labeling: For agencies and client-facing teams, I look for branded dashboards, client portals, and role-based access to control who sees what.
Once I have a list of tools that meet this criteria, I consider what sets each platform apart.
Differentiating Factors (What Sets Vendors Apart)
Here's how I compare and contrast different vendors:
Standout Features
AI-powered insights are a major differentiator—tools that flag anomalies like a sudden CPA spike or forecast next month's lead volume save hours of manual analysis. I also evaluate attribution modeling, since understanding whether a LinkedIn campaign or an email nurture drove a conversion changes how you allocate budget. Goal and pacing widgets matter too; I look for dashboards that visually track spend against targets so you can course-correct mid-flight.
Beyond Features
Buyer fit matters—I evaluate whether a tool leans agency or in-house, since agency teams need multi-client workspaces and client portals while in-house teams prioritize executive rollups and cross-department access. Pricing structure is another key factor; some vendors charge per data source and others per user, which dramatically changes total cost as your channel mix grows. I also check integration depth with data warehouses like BigQuery or Snowflake for teams that push dashboard data into broader analytics workflows.
Como escolher um software de painéis de marketing
É fácil ficar perdido entre longas listas de funcionalidades e estruturas de preços complexas. Para o ajudar a manter o foco enquanto analisa o seu processo específico de seleção de software, eis uma lista de fatores a ter em conta:
| Fator | O que deve considerar |
|---|---|
| FatorEscalabilidade | O que deve considerarO software consegue acompanhar o crescimento da sua empresa? Considere o volume de dados e o número de utilizadores futuros. Certifique-se de que consegue responder às necessidades crescentes sem custos adicionais ou problemas de desempenho. |
| FatorIntegrações | O que deve considerarFunciona com as ferramentas que já utiliza? Verifique a compatibilidade com plataformas de CRM, redes sociais e correio eletrónico. Uma integração perfeita reduz o trabalho manual e os silos de dados. |
| FatorPersonalização | O que deve considerarPode adaptar os painéis às suas necessidades? Procure layouts flexíveis e opções de widgets. As vistas personalizadas devem estar alinhadas com os objetivos e as métricas da sua equipa. |
| FatorFacilidade de utilização | O que deve considerarA interface é intuitiva? Um design fácil de utilizar reduz o tempo de formação. Teste-o com os membros da equipa para verificar se conseguem navegar sem frustração. |
| FatorImplementação e integração inicial | O que deve considerarCom que rapidez pode começar? Verifique se estão disponíveis recursos como tutoriais e apoio. Uma integração inicial simples ajuda a sua equipa a adotar a ferramenta mais rapidamente e a começar a obter resultados mais cedo. |
| FatorCusto | O que deve considerarEnquadra-se no seu orçamento? Compare os planos de preços, incluindo custos ocultos. Considere a relação custo-benefício e se esta está de acordo com as suas limitações financeiras. |
| FatorMedidas de segurança | O que deve considerarOs seus dados estão protegidos? Procure encriptação, controlos de acesso dos utilizadores e conformidade com os regulamentos de proteção de dados. A segurança deve ser uma prioridade para proteger informações sensíveis. |
O que é um software de painéis de marketing?
O software de painéis de controlo de marketing é uma ferramenta que visualiza as principais métricas e dados de marketing num único local. Os profissionais de marketing, analistas e gestores utilizam geralmente estas ferramentas para acompanhar o desempenho e tomar decisões informadas.
As atualizações de dados em tempo real, os painéis de controlo personalizáveis e as capacidades de integração ajudam na análise e nos relatórios de dados. De um modo geral, estas ferramentas simplificam a gestão de dados e melhoram a tomada de decisões.
Funcionalidades
Ao selecionar um software de painéis de controlo de marketing, procure as seguintes funcionalidades principais:
- Atualizações de dados em tempo real: Fornece informações atualizadas ao minuto, permitindo tomar decisões atempadas e ajustar estratégias.
- Painéis de controlo personalizáveis: Permite aos utilizadores adaptar a apresentação das métricas e dos dados de modo a corresponder a objetivos e necessidades empresariais específicos.
- Capacidades de integração: Liga-se perfeitamente às ferramentas e plataformas de marketing existentes para consolidar dados e reduzir a introdução manual.
- Ferramentas de visualização de dados: Transformam dados complexos em gráficos e diagramas fáceis de compreender, ajudando numa análise rápida.
- Controlos de acesso dos utilizadores: Garantem a segurança dos dados ao permitir que os administradores definam permissões e controlem quem pode visualizar ou editar informações.
- Análise preditiva: Oferece perspetivas sobre tendências futuras com base em dados históricos, ajudando as equipas a antecipar e planear os próximos desafios.
- Acessibilidade multiplataforma: Permite aceder aos painéis de controlo a partir de vários dispositivos, garantindo que as equipas se mantêm informadas em qualquer lugar.
- Notificações de alerta: Envia alertas automáticos relativos a alterações ou tendências importantes, mantendo as equipas proativas em vez de reativas.
- Recursos de formação: Disponibiliza tutoriais, guias e apoio para ajudar os utilizadores a familiarizarem-se rapidamente com a ferramenta e a maximizar a sua utilização.
Benefícios
A implementação de um software de painéis de controlo de marketing proporciona vários benefícios à sua equipa e à sua empresa. Eis alguns dos que pode esperar:
- Melhoria da tomada de decisões: As atualizações de dados em tempo real e a análise preditiva fornecem as perspetivas necessárias para tomar decisões informadas.
- Maior eficiência: As capacidades de integração reduzem a introdução manual de dados, permitindo que a sua equipa se concentre em tarefas estratégicas.
- Maior clareza dos dados: Os painéis de controlo personalizáveis e as ferramentas de visualização facilitam a compreensão e a utilização de dados complexos.
- Melhor colaboração: A acessibilidade multiplataforma garante que todos os elementos da sua equipa têm acesso às mesmas informações, independentemente do local onde se encontram.
- Gestão proativa: As notificações de alerta ajudam a antecipar problemas e oportunidades, mantendo a sua equipa na vanguarda.
- Garantia de segurança: Os controlos de acesso dos utilizadores protegem dados sensíveis, garantindo que apenas o pessoal autorizado pode aceder a informações específicas.
Custos & Preços
A seleção de um software de painéis de controlo de marketing requer uma compreensão dos vários modelos de preços e planos disponíveis. Os custos variam consoante as funcionalidades, o tamanho da equipa, os complementos, entre outros fatores. A tabela abaixo resume os planos comuns, os respetivos preços médios e as funcionalidades normalmente incluídas nas soluções de software de painéis de controlo de marketing:
Tabela de comparação de planos de software de painéis de controlo de marketing
| Tipo de plano | Preço médio | Funcionalidades comuns |
|---|---|---|
| Tipo de planoPlano gratuito | Preço médio$0 | Funcionalidades comunsVisualização básica de dados, integrações limitadas e painéis de controlo padrão. |
| Tipo de planoPlano pessoal | Preço médio$10-$30/user/month | Funcionalidades comunsPainéis de controlo personalizáveis, mais opções de integração e capacidades de exportação de dados. |
| Tipo de planoPlano empresarial | Preço médio$50-$150/user/month | Funcionalidades comunsAnálise avançada, ferramentas de colaboração em equipa e funcionalidades de segurança reforçadas. |
| Tipo de planoPlano empresarial de grande dimensão | Preço médio$200+/user/month | Funcionalidades comunsIntegrações ilimitadas, apoio dedicado à conta e funcionalidades abrangentes de governação de dados. |
Perguntas frequentes sobre software de painéis de marketing
Eis algumas respostas a perguntas comuns sobre software de painéis de marketing:
Como é que estas plataformas lidam com dados provenientes de vários canais de marketing?
A maioria das plataformas liga-se diretamente a várias fontes de dados, como redes sociais, plataformas de publicidade e ferramentas de e-mail. A qualidade e a velocidade destas ligações variam consoante as integrações da API da ferramenta. Algumas atualizam os dados quase em tempo real, enquanto outras podem sincronizá-los apenas algumas vezes por dia.
São suportadas métricas e KPIs personalizados em diferentes ferramentas?
Muitas plataformas permitem definir métricas personalizadas, mas a flexibilidade depende da forma como a ferramenta processa e visualiza os dados. Algumas exigem conhecimentos de SQL ou a utilização de fórmulas, enquanto outras disponibilizam interfaces de apontar e clicar. O suporte para campos calculados e métricas combinadas varia bastante.
Como são geridos o acesso dos utilizadores e as permissões?
A maioria das ferramentas oferece acesso baseado em funções para controlar quem pode visualizar, editar ou partilhar painéis. As definições de administração variam, sendo que algumas disponibilizam camadas detalhadas de permissões por métrica ou relatório. Outras podem fornecer apenas funções básicas de visualizador/editor.
A ferramenta pode ligar-se diretamente a plataformas de publicidade, como o Google Ads ou o Meta Ads?
Muitas plataformas de painéis oferecem ligações diretas, mas a estabilidade e a profundidade dos dados obtidos variam. Algumas suportam apenas dados ao nível da campanha, enquanto outras analisam também conjuntos de anúncios, palavras-chave e elementos criativos. A frequência das atualizações e as métricas disponíveis também são específicas de cada ferramenta.
Estas ferramentas permitem acompanhar dados históricos?
Sim, embora o período abrangido pelos dados dependa frequentemente da integração e da configuração da sincronização. Algumas ferramentas armazenam os dados históricos internamente, enquanto outras dependem de uma nova obtenção dos dados a partir da fonte. As políticas de retenção de dados e as opções de exportação variam consoante a plataforma.