Octoboard Review: Pros, Cons, Features, and Pricing


Octoboard is an intelligence software that helps marketing managers centralize analytics, automate reporting, and visualize performance data across multiple channels. If you’re struggling to unify data from scattered sources or need to deliver clear, actionable insights to stakeholders, Octoboard offers a straightforward way to build dashboards and automate client or team reports.
In this review, I’ll break down Octoboard’s features, best and worst use cases, pros and cons, and pricing—so you can decide if this intelligence software solution fits your team’s needs.
Octoboard Evaluation Summary
- From €25/month
- 14-day free trial
Why Trust Our Software Reviews
We’ve been testing and reviewing marketing software since 2022. As marketing experts ourselves, we know how critical and difficult it is to make the right decision when selecting software.
We invest in deep research to help our audience make better software purchasing decisions. We’ve tested more than 2,000 tools for different marketing use cases and written over 1,000 comprehensive software reviews. Learn how we stay transparent & our software review methodology.
Octoboard Overview
If you’re judging Octoboard against other intelligence software, I think its automated reporting, easy onboarding, and wide range of integrations make it a strong pick for agencies and marketing teams who want quick, visual insights without a steep learning curve. The interface is intuitive, and pricing is transparent, but customization options can feel limited if you need highly tailored dashboards.
In my experience, Octoboard is best for teams that value speed and simplicity over deep technical control—especially when you need to deliver polished reports to clients or execs with minimal setup.
pros
-
White-label portals enhance client-facing deliverables
-
Real-time dashboards support multi-channel marketing analytics
-
Automated client reporting saves significant time for agencies
cons
-
Dashboard visualizations offer fewer customization options
-
Pricing increases quickly as you add more users or clients
-
Advanced data transformations are limited compared to some tools
-

Eloqua
Visit WebsiteThis is an aggregated rating for this tool including ratings from Crozdesk users and ratings from other sites.4.3 -
Optimizely
Visit WebsiteThis is an aggregated rating for this tool including ratings from Crozdesk users and ratings from other sites.4.2 -
Uberflip
Visit WebsiteThis is an aggregated rating for this tool including ratings from Crozdesk users and ratings from other sites.4.3


How We Test & Score Tools
We’ve spent years building, refining, and improving our software testing and scoring system. The rubric is designed to capture the nuances of software selection and what makes a tool effective, focusing on critical aspects of the decision-making process.
Below, you can see exactly how our testing and scoring works across seven criteria. It allows us to provide an unbiased evaluation of the software based on core functionality, standout features, ease of use, onboarding, customer support, integrations, customer reviews, and value for money.
Core Functionality (25% of final scoring)
The starting point of our evaluation is always the core functionality of the tool. Does it have the basic features and functions that a user would expect to see? Are any of those core features locked to higher-tiered pricing plans? At its core, we expect a tool to stand up against the baseline capabilities of its competitors.
Standout Features (25% of final scoring)
Next, we evaluate uncommon standout features that go above and beyond the core functionality typically found in tools of its kind. A high score reflects specialized or unique features that make the product faster, more efficient, or offer additional value to the user.
We also evaluate how easy it is to integrate with other tools typically found in the tech stack to expand the functionality and utility of the software. Tools offering plentiful native integrations, 3rd party connections, and API access to build custom integrations score best.
Ease of Use (10% of final scoring)
We consider how quick and easy it is to execute the tasks defined in the core functionality using the tool. High scoring software is well designed, intuitive to use, offers mobile apps, provides templates, and makes relatively complex tasks seem simple.
Onboarding (10% of final scoring)
We know how important rapid team adoption is for a new platform, so we evaluate how easy it is to learn and use a tool with minimal training. We evaluate how quickly a team member can get set up and start using the tool with no experience. High scoring solutions indicate little or no support is required.
Customer Support (10% of final scoring)
We review how quick and easy it is to get unstuck and find help by phone, live chat, or knowledge base. Tools and companies that provide real-time support score best, while chatbots score worst.
Customer Reviews (10% of final scoring)
Beyond our own testing and evaluation, we consider the net promoter score from current and past customers. We review their likelihood, given the option, to choose the tool again for the core functionality. A high scoring software reflects a high net promoter score from current or past customers.
Value for Money (10% of final scoring)
Lastly, in consideration of all the other criteria, we review the average price of entry level plans against the core features and consider the value of the other evaluation criteria. Software that delivers more, for less, will score higher.
Core Features
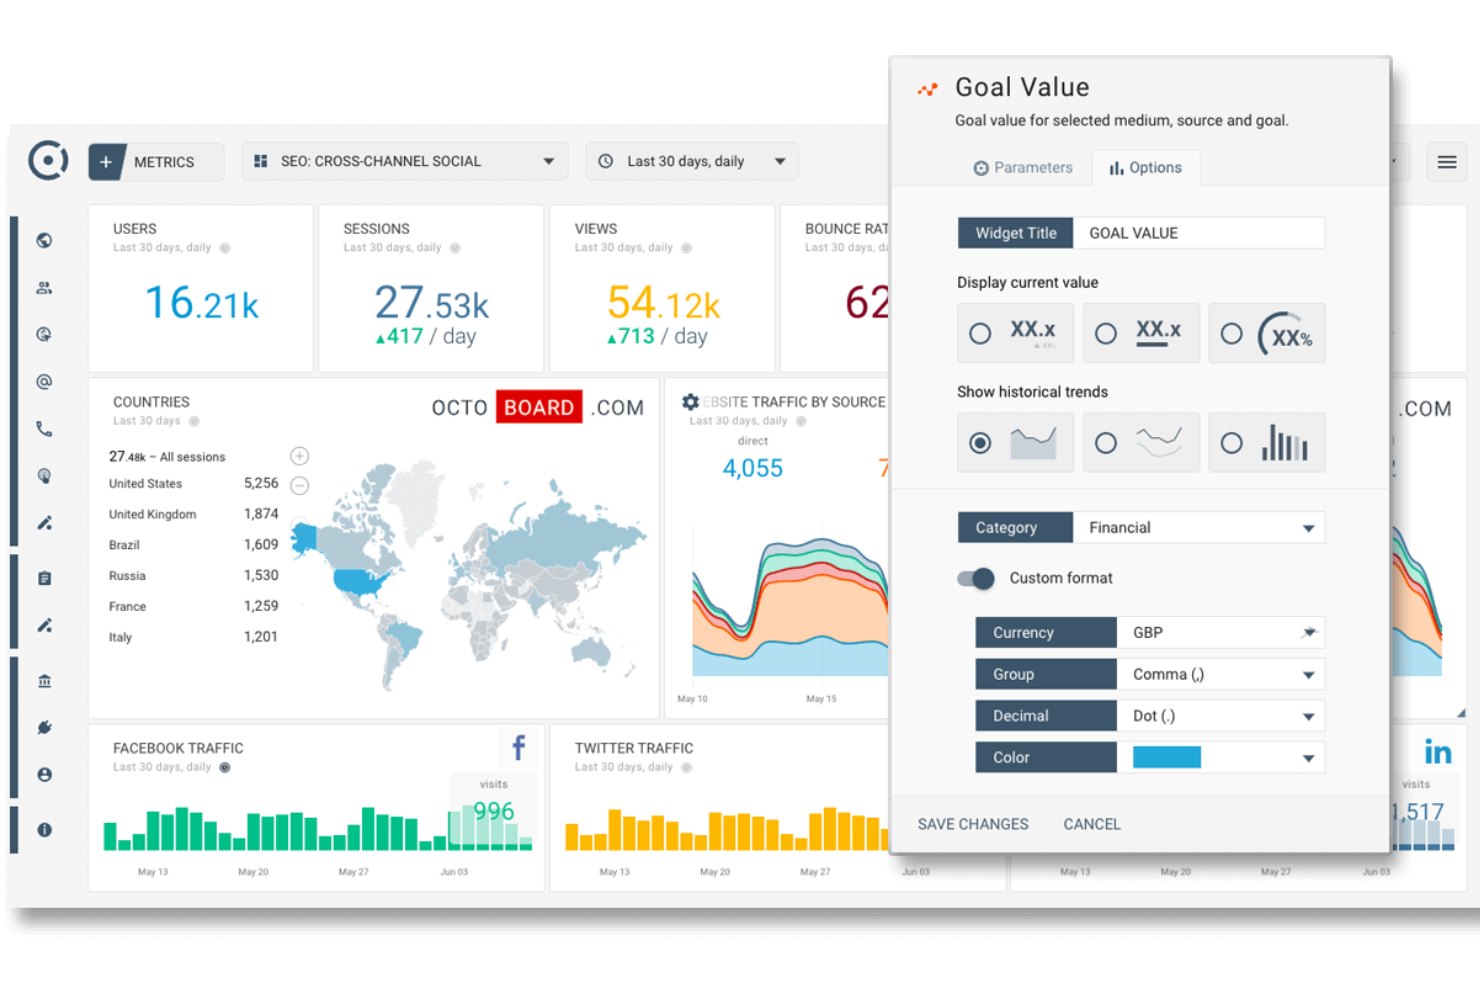
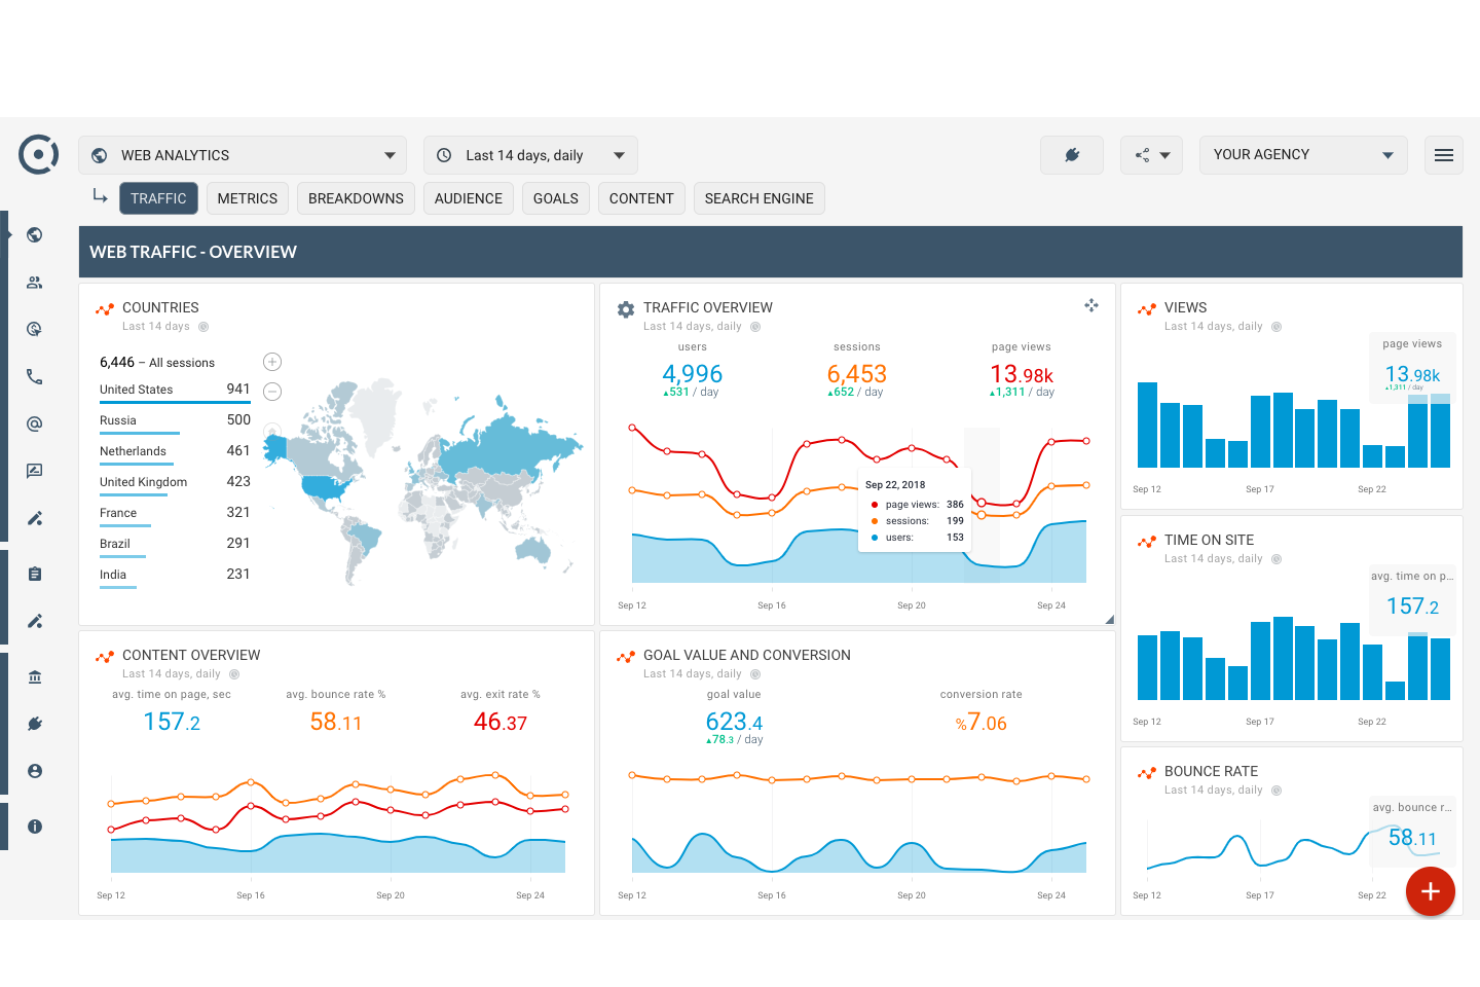
Real-Time Marketing Dashboards
Visualize multi-channel marketing data in live dashboards for instant insights. Users can monitor campaign performance and website analytics in one place.
Automated SEO, PPC, SEM Reports
Schedule and deliver branded reports to clients or stakeholders automatically. This saves time and ensures consistent, up-to-date reporting.
White Label Client Portals
Create custom-branded portals for clients to access their analytics. This feature helps agencies deliver a professional, client-focused experience.
Keyword Rank Tracker
Track keyword rankings and SEO performance across search engines. Users can quickly spot trends and adjust strategies as needed.
Customer Segmentation and Analytics
Segment customers by behavior, engagement, or demographics for targeted analysis. This supports more personalized marketing and retention efforts.
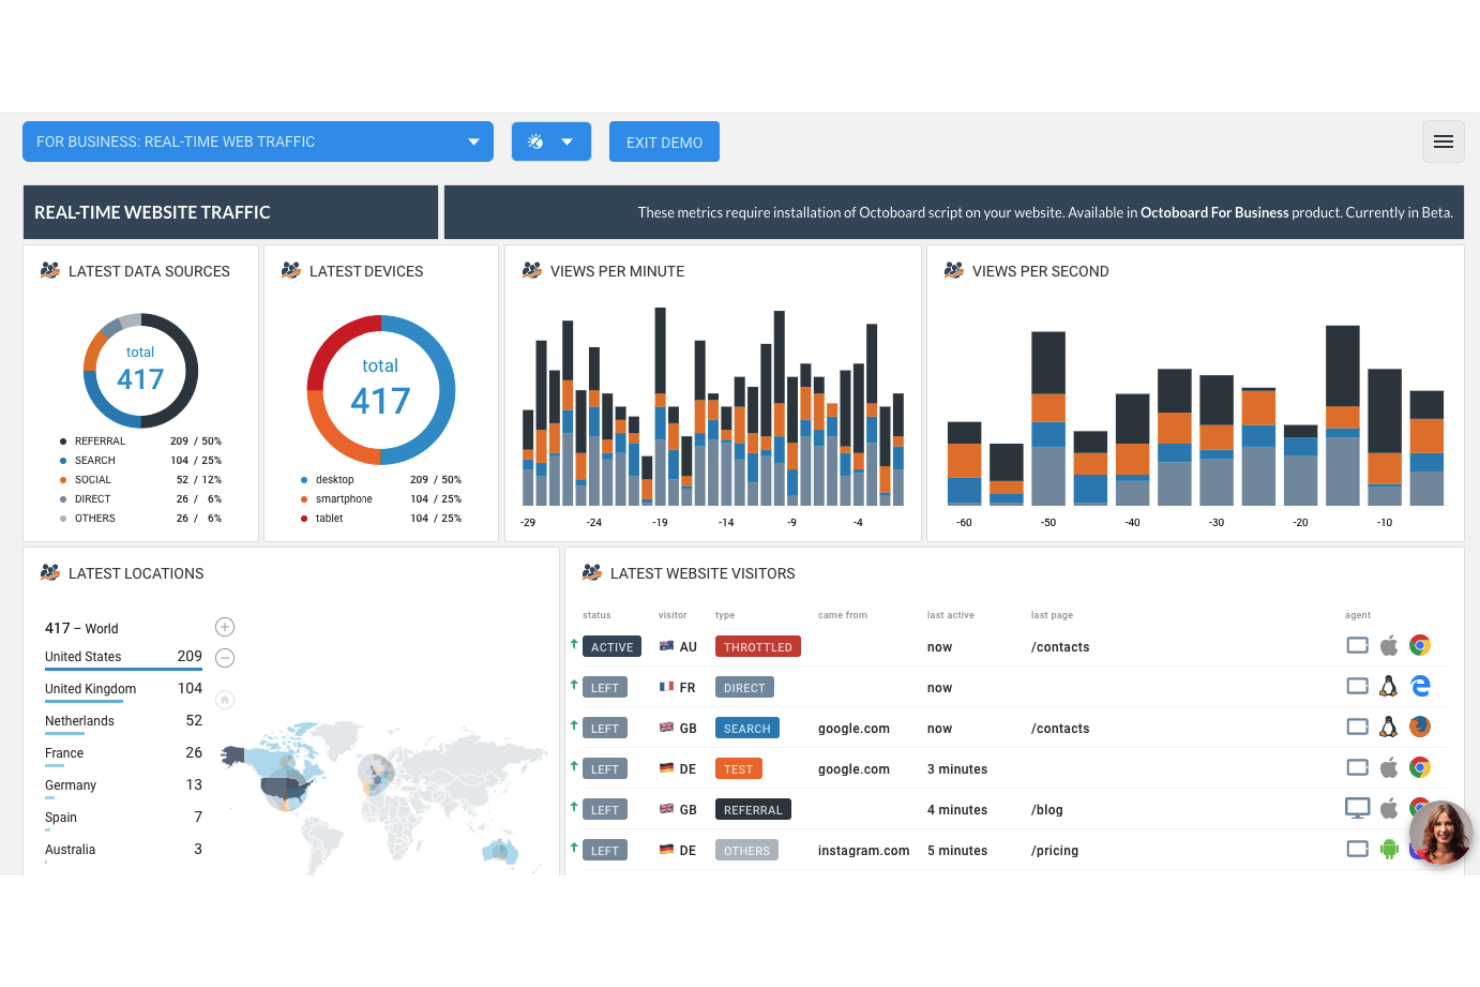
Live Web Page Heatmaps
See how visitors interact with your website through real-time heatmaps. This helps teams identify high- and low-engagement areas for optimization.
Ease of Use
Octoboard is user-friendly, with a clean interface and intuitive dashboard setup that most teams can navigate without training. Users often mention how quickly they can build reports and automate recurring tasks, thanks to pre-built templates and drag-and-drop widgets.
While advanced users may want deeper customization, I think most marketing teams will appreciate how little time it takes to get actionable insights and deliver polished reports to clients or stakeholders.
Integrations
Octoboard integrates with Google Analytics, Facebook Ads, Google Ads, LinkedIn, Instagram, Twitter, YouTube, Stripe, WooCommerce, and Google Sheets, among others.
Octoboard also offers an API and supports sending data to Google Sheets and Google BigQuery for further integration and automation.

Octoboard Specs
- 2-Factor Authentication
- A/B Testing
- Analytics
- API
- BitCoin
- Conversion Tracking
- Dashboard
- Data Export
- Data Import
- Data Visualization
- Design Templates
- External Integrations
- Inventory Tracking
- Keyword Tracking
- Marketing Automation
- Multi-User
- Notifications
- Order Management
- Payment Gateway Integration
- Payment Processor
- PayPal
- Product Catalog
- Review Monitoring
- SAP Integration
- Scheduling
- Stripe
- Third-Party Plugins/Add-Ons