

Recensione Whatagraph: Pro, Contro, Funzionalità e Prezzi
Whatagraph si distingue per la reportistica cross-channel senza sforzo, ma se desideri una personalizzazione profonda o analisi avanzate, potresti volerci pensare due volte prima di immergerti.

Recensiamo gli strumenti in modo indipendente, e le commissioni aiutano a finanziare i nostri test. Consulta la nostra politica sulla trasparenza, la nostra metodologia o suggerisci uno strumento.
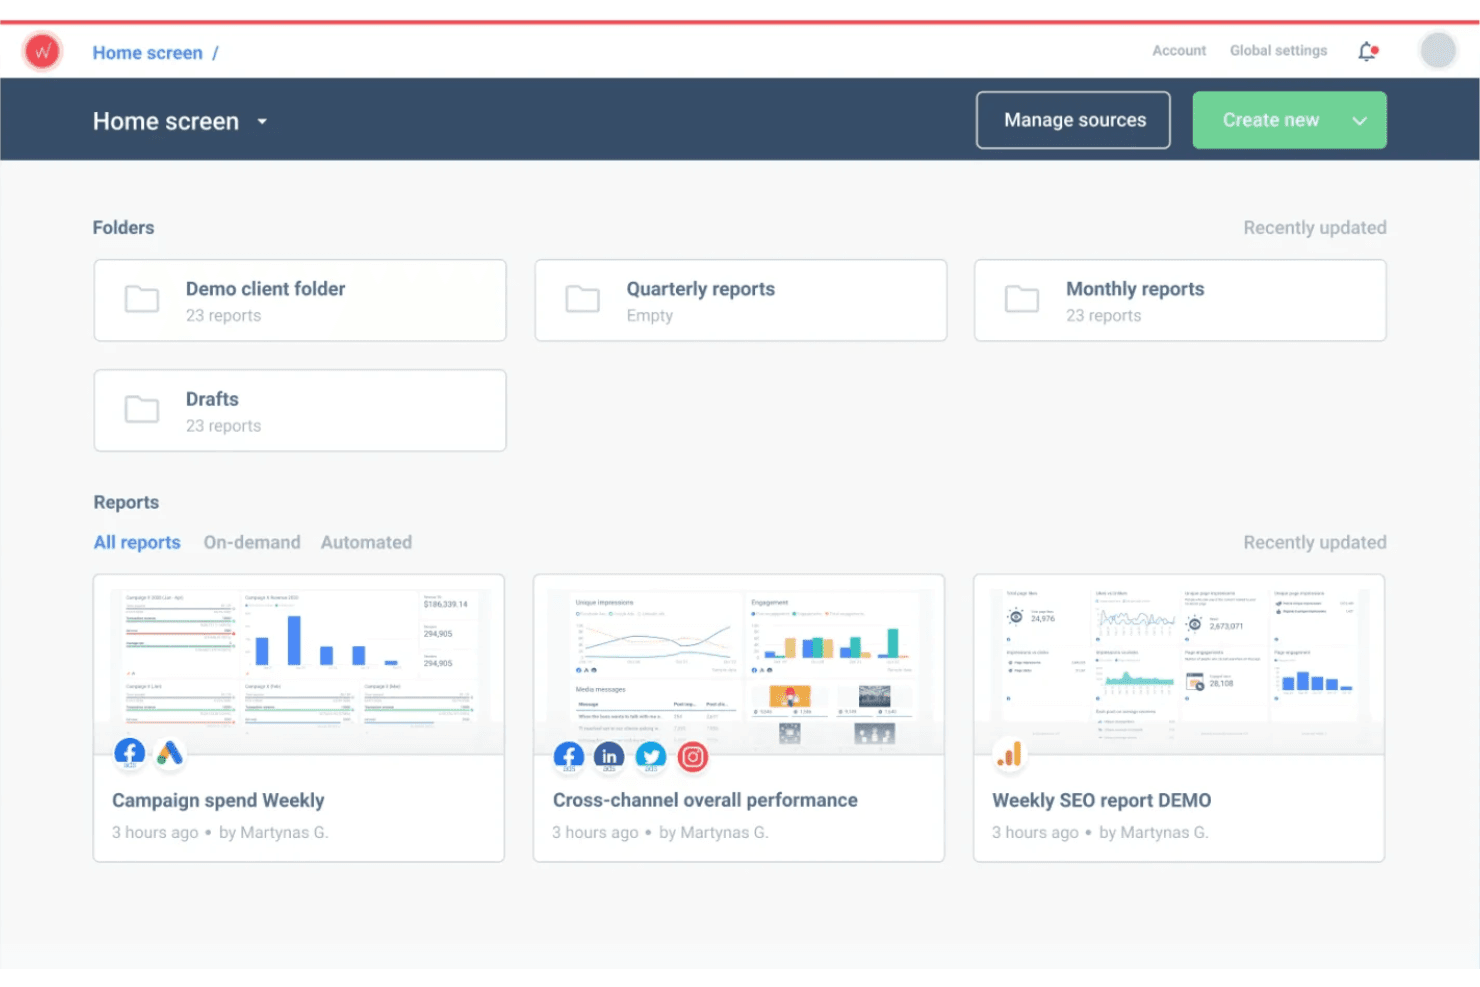
Whatagraph is a marketing intelligence software built for marketing teams and agencies that need to consolidate cross-channel data into a single reporting layer. It's worth a close look if you're outgrowing tools like Looker Studio—Whatagraph comes with pre-built channel connectors and client-ready report templates, so you're not spending hours on manual data wiring just to get a dashboard that works.
Whatagraph Evaluation Summary
4.5/5
- From $812/month (billed annually)
- Free demo available
Perché fidarsi dei nostri consigli sui software
6,700+
Reviews
20
Industry experts
16+
Evaluation factors
14
Years
Il nostro team testa e recensisce software dal 2012. In quanto leader del marketing noi stessi, sappiamo quanto sia difficile — e importante — scegliere il software giusto.
Per questa guida, abbiamo valutato gli strumenti attraverso test pratici e ricerche indipendenti, assegnando un punteggio agli strumenti in base ai nostri criteri di selezione.
Le nostre recensioni riflettono il nostro giudizio editoriale umano, non un discorso di vendita.
Revisori esperti:
 Gui DrusinaDirettore creativo
- Shriya GhateSenior Marketing Lead
 Amanda JacquesResponsabile Marketing Ops

Whatagraph Overview
If you’re judging Whatagraph against other marketing intelligence platforms, I think its intuitive interface and quick onboarding set it apart. The drag-and-drop report builder and wide range of integrations make it easy to pull data from multiple sources. Pricing is mid-tier, but you get strong support and automation features.
It’s not the best fit if you need deep data modeling or custom metrics, but for agencies or teams who want fast, visual reporting without a steep learning curve, Whatagraph is a smart pick. I’d suggest it for marketing teams managing multiple client accounts or channels.
Pros
- Customer support is responsive and knowledgeable
- Visual report builder supports fast client-ready dashboards
- Automated cross-channel reporting saves significant time
Cons
- Pricing is higher than some similar reporting tools
- Filtering and segmentation features can feel restrictive
- Limited options for advanced data modeling and calculations
Is Whatagraph Right For Your Needs?
Who Would be a Good Fit for Whatagraph?
Whatagraph is a strong choice for teams that need to automate multi-channel marketing reports and share visual dashboards with clients or stakeholders. Agencies, digital marketing teams, and departments managing multiple brands or campaigns will get the most value from its automated reporting, pre-built templates, and easy data visualization. If your work involves frequent client communication or you need to quickly turn complex data into clear, shareable insights, Whatagraph’s features are going to save you time and keep your reporting consistent.
- Small to Mid-Sized CompaniesUser-friendly setup and automation reduce manual reporting work.
- Social Media ManagersPre-built templates speed up social and ad performance reporting.
- Franchise BusinessesRoll-up reporting makes it easy to compare multiple locations.
- E-commerce BrandsMulti-channel data connectors support tracking sales and ad spend.
- In-House Marketing TeamsCentralized reporting across channels helps teams track campaign performance.
- Marketing AgenciesAutomated client reporting and white-label dashboards simplify agency workflows.
Who Would be a Bad Fit for Whatagraph?
Whatagraph isn’t ideal for organizations that need highly customized analytics, deep data modeling, or advanced segmentation. If your team relies on granular data manipulation, complex calculations, or needs to integrate with niche data sources, you’ll likely find Whatagraph’s feature set limiting. Large enterprises with strict data governance or companies needing real-time analytics may also want to look elsewhere for a more specialized solution.
- IT DepartmentsNo support for technical monitoring or infrastructure data sources.
- B2B SaaS CompaniesAccount-based reporting and segmentation options are basic.
- Healthcare OrganizationsLimited compliance features for sensitive or regulated data.
- Financial ServicesDoes not offer granular, real-time financial data integrations.
- Data Science TeamsLacks support for complex calculations and predictive modeling.
- Large EnterprisesAdvanced analytics and custom data modeling are limited.
Come Testiamo e Valutiamo gli Strumenti
Abbiamo passato anni a costruire, perfezionare e migliorare il nostro sistema di test e valutazione del software. Il nostro metodo è progettato per cogliere le sfumature nella selezione del software e ciò che rende uno strumento efficace, concentrandoci sugli aspetti critici del processo decisionale. Qui sotto puoi vedere esattamente come funziona il nostro sistema di test e valutazione su sette criteri. Questo ci permette di offrire una valutazione imparziale del software basata su funzionalità principali, funzioni distintive, facilità d’uso, onboarding, supporto clienti, integrazioni, recensioni dei clienti e rapporto qualità-prezzo.
Funzionalità principali (25% del punteggio finale)
Il punto di partenza della nostra valutazione è sempre la funzionalità principale dello strumento. Include le caratteristiche e le funzioni basilari che un utente si aspetterebbe di trovare? Alcune di queste funzionalità sono bloccate nei piani premium? Ci aspettiamo che ogni strumento soddisfi almeno le capacità di base dei suoi concorrenti.
Funzionalità distintive (25% del punteggio finale)
Successivamente, valutiamo le funzionalità uniche che vanno oltre la normale funzionalità principale, quelle poco comuni negli strumenti simili. Un punteggio alto riflette caratteristiche specializzate o uniche che rendono il prodotto più veloce, efficiente o offrono un valore aggiunto all’utente. Valutiamo anche quanto sia semplice integrare il software con altri strumenti abitualmente usati in una tech stack, per espandere le funzionalità e l’utilità del prodotto. Sono valutate positivamente soluzioni con molte integrazioni native, connessioni di terze parti e API per creare integrazioni personalizzate.
Facilità d’uso (10% del punteggio finale)
Consideriamo la rapidità e semplicità con cui si possono eseguire le attività principali tramite lo strumento. I software con punteggio più alto sono ben progettati, intuitivi, dispongono di app mobili, offrono template e semplificano compiti complessi.
Onboarding (10% del punteggio finale)
Sappiamo quanto sia importante l’adozione rapida in azienda, quindi valutiamo la facilità di apprendimento e utilizzo di uno strumento con formazione minima. Analizziamo quanto velocemente un utente senza esperienza può iniziare a usare il software. Le soluzioni migliori richiedono poco o nessun supporto.
Supporto clienti (10% del punteggio finale)
Analizziamo la rapidità e facilità nel trovare aiuto tramite telefono, chat dal vivo o knowledge base. Gli strumenti che offrono supporto in tempo reale ottengono il punteggio migliore: i chatbot invece i peggiori.
Recensioni dei clienti (10% del punteggio finale)
Oltre ai nostri test, consideriamo il net promoter score di attuali ed ex clienti. Valutiamo la probabilità che, potendo scegliere, l’utente decida di utilizzare ancora quello strumento per le funzionalità principali. Un software con un punteggio alto corrisponde ad un alto net promoter score tra clienti attuali o passati.
Rapporto qualità-prezzo (10% del punteggio finale)
Infine, tenendo conto di tutti gli altri criteri, confrontiamo il prezzo medio dei piani base rispetto alle funzionalità principali e agli altri fattori di valutazione. I software che offrono di più, a meno, ottengono i punteggi più alti.
Core Features
Automated Report Generation
Create and schedule marketing reports that update with the latest data, saving hours on manual work.
AI-Powered Insights
Get instant summaries and actionable insights from your marketing data using built-in AI tools.
Drag-and-Drop Report Builder
Build custom dashboards and reports visually, with no coding or technical skills required.
White-Label Reporting
Brand your reports with custom logos and colors for client-ready presentations.
Multi-Channel Data Aggregation
Combine data from all your marketing channels into a single, unified dashboard.
Pre-Built Templates
Start reporting quickly with templates designed for common marketing use cases like social, PPC, and web analytics.
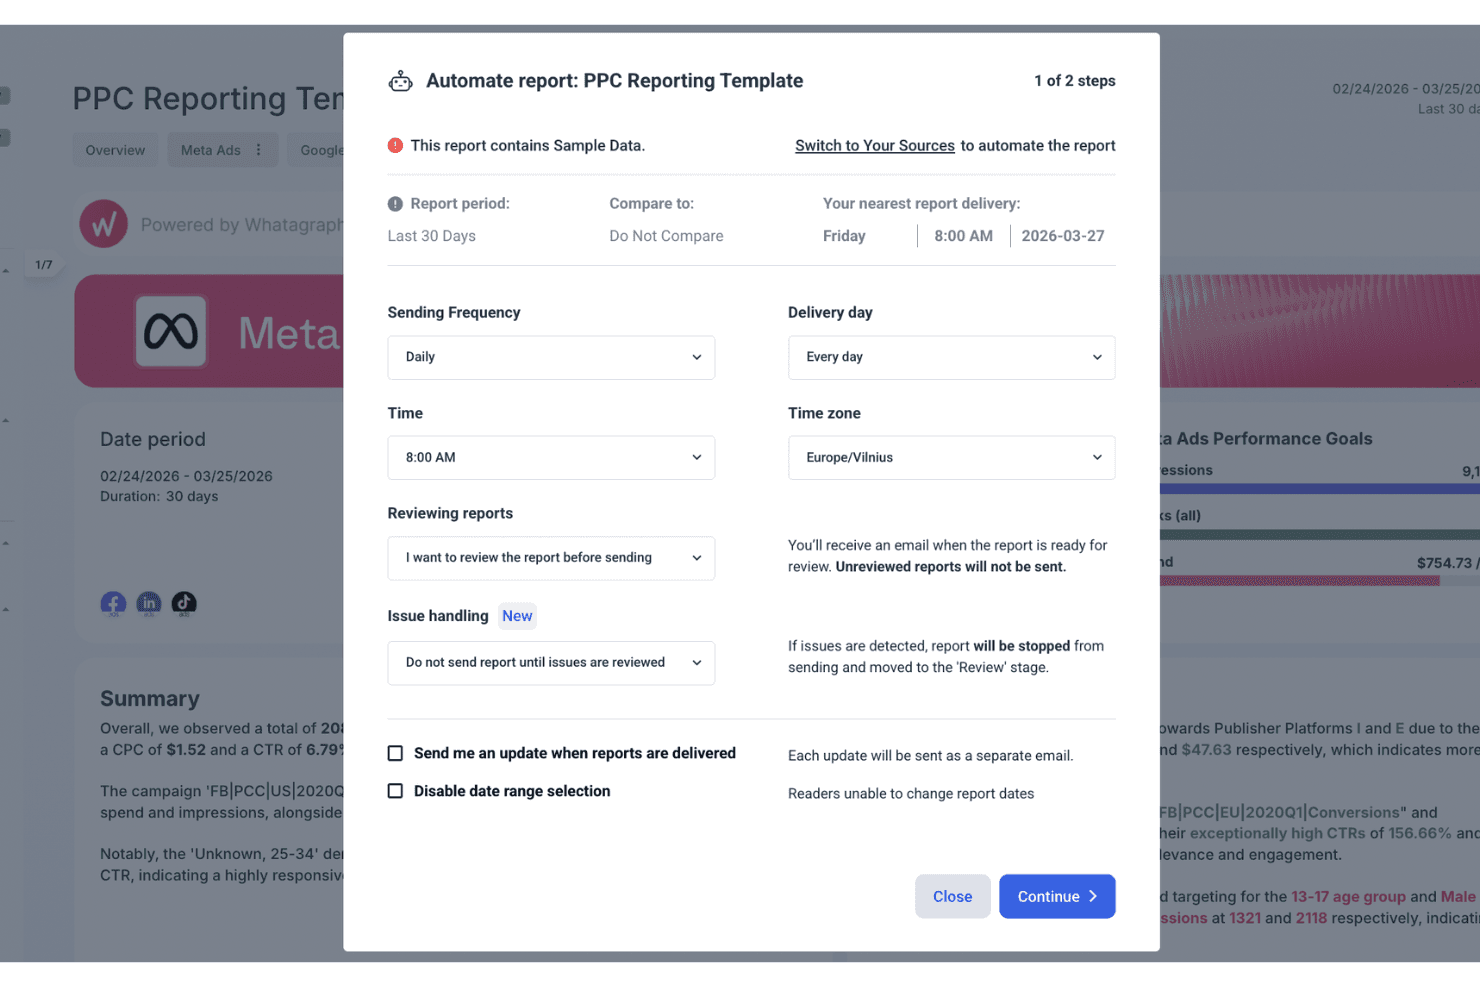
Ease of Use
Whatagraph is one of the most approachable marketing intelligence platforms for non-technical users. The drag-and-drop builder, clear navigation, and pre-built templates make setup fast, even for first-timers.
Users often mention how quickly they can create and share reports without needing help from IT or data specialists. I think the intuitive interface and guided onboarding really lower the barrier for busy marketing teams who want actionable insights without a steep learning curve.

Integrations
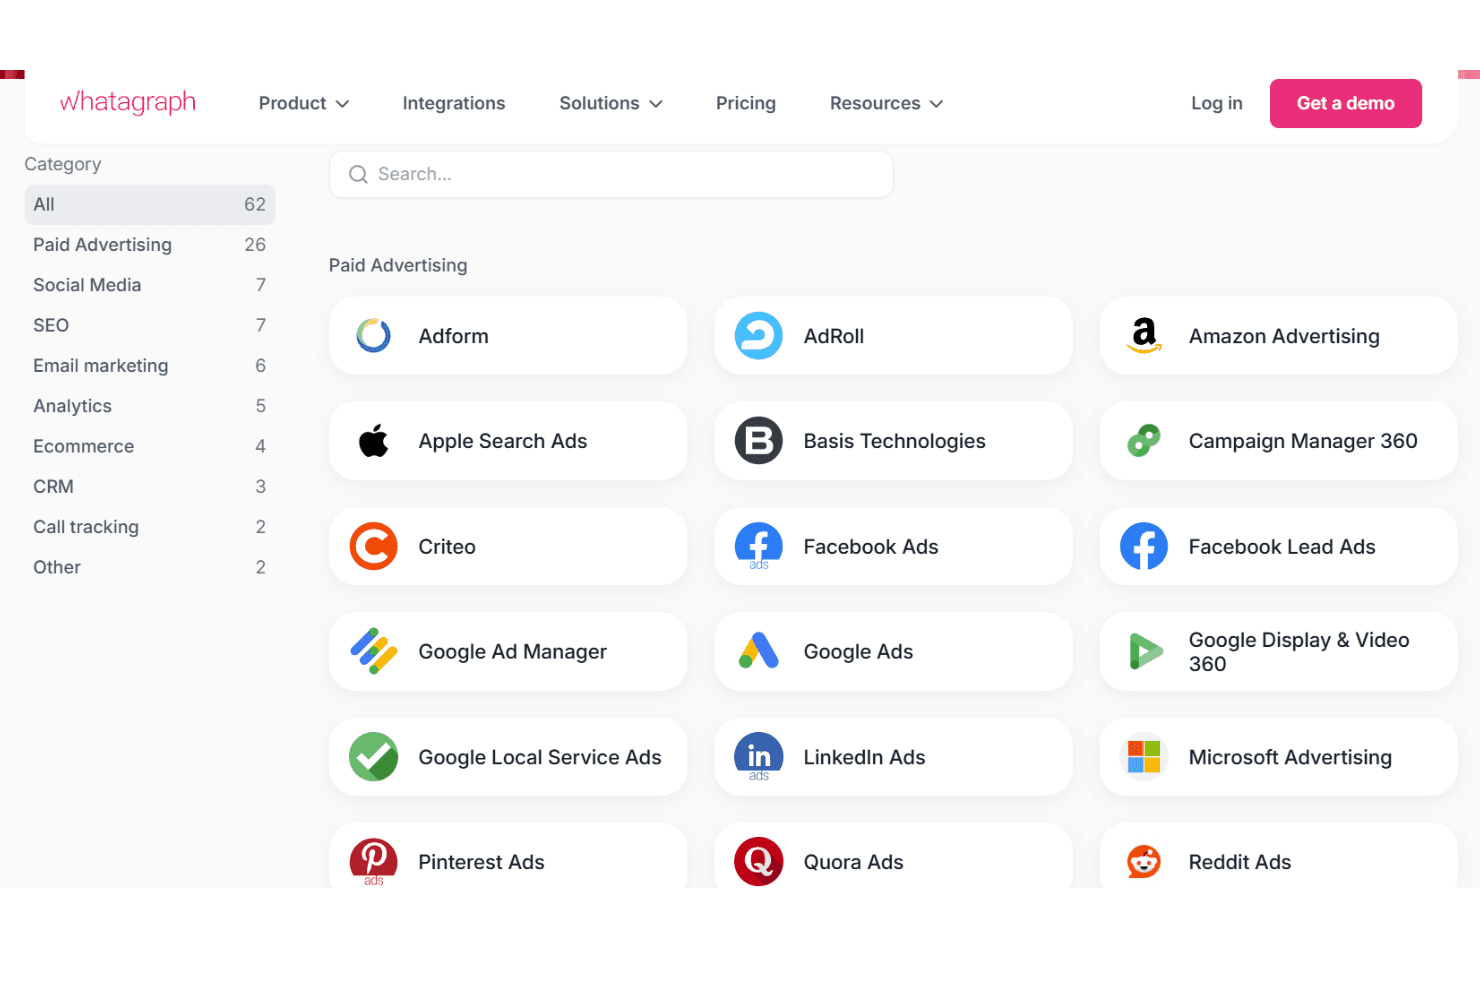
Whatagraph integrates with Google Analytics 4, Facebook Ads, Instagram, LinkedIn Ads, Shopify, HubSpot, Mailchimp, Google Ads, TikTok Ads, and Salesforce, among others.
Whatagraph also offers a custom API and connects with Google Sheets and BigQuery for additional data sources.
Whatagraph Specs
- API: No
- Audience Targeting: Yes
- Brand Management: No
- Conversion Tracking: Yes
- Data Export: Yes
- Data Import: Yes
- External Integrations: Yes
- Keyword Tracking: Yes
- Lead Management: Yes
- Lead Scoring: Yes
- Link Tracking: Yes
- Marketing Automation: Yes
- Multi-User: Yes
- Net Promoter Score: No
- Notifications: Yes
- Social-Media Integration: Yes


