

Whatagraph Test 2026: Vorteile, Nachteile, Funktionen und Preise
Whatagraph überzeugt durch unkompliziertes kanalübergreifendes Reporting und ermöglicht es, mühelos übersichtliche und präsentationsbereite Marketingberichte über verschiedene Plattformen hinweg zu erstellen.

Wir bewerten Tools unabhängig, und Provisionen helfen, unsere Tests zu finanzieren. Siehe unsere Transparenz-Richtlinie, unsere Methodik oder schlagen Sie ein Tool vor.
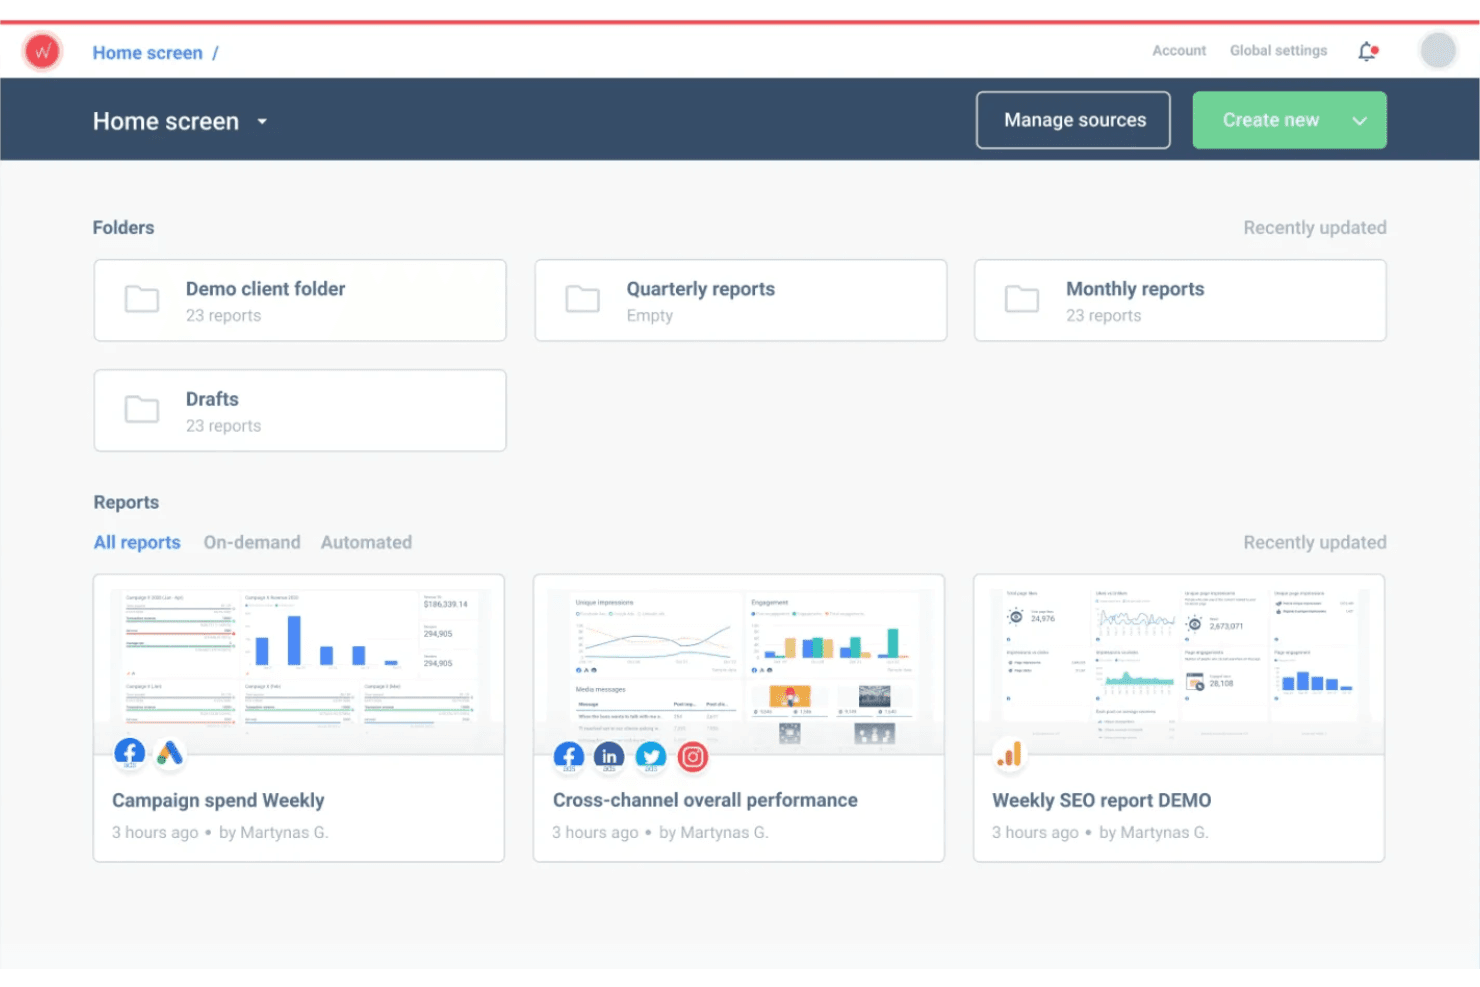
Whatagraph is a marketing intelligence software built for marketing teams and agencies that need to consolidate cross-channel data into a single reporting layer. It's worth a close look if you're outgrowing tools like Looker Studio—Whatagraph comes with pre-built channel connectors and client-ready report templates, so you're not spending hours on manual data wiring just to get a dashboard that works.
Whatagraph Evaluation Summary
4.5/5
- From $812/month (billed annually)
- Free demo available
Warum Sie unseren Software-Empfehlungen vertrauen können
6,700+
Reviews
20
Industry experts
16+
Evaluation factors
14
Years
Unser Team testet und bewertet Software seit 2012. Als Marketingführungskräfte wissen wir selbst, wie schwierig – und wichtig – es ist, die richtige Software auszuwählen.
Für diesen Leitfaden haben wir Tools mithilfe von praktischen Tests und unabhängiger Recherche bewertet und dabei unsere Bewertungskriterien angewendet.
Unsere Bewertungen spiegeln unser menschliches redaktionelles Urteilsvermögen wider, keine Verkaufsstrategie.
Expertenprüfer:
 Gui DrusinaKreativdirektor
- Shriya GhateSenior Marketing Lead
 Amanda JacquesMarketing Ops Leiterin

Whatagraph Overview
If you’re judging Whatagraph against other marketing intelligence platforms, I think its intuitive interface and quick onboarding set it apart. The drag-and-drop report builder and wide range of integrations make it easy to pull data from multiple sources. Pricing is mid-tier, but you get strong support and automation features.
It’s not the best fit if you need deep data modeling or custom metrics, but for agencies or teams who want fast, visual reporting without a steep learning curve, Whatagraph is a smart pick. I’d suggest it for marketing teams managing multiple client accounts or channels.
Pros
- Customer support is responsive and knowledgeable
- Visual report builder supports fast client-ready dashboards
- Automated cross-channel reporting saves significant time
Cons
- Pricing is higher than some similar reporting tools
- Filtering and segmentation features can feel restrictive
- Limited options for advanced data modeling and calculations
Is Whatagraph Right For Your Needs?
Who Would be a Good Fit for Whatagraph?
Whatagraph is a strong choice for teams that need to automate multi-channel marketing reports and share visual dashboards with clients or stakeholders. Agencies, digital marketing teams, and departments managing multiple brands or campaigns will get the most value from its automated reporting, pre-built templates, and easy data visualization. If your work involves frequent client communication or you need to quickly turn complex data into clear, shareable insights, Whatagraph’s features are going to save you time and keep your reporting consistent.
- Small to Mid-Sized CompaniesUser-friendly setup and automation reduce manual reporting work.
- Social Media ManagersPre-built templates speed up social and ad performance reporting.
- Franchise BusinessesRoll-up reporting makes it easy to compare multiple locations.
- E-commerce BrandsMulti-channel data connectors support tracking sales and ad spend.
- In-House Marketing TeamsCentralized reporting across channels helps teams track campaign performance.
- Marketing AgenciesAutomated client reporting and white-label dashboards simplify agency workflows.
Who Would be a Bad Fit for Whatagraph?
Whatagraph isn’t ideal for organizations that need highly customized analytics, deep data modeling, or advanced segmentation. If your team relies on granular data manipulation, complex calculations, or needs to integrate with niche data sources, you’ll likely find Whatagraph’s feature set limiting. Large enterprises with strict data governance or companies needing real-time analytics may also want to look elsewhere for a more specialized solution.
- IT DepartmentsNo support for technical monitoring or infrastructure data sources.
- B2B SaaS CompaniesAccount-based reporting and segmentation options are basic.
- Healthcare OrganizationsLimited compliance features for sensitive or regulated data.
- Financial ServicesDoes not offer granular, real-time financial data integrations.
- Data Science TeamsLacks support for complex calculations and predictive modeling.
- Large EnterprisesAdvanced analytics and custom data modeling are limited.
Wie wir Tools testen und bewerten
Wir haben jahrelang unser Software-Test- und Bewertungssystem aufgebaut, verfeinert und verbessert. Das Bewertungsraster wurde entwickelt, um die Feinheiten der Softwareauswahl zu erfassen und aufzuzeigen, was ein Tool effektiv macht. Dabei konzentrieren wir uns auf kritische Aspekte des Entscheidungsprozesses. Im Folgenden können Sie genau nachvollziehen, wie unsere Tests und Bewertungen über sieben Kriterien hinweg funktionieren. Dies ermöglicht eine unparteiische Bewertung der Software basierend auf Kernfunktionen, besonderen Merkmalen, Benutzerfreundlichkeit, Onboarding, Kundenservice, Integrationen, Kundenrezensionen und Preis-Leistung.
Kernfunktionen (25% der Gesamtbewertung)
Der Ausgangspunkt unserer Bewertung ist stets die Kernfunktionalität des Tools. Verfügt es über die grundlegenden Merkmale und Funktionen, die ein Nutzer erwarten würde? Sind einige dieser Kernfunktionen nur in hochpreisigen Tarifen verfügbar? Im Kern erwarten wir, dass ein Tool den Basisfunktionen der Konkurrenz standhält.
Besondere Merkmale (25% der Gesamtbewertung)
Als nächstes bewerten wir außergewöhnliche, herausragende Funktionen, die über die übliche Kernfunktionalität hinausgehen. Eine hohe Punktzahl spiegelt spezialisierte oder einzigartige Merkmale wider, die das Produkt schneller, effizienter oder wertvoller für den Nutzer machen. Wir bewerten außerdem, wie einfach es ist, das Tool in andere häufig verwendete Anwendungen im Tech-Stack zu integrieren, um die Funktionalität und den Nutzen der Software zu erweitern. Tools, die viele native Integrationen, Drittanbieter-Anbindungen sowie API-Zugriff für eigene Integrationen bieten, schneiden am besten ab.
Benutzerfreundlichkeit (10% der Gesamtbewertung)
Wir berücksichtigen, wie schnell und einfach sich Aufgaben, die zu den Kernfunktionen gehören, mit dem Tool ausführen lassen. Hoch bewertete Software ist gut gestaltet, intuitiv bedienbar, bietet mobile Apps, Vorlagen und lässt auch komplexe Aufgaben einfach erscheinen.
Onboarding (10% der Gesamtbewertung)
Uns ist bewusst, wie wichtig eine schnelle Akzeptanz im Team für eine neue Plattform ist. Daher bewerten wir, wie leicht sich das Tool mit minimaler Einweisung erlernen und anwenden lässt und wie schnell Teammitglieder auch ohne Vorerfahrung loslegen können. Eine hohe Punktzahl deutet darauf hin, dass kaum oder gar keine Unterstützung notwendig ist.
Kundenservice (10% der Gesamtbewertung)
Wir prüfen, wie schnell und einfach es ist, bei Problemen Hilfe per Telefon, Live-Chat oder Wissensdatenbank zu erhalten. Tools und Unternehmen, die Support in Echtzeit anbieten, erhalten die besten Bewertungen; Chatbots schneiden am schlechtesten ab.
Kundenrezensionen (10% der Gesamtbewertung)
Neben unseren eigenen Tests und Bewertungen berücksichtigen wir den Net Promoter Score aktueller und ehemaliger Kunden. Wir prüfen, wie wahrscheinlich sie sich erneut für das Tool bezüglich der Kernfunktionen entscheiden würden. Hoch bewertete Software spiegelt einen hohen Net Promoter Score der Nutzer wider.
Preis-Leistung (10% der Gesamtbewertung)
Abschließend bewerten wir unter Berücksichtigung aller anderen Kriterien den Durchschnittspreis der Einsteiger-Tarife im Verhältnis zu den Kernfunktionen sowie den Wert der anderen bewerteten Aspekte. Software, die mehr für weniger bietet, wird besser bewertet.
Core Features
Automated Report Generation
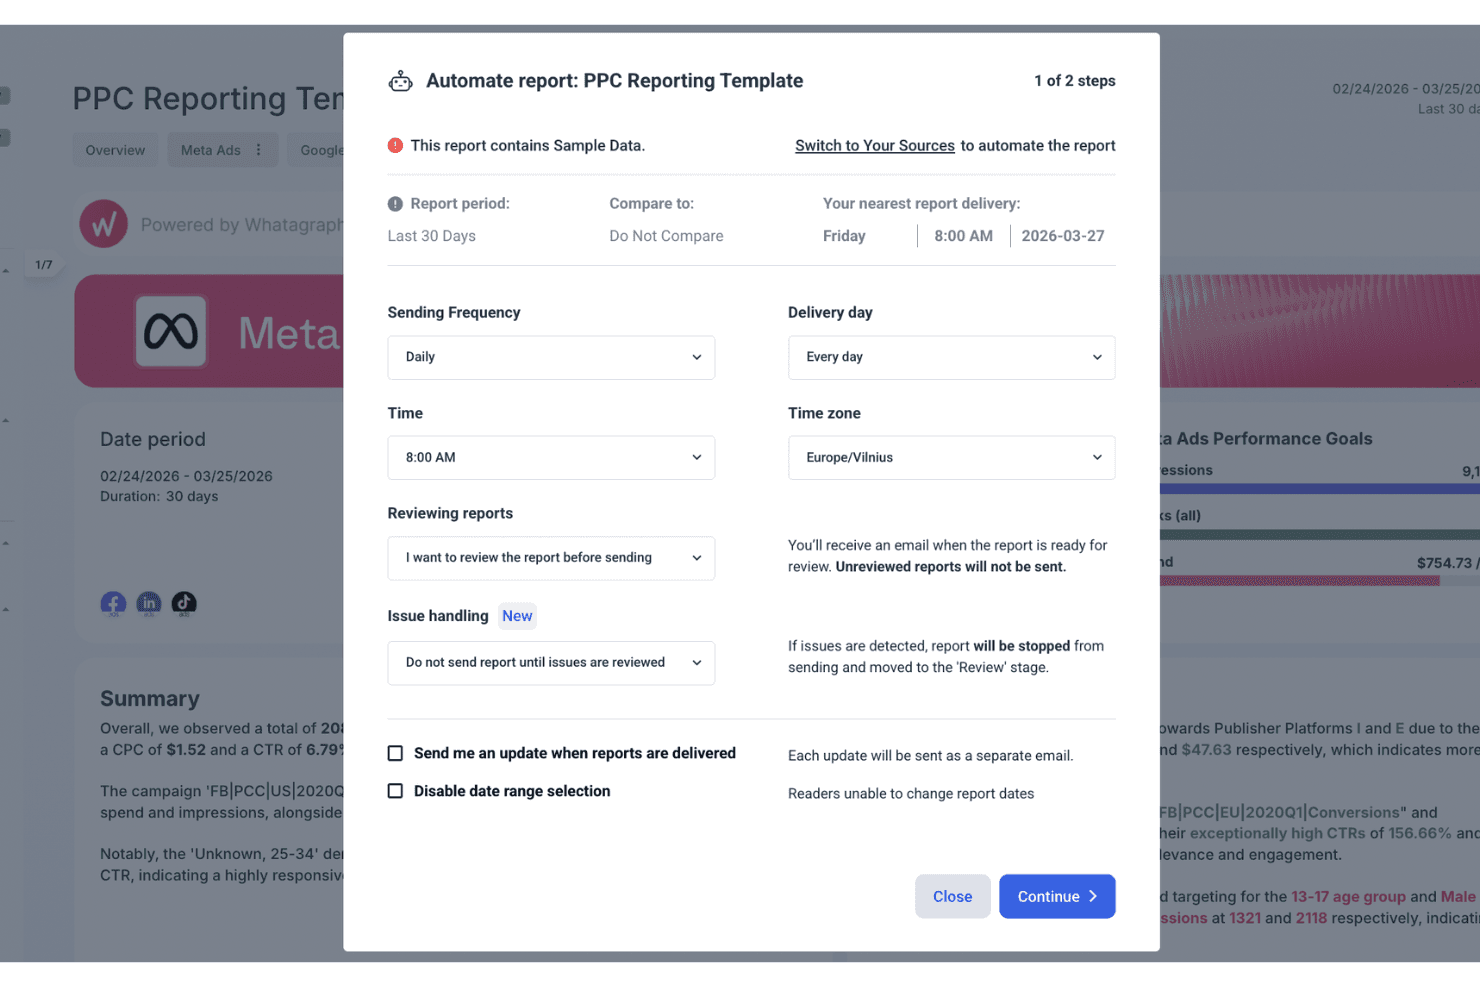
Create and schedule marketing reports that update with the latest data, saving hours on manual work.
AI-Powered Insights
Get instant summaries and actionable insights from your marketing data using built-in AI tools.
Drag-and-Drop Report Builder
Build custom dashboards and reports visually, with no coding or technical skills required.
White-Label Reporting
Brand your reports with custom logos and colors for client-ready presentations.
Multi-Channel Data Aggregation
Combine data from all your marketing channels into a single, unified dashboard.
Pre-Built Templates
Start reporting quickly with templates designed for common marketing use cases like social, PPC, and web analytics.
Ease of Use
Whatagraph is one of the most approachable marketing intelligence platforms for non-technical users. The drag-and-drop builder, clear navigation, and pre-built templates make setup fast, even for first-timers.
Users often mention how quickly they can create and share reports without needing help from IT or data specialists. I think the intuitive interface and guided onboarding really lower the barrier for busy marketing teams who want actionable insights without a steep learning curve.

Integrations
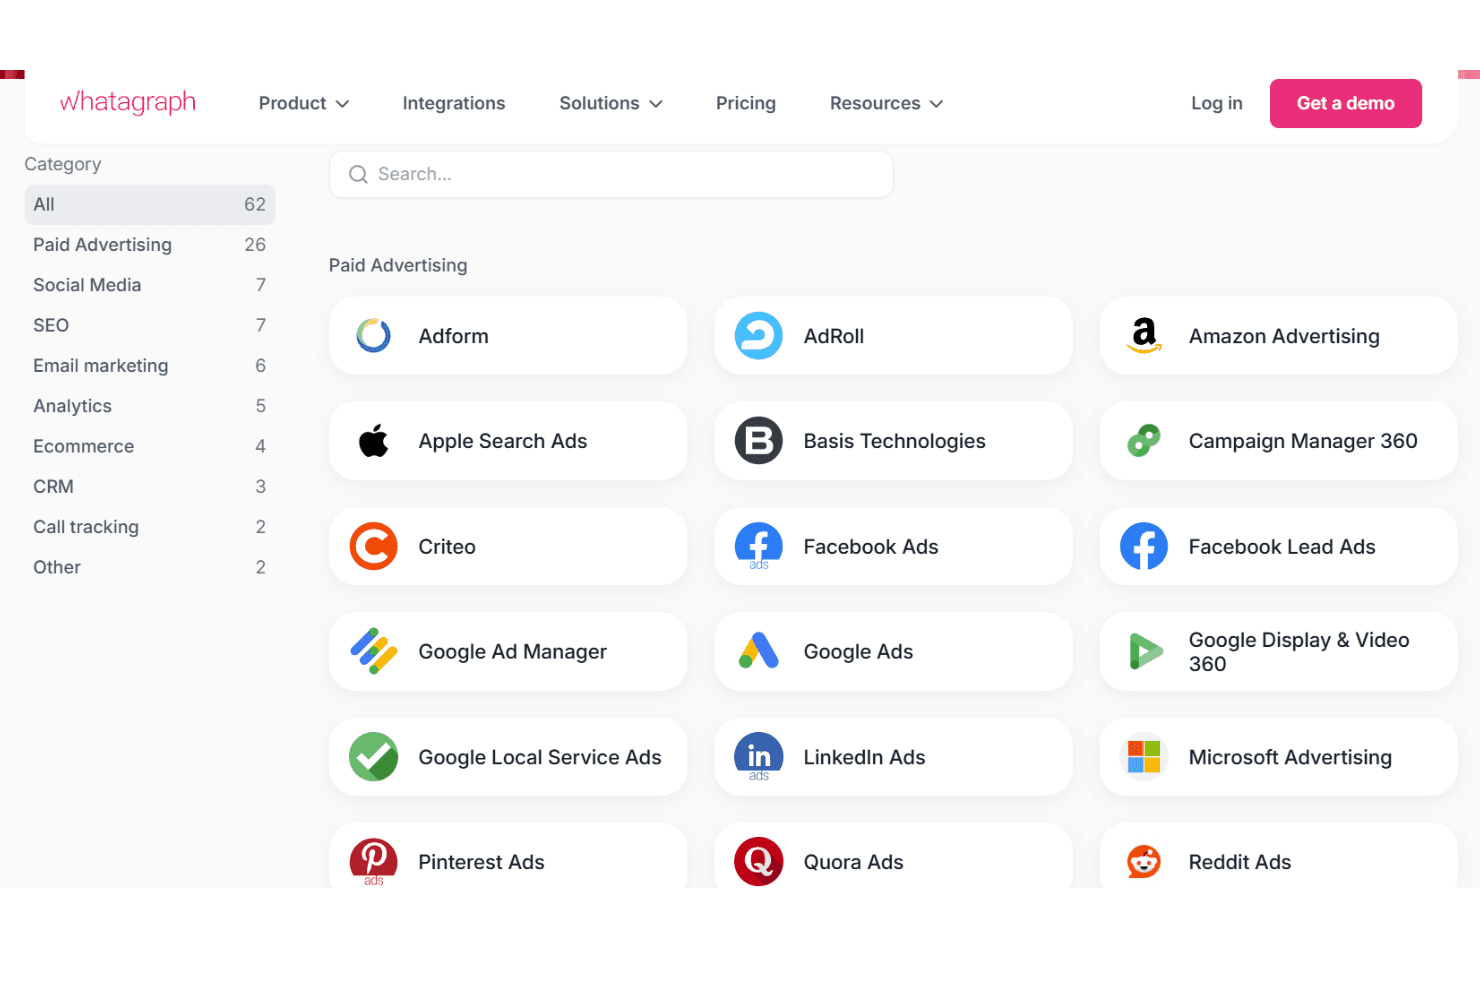
Whatagraph integrates with Google Analytics 4, Facebook Ads, Instagram, LinkedIn Ads, Shopify, HubSpot, Mailchimp, Google Ads, TikTok Ads, and Salesforce, among others.
Whatagraph also offers a custom API and connects with Google Sheets and BigQuery for additional data sources.
Whatagraph Specs
- API: No
- Audience Targeting: Yes
- Brand Management: No
- Conversion Tracking: Yes
- Data Export: Yes
- Data Import: Yes
- External Integrations: Yes
- Keyword Tracking: Yes
- Lead Management: Yes
- Lead Scoring: Yes
- Link Tracking: Yes
- Marketing Automation: Yes
- Multi-User: Yes
- Net Promoter Score: No
- Notifications: Yes
- Social-Media Integration: Yes


