

En iyi Databox alternatifleri, pazarlama verilerinize daha hızlı, daha derinlemesine ve daha özelleştirilebilir bir görünürlük sunarak sonuçları gelire bağlamanıza ve kampanyaları anında uyarlamanıza yardımcı olur. Databox alternatifleri arıyorsanız muhtemelen daha esnek panolara, daha güçlü müşteri raporlama özelliklerine veya kampanya ölçümlerini pazarlama kanalları genelinde birleştirmenin ölçeklenebilir yollarına ihtiyacınız vardır. Analitik teknoloji yığınları oluşturma deneyimime göre doğru araç, kaç müşteriyi veya platformu yönetirseniz yönetin ham sayıları ekibinizin harekete geçebileceği içgörülere dönüştürebilir. Aşağıda, eyleme geçirilebilir veriler, otomatik raporlama ve iş akışınızı hiçbir zaman yavaşlatmayan entegrasyonlar isteyen pazarlama liderleri için tasarlanmış yazılımları bulabilirsiniz.
Databox Nedir?
Databox, panolar oluşturmak, KPI'ları izlemek ve birden fazla kaynaktan gelen verileri tek bir yerde birleştirmek için kullanılan bir pazarlama analitiği platformudur. Ekiplerin kampanya performansını izlemesine, trendleri görselleştirmesine ve pazarlama stratejilerini optimize etmek üzere sonuçları raporlamasına yardımcı olmak için çeşitli pazarlama, satış ve analitik araçlarına bağlanır. Databox; gerçek zamanlı analitik, özelleştirilebilir raporlar ve pazarlama stratejilerini optimize etmeye yönelik içgörüler için tek bir merkeze ihtiyaç duyan pazarlama liderleri ve ajanslar tarafından kullanılır.
Databox Alternatifleri Karşılaştırma Tablosu
Bu karşılaştırma tablosu, en iyi Databox alternatifi seçimlerimin fiyatlandırma ayrıntılarını özetlemektedir:
Score legend (out of 5)
- Excellent4.5–5
- Good4–4.4
- Average3–3.9
- Below average2–2.9
- Poor1–1.9
Sorted by: Default
| Tool | Starting Price | Website | |||||||
|---|---|---|---|---|---|---|---|---|---|
Best for warehouse-anchored custom metric dashboards | 3.8 out of 5 | 4 | 4 | 5 | 5 | 3 | 2 | Pricing upon request 14-day free trial | Website |
Best for warehouse-ready marketing data pipelines | 3.8 out of 5 | 3 | 4 | 3 | 5 | 5 | 3 | Pricing upon request Free demo available | Website |
Best for agency-scale white-label reporting | 3.7 out of 5 | 4 | 3 | 4 | 4 | 3 | 4 | $812/month Free demo available | Website |
Best for enterprise ETL and governed metrics at scale | 4.3 out of 5 | 4 | 5 | 3 | 5 | 5 | 4 | $100/month Free plan + free demo available | Website |
Best for piping 150+ sources into BI tools | 4.0 out of 5 | 4 | 3 | 4 | 4 | 5 | 4 | $39/user/month Free trial available | Website |
Best for pixel-perfect, agency-scale dashboards | 4.7 out of 5 | 4 | 4 | 5 | 5 | 5 | 5 | $120/month 14-day free trial | Website |
Best for white-label agency client reporting | 4.5 out of 5 | 4 | 5 | 4 | 5 | 4 | 5 | $20/client/month Free demo + 14-day free trial | Website |
Best for enterprise teams outgrowing BI limits | 4.8 out of 5 | 5 | 5 | 5 | 5 | 5 | 4 | Pricing upon request 30-day free trial | Website |
Best for agencies reporting across many clients | 4.8 out of 5 | 5 | 5 | 4 | 5 | 5 | 5 | Pricing upon request Free demo + 14-day free trial | Website |
Best for built-in data warehouse reporting | 4.8 out of 5 | 5 | 4 | 5 | 5 | 5 | 5 | $265/month Free trial + free demo available | Website |


Why Trust Our Software Recommendations
6,700+
Reviews
20
Industry experts
16+
Evaluation factors
14
Years
Our team has been testing and reviewing software since 2012. As marketing leaders ourselves, we know how difficult—and important—it is to choose the right software.
For this guide, we evaluated tools using hands-on testing and independent research, scoring tools using our selection criteria.
Our reviews reflect our human editorial judgment, not a sales pitch.
Expert reviewers:
 Gui DrusinaCreative Director
- Shriya GhateSenior Marketing Lead
 Amanda JacquesMarketing Ops Leader

Databox Alternatifleri İncelemeleri
Aşağıda, kısa listeme giren en iyi Databox alternatiflerine ilişkin ayrıntılı özetlerimi bulabilirsiniz. İncelemelerim, sizin için en iyi seçeneği bulmanıza yardımcı olmak amacıyla her platformun özelliklerine, en uygun kullanım alanlarına ve entegrasyonlarına ayrıntılı bir bakış sunar.
 Best for warehouse-anchored custom metric dashboards
- 14-day free trial
- Pricing upon request
Visit WebsiteCustomer Rating:4.5/5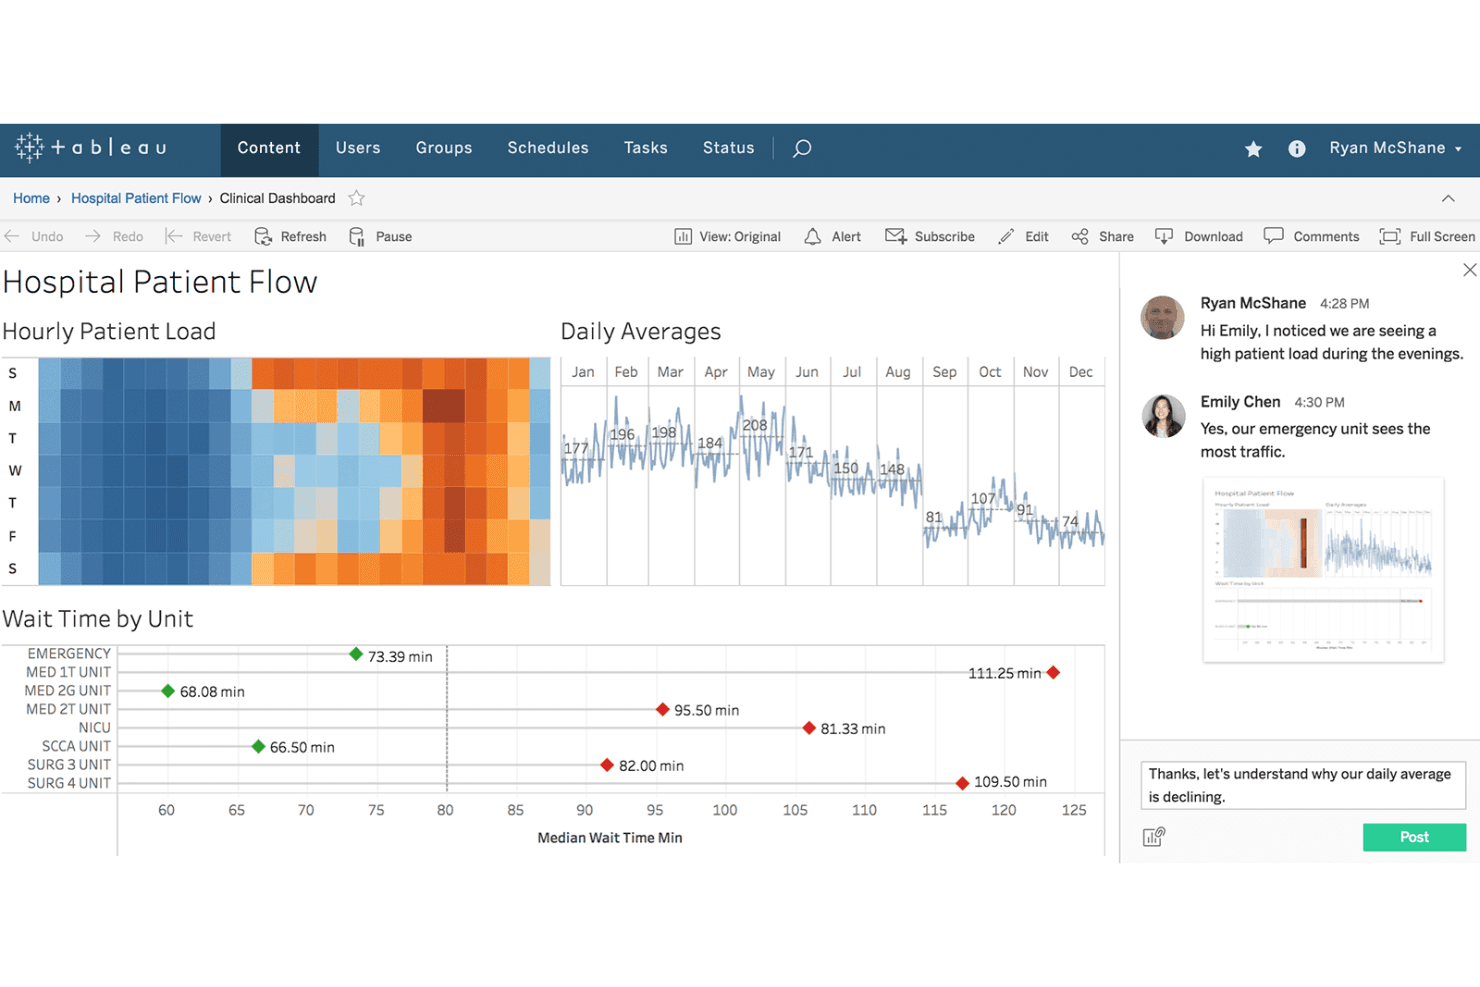
Tableau enables team collaboration directly within clinical dashboards. Tableau gives marketing and analytics teams a flexible platform to visualize, blend, and explore complex data sets, making it easier to create dashboards that reveal actionable insights and improve decision-making across campaigns.
Who Is Tableau Best For?
Marketing and analytics teams at large organizations who need to connect directly to data warehouses and build custom dashboards across complex data sets.
Why Tableau Is a Good Databox Alternative
I picked Tableau as one of my top Databox alternatives because it lets my team build tailored dashboards directly from live warehouse data. I rely on its ability to blend data sources, create custom calculated metrics, and surface insights across massive, complex datasets that change in real time.
Tableau Key Features
- Drag-and-drop dashboard builder: Design interactive reports and visualizations without writing code.
- Extensive visualization library: Choose from charts, maps, and custom graphics to represent your data.
- Scheduled data refreshes: Keep dashboards updated automatically with the latest data from your sources.
- Row-level security: Control user access and data visibility based on permissions within your organization.
Tableau Integrations
Tableau offers native integrations with Salesforce, Google BigQuery, Amazon Redshift, Snowflake, Microsoft SQL Server, Oracle, Google Sheets, Microsoft Excel, and SAP. An API is available for custom integrations.
Pros and Cons
Pros:
- Row-level security for controlling dashboard access
- Advanced calculated metrics and custom formulas
- Connects directly to popular data warehouses
Cons:
- High resource requirements for large data sets
- Complex setup for non-technical team members
Learn more about Tableau: Best for warehouse-ready marketing data pipelines
- Free demo available
- Pricing upon request
Visit WebsiteCustomer Rating:4.5/5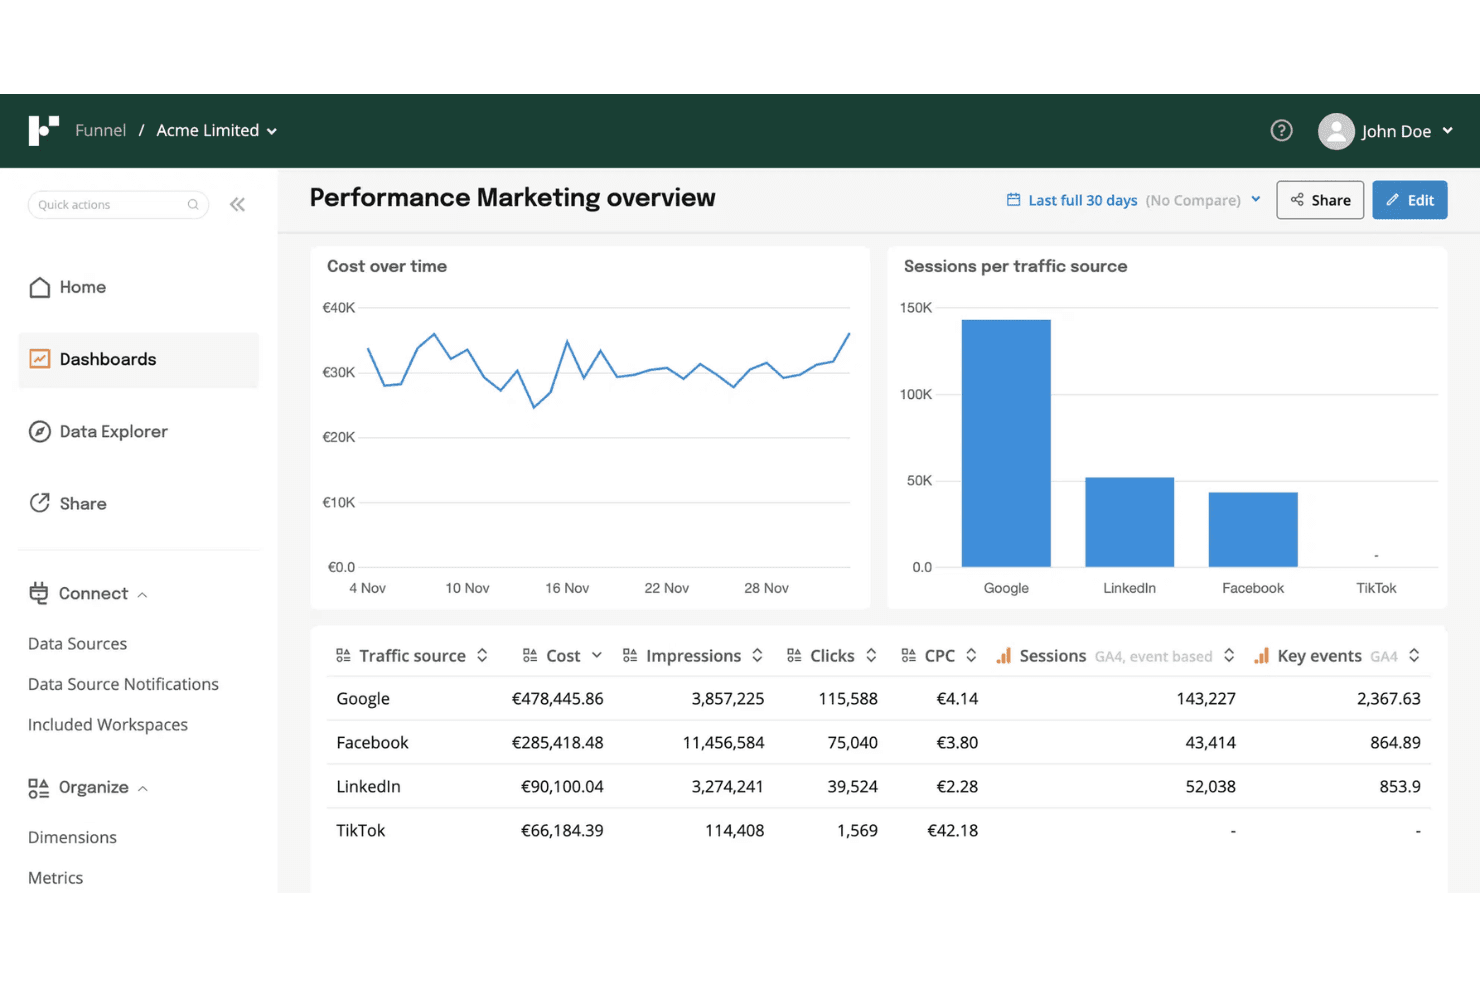
Funnel unifies paid channel data for marketing performance analysis. Funnel is a data platform built for marketing teams, offering a way to connect, centralize, and prepare analytics-ready data from hundreds of advertising, analytics, and CRM sources without custom code or IT resources.
Who Is Funnel Best For?
Funnel is a good fit for marketing teams at mid-sized to large companies who need to centralize analytics and advertising data without custom development.
Why Funnel Is a Good Databox Alternatives
I picked Funnel because I can pull unified, analytics-ready data from hundreds of sources without IT help, which is critical for teams needing warehouse-ready marketing data pipelines. My team uses Funnel's automated data transformation to simplify reporting across ad, analytics, and CRM platforms, letting us prep clean, accurate data for advanced analysis.
Funnel Key Features
- Custom data mapping: Adjust and map incoming data fields to match your team's reporting structure.
- Scheduled data exports: Set up automated exports to cloud data warehouses and BI tools on a regular schedule.
- Granular data source control: Connect and manage hundreds of data sources with detailed connection options for each.
- Multi-user collaboration: Invite team members and assign roles with custom access permissions for different projects.
Funnel Integrations
Funnel offers native integrations with over 500 advertising, analytics, and CRM platforms, including Google Ads, Facebook Ads, Google Analytics, HubSpot, Salesforce, LinkedIn Ads, TikTok Ads, Amazon Ads, Shopify, and Snowflake. An API is available for custom integrations.
Pros and Cons
Pros:
- Flexible data mapping across all platforms
- Supports over 500 marketing data sources
- Preps marketing data for advanced analytics
Cons:
- Limited visualization tools compared to Databox
- Complex transformation setup for new users
Learn more about Funnel: Best for agency-scale white-label reporting
- Free demo available
- From $812/month (billed annually)
Visit WebsiteCustomer Rating:4.5/5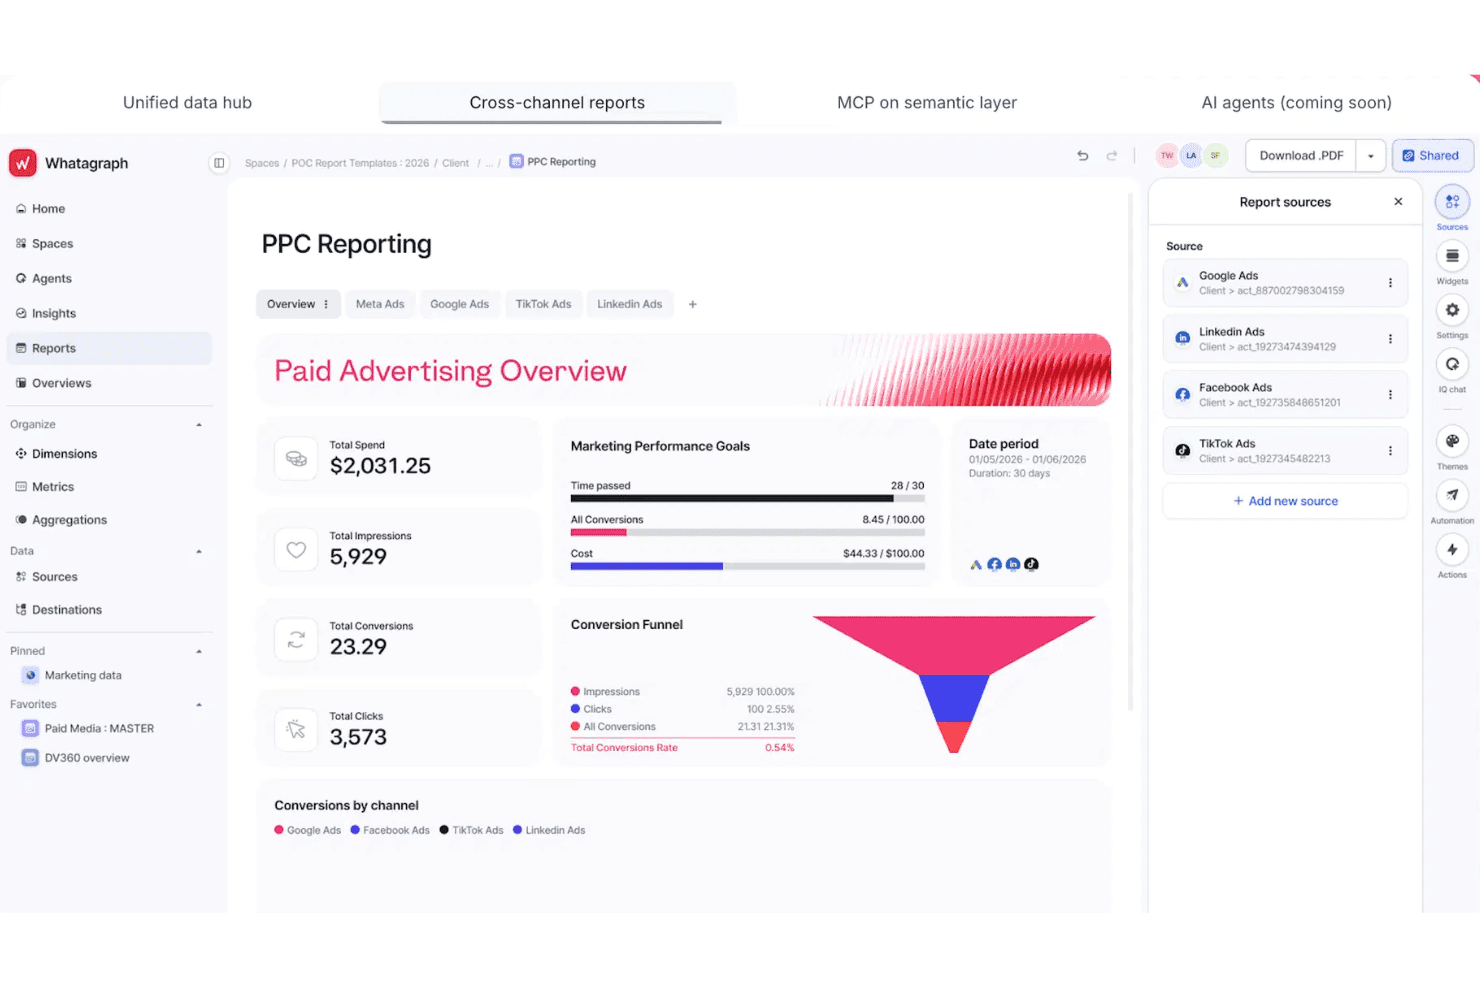
Whatagraph unifies PPC data across channels into one report. Whatagraph is designed for marketing agencies and teams who need to bring data from multiple sources into unified, visually-driven content analytics dashboards and automated reports. It helps you simplify cross-channel reporting and makes sharing insights with clients much faster.
Who Is Whatagraph Best For?
Whatagraph is a solid choice for marketing agencies and teams that manage client reporting across multiple digital channels.
Why Whatagraph Is a Good Databox Alternative
I’ve included Whatagraph in my top picks because it delivers true agency-scale white-label reporting. My team uses its cross-channel data integration to create unified client dashboards, and I can automate branded report delivery across dozens of accounts in one place. I appreciate how it simplifies multi-client analytics without sacrificing depth or customizability.
Whatagraph Key Features
- Drag-and-drop dashboard builder: Create customized analytics dashboards by dragging and dropping widgets, charts, and tables.
- Automated scheduled reporting: Set up recurring report schedules to ensure stakeholders receive reports automatically.
- Multi-source data connectors: Link data from paid ads, social media, SEO, and other digital channels with over 40+ native integrations.
- Custom data blending: Combine metrics from different data sources into unified visualizations for deeper cross-channel insights.
Whatagraph Integrations
Whatagraph offers 40+ native integrations, including Google Analytics, Facebook Ads, Instagram, LinkedIn, YouTube, Google Ads, HubSpot, Mailchimp, Shopify, and SEMrush. An API is available for custom integrations.
Pros and Cons
Pros:
- Cross-channel data blending for unified analytics
- Visual dashboard builder with drag-and-drop widgets
- White-label client reports without extra work
Cons:
- Occasional lag syncing large data sets
- Scheduled report customization options can feel limited
 Best for enterprise ETL and governed metrics at scale
- Free plan + free demo available
- From $100/month
Visit WebsiteCustomer Rating:4.5/5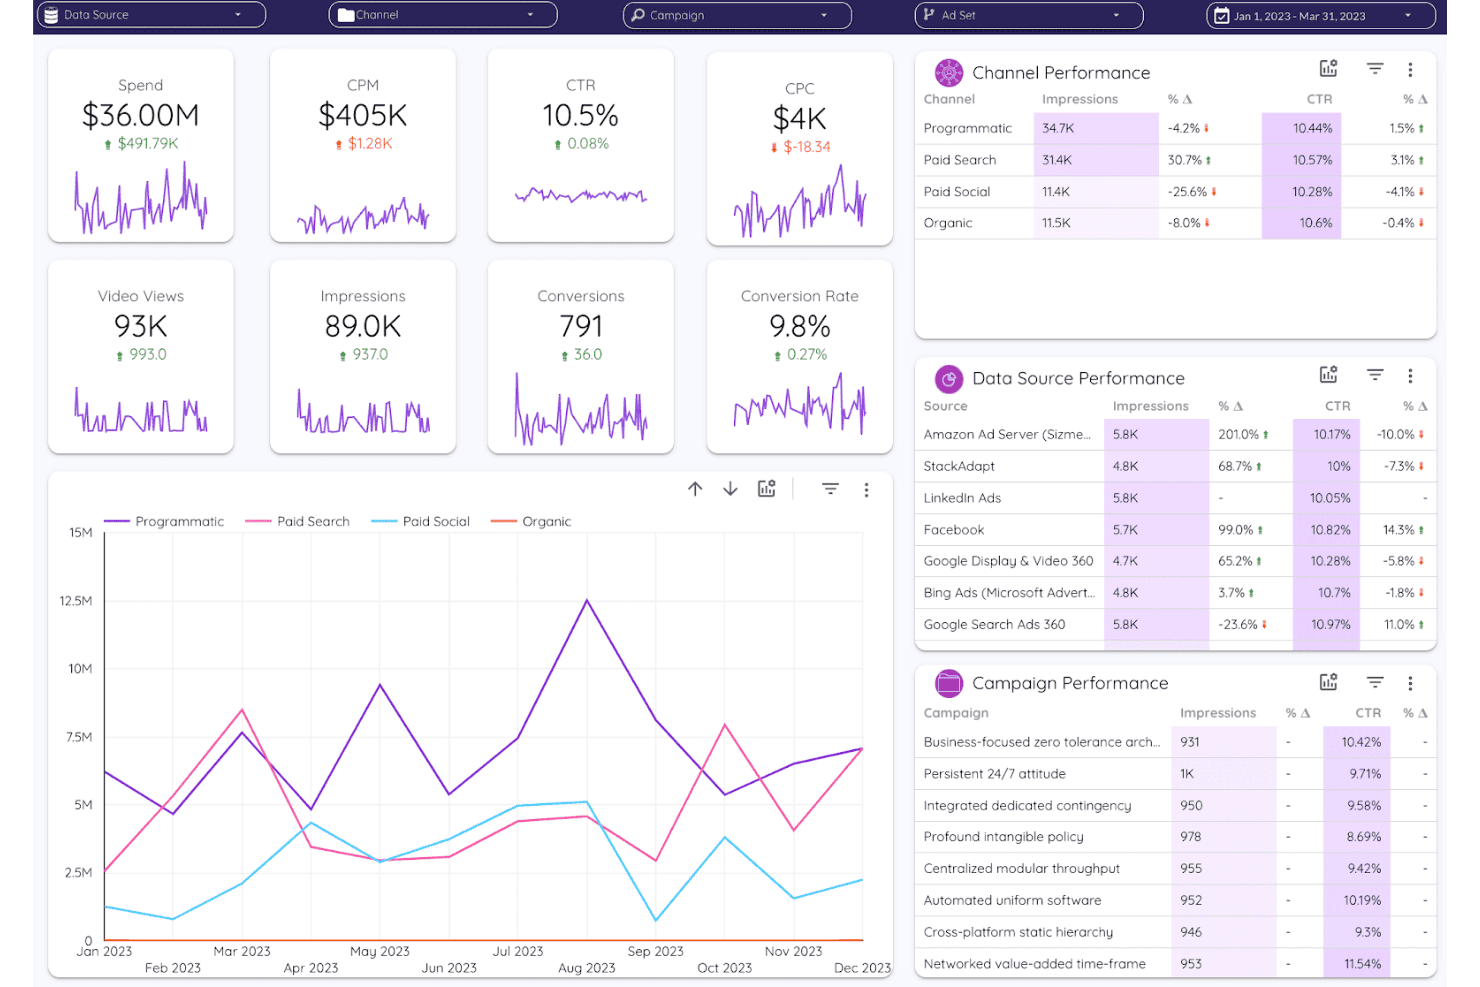
Improvado unifies cross-channel ad performance into one dashboard. Improvado brings advanced data integration and analytics capabilities to marketing teams, agencies, and enterprises that need to manage high volumes of marketing and sales data from multiple sources in one unified platform.
Who Is Improvado Best For?
Improvado is a strong choice for enterprise marketing and analytics teams that need to unify large volumes of data from multiple sources.
Why Improvado Is a Good Databox Alternative
I picked Improvado as a top alternative because I can manage high-volume data ETL and establish governed metrics at an enterprise scale. My team pulls marketing and sales data from dozens of sources, automates complex data pipelines, and maintains strict controls over metric definitions across channels.
Improvado Key Features
- Custom data connectors: Build and configure connectors for niche or proprietary data sources directly in the platform.
- Cross-channel attribution mapping: Attribute campaign performance across multiple marketing channels with flexible rules.
- Data transformation workbench: Apply cleansing, enrichment, and normalization on imported datasets before warehousing.
- Automated data monitoring: Set up alerts for anomalies or breaks in data workflows for hands-free oversight.
Improvado Integrations
Improvado offers 400+ native integrations with data sources and destinations, including Google Analytics, Google Ads, Facebook Ads, Salesforce, HubSpot, Shopify, Amazon Ads, LinkedIn Ads, Snowflake, BigQuery, and Tableau. An API is available for custom integrations.
Pros and Cons
Pros:
- Offers flexible cross-channel attribution mapping
- Enables custom data pipelines without technical support
- Handles large-scale enterprise marketing data volumes
Cons:
- Support responsiveness can vary for complex issues
- Setup requires significant initial configuration time
Learn more about Improvado: Best for piping 150+ sources into BI tools
- Free trial available
- From $39/user/month (billed annually)
Visit WebsiteCustomer Rating:4.4/5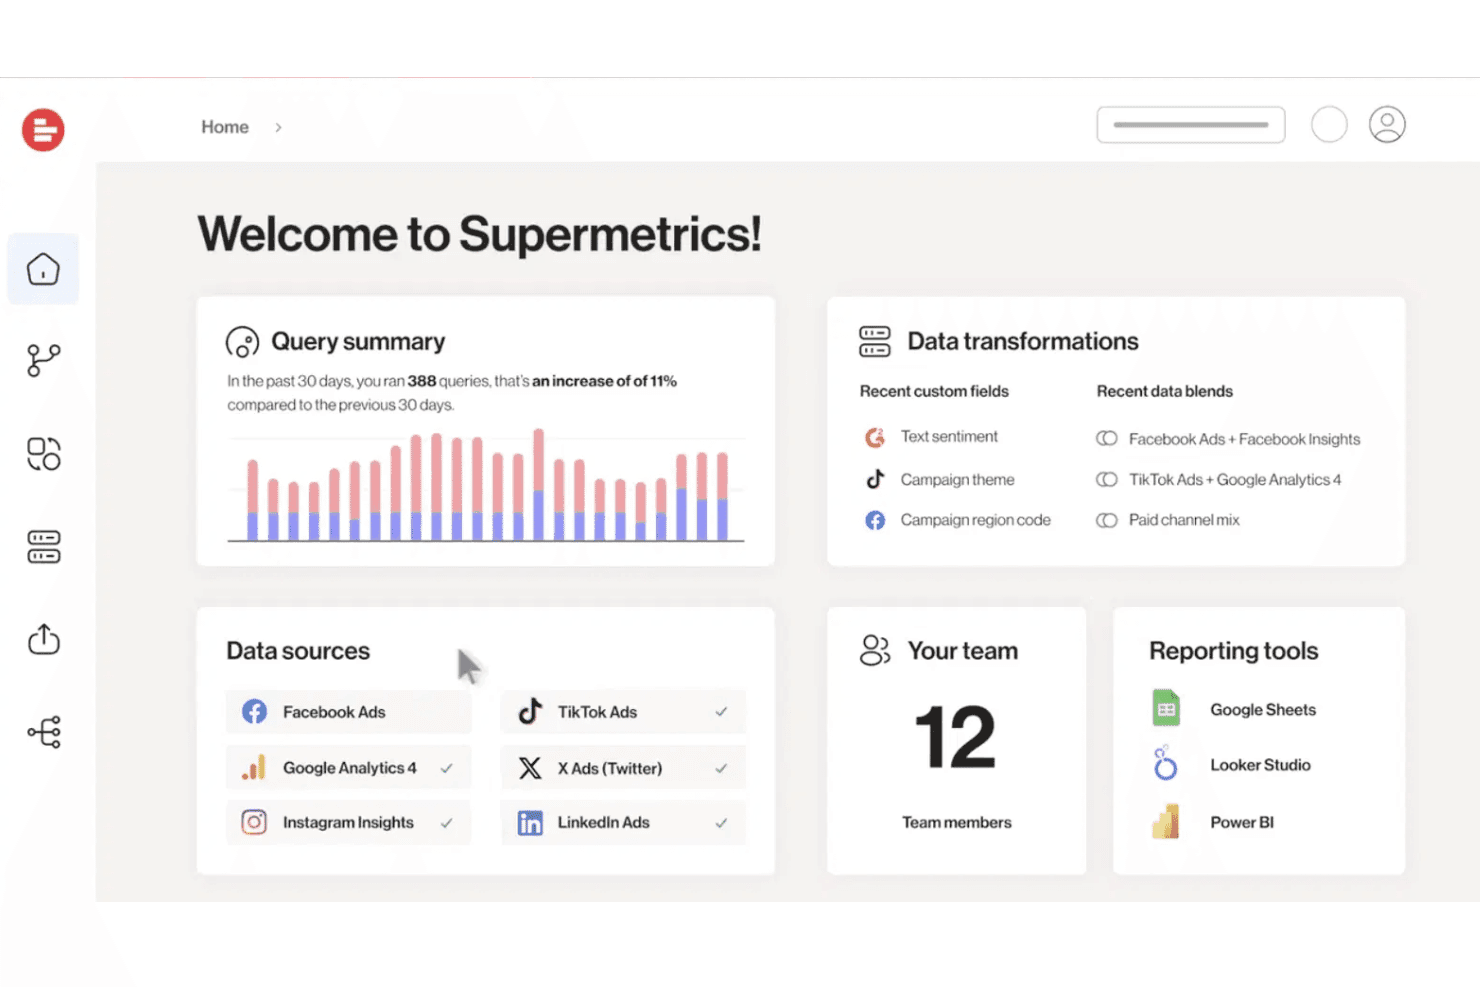
Supermetrics integrates multi-platform ad data with transformation tools. Supermetrics is a data integration platform built for marketing and analytics teams who need to unify metrics from a wide range of platforms, solve cross-channel reporting challenges, and connect their data directly to BI or analytics tools.
Who Is Supermetrics Best For?
Supermetrics is a strong fit for marketing and analytics teams at mid-size or larger companies who need to unify data from many channels in BI or analytics platforms.
Why Supermetrics Is a Good Databox Alternative
I picked Supermetrics because I can connect more than 150 marketing and analytics sources directly into BI platforms like Google Data Studio and Tableau. For content analytics, I've used its powerful data connectors to centralize cross-channel metrics without manual exports. That lets my team run unified reporting from dozens of sources in a single workflow.
Supermetrics Key Features
- Automated data refresh and scheduling: Set up automatic data updates to keep dashboards current without manual intervention.
- Custom query builder: Build queries with precise dimensions, filters, and metrics to tailor data pulls to your reporting needs.
- Data source connectors for paid media: Connect directly to sources like Google Ads, Facebook Ads, LinkedIn Ads, and more in a few clicks.
- Data transformation tools: Clean, blend, and map fields across sources before sending data to your analytics platform.
Supermetrics Integrations
Supermetrics offers native integrations with over 150 marketing, analytics, and advertising platforms, including Google Analytics, Facebook Ads, Google Ads, HubSpot, LinkedIn Ads, Bing Ads, and Salesforce. Data connectors are available for Google Sheets, Microsoft Excel, Looker Studio, Tableau, Snowflake, and BigQuery. An API is available for custom integrations.
Pros and Cons
Pros:
- Custom query builder for granular reporting
- Supports direct BI tool data pipelines
- Connects to over 150 data sources
Cons:
- No built-in dashboard visualization tools
- Requires technical knowledge for optimal setup
Learn more about Supermetrics: Best for pixel-perfect, agency-scale dashboards
- 14-day free trial
- From $120/month (billed annually)
Visit WebsiteCustomer Rating:4.7/5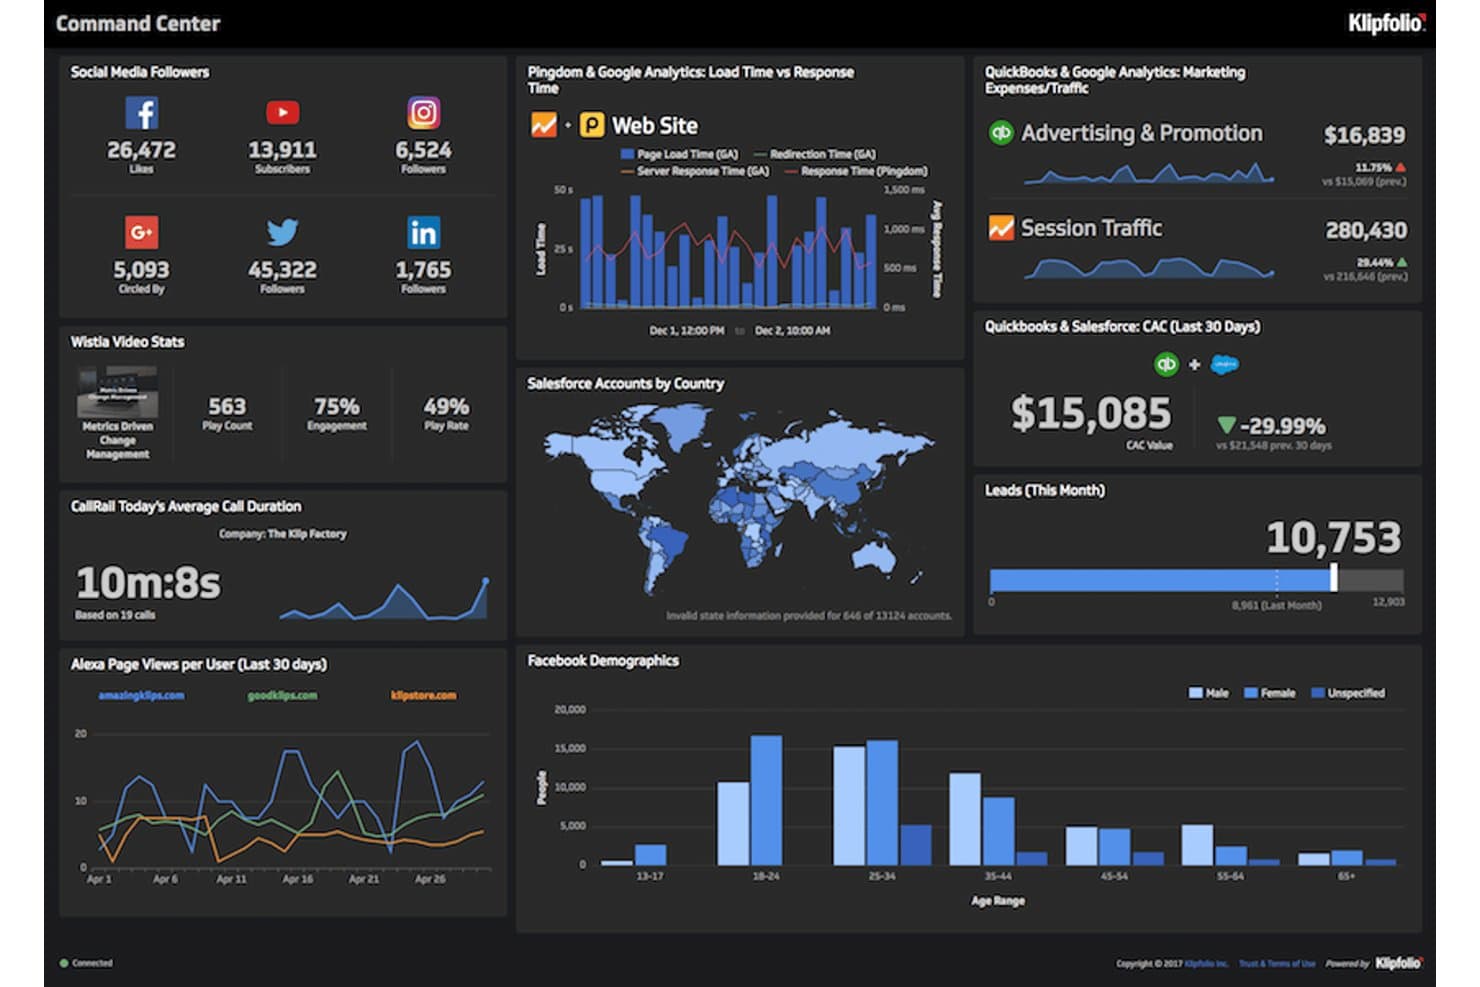
Klipfolio provides social, web, and sales metrics for marketing performance analysis. Klipfolio is a dashboard and reporting platform built for marketing agencies and data-driven teams who need to visualize large volumes of content and campaign analytics with full design control and agency-ready presentation tools.
Who Is Klipfolio Best For?
Klipfolio is a great fit for marketing agencies and analytics teams who need highly customizable dashboards and branding-ready client reporting.
Why Klipfolio Is a Good Databox Alternative
I picked Klipfolio as a top Databox alternative because I can build highly polished, pixel-perfect dashboards that match any client’s brand guidelines. My team uses Klipfolio’s deep design controls and agency presentation tools to deliver visually precise campaign analytics and large-scale reports for demanding marketing clients.
Klipfolio Key Features
- Data source connectors: Connect to hundreds of platforms like Google Analytics, Facebook Ads, and HubSpot to centralize campaign and channel data.
- Automated data refresh: Set dashboards to refresh automatically at custom intervals so your team always sees the latest metrics.
- Formula editor: Build custom metrics using a built-in formula editor for advanced calculations and derived data fields.
- White-label options: Remove Klipfolio branding and use your company’s logo, domain, and colors across client-facing reports.
Klipfolio Integrations
Klipfolio offers native integrations with Google Analytics, Facebook Ads, HubSpot, Salesforce, Google Sheets, MySQL, Snowflake, and Amazon Redshift. It also connects with Zapier and provides an API for custom integrations.
Pros and Cons
Pros:
- Advanced formula editor for custom metrics
- White-label options for client-facing reports
- Dashboard layouts match client brand guidelines
Cons:
- Limited visual customization for certain chart types
- Initial dashboard setup can be time-consuming
Learn more about Klipfolio: Best for white-label agency client reporting
- Free demo + 14-day free trial
- From $20/client/month (billed annually)
Visit WebsiteCustomer Rating:4.7/5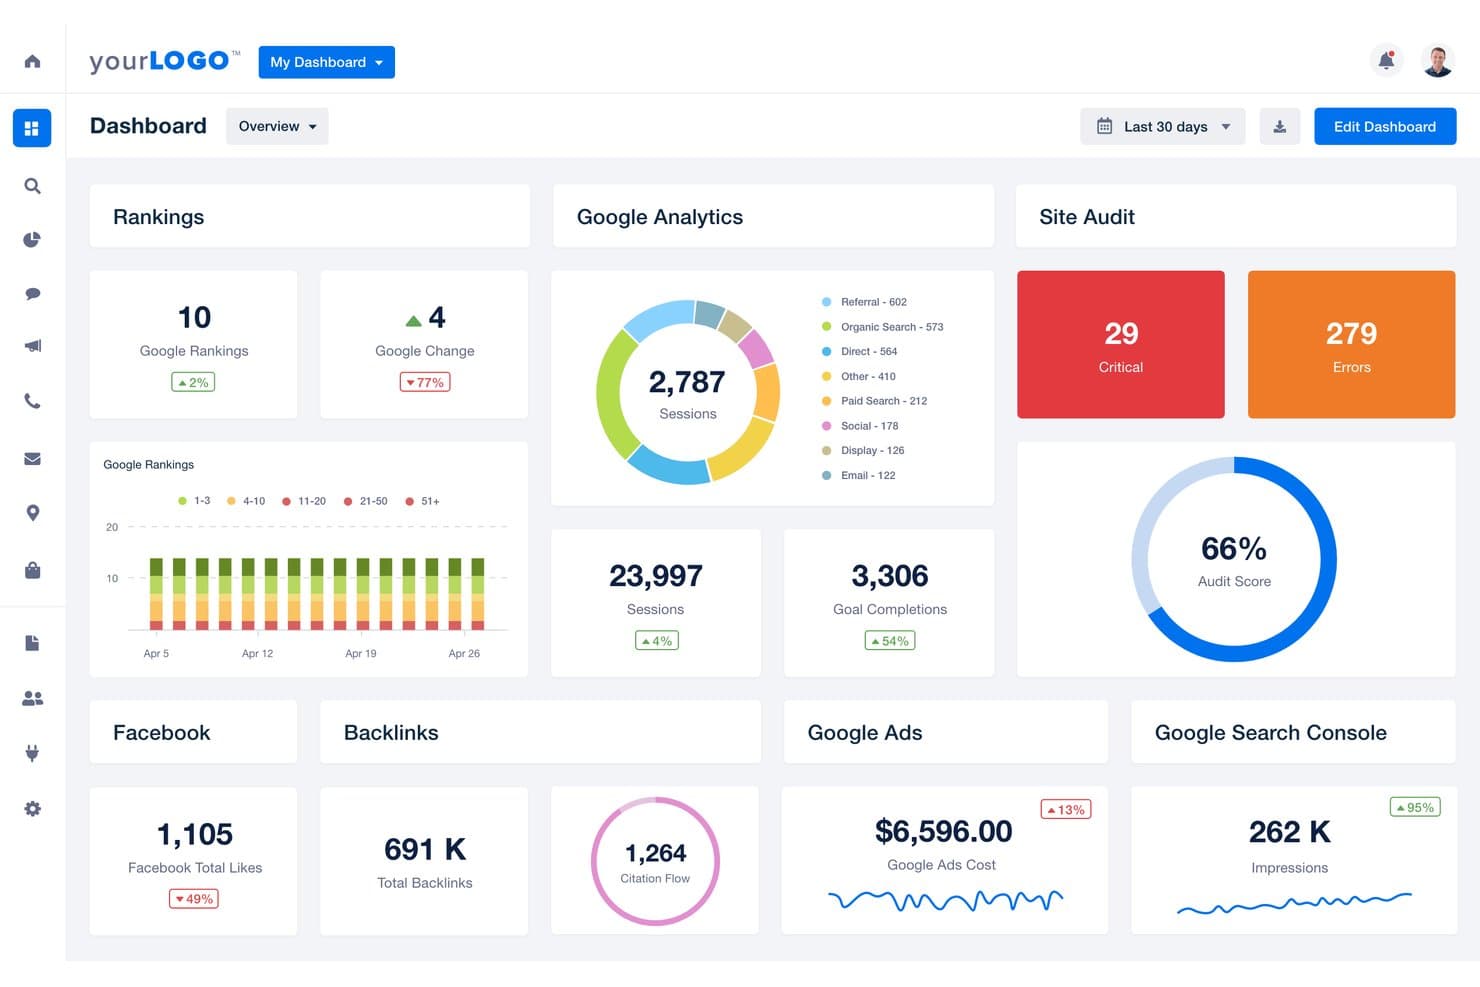
AgencyAnalytics unifies SEO, ads, and social metrics for performance reporting. AgencyAnalytics is a content analytics and reporting platform designed for agencies that want to automate multi-channel client reporting, track campaign performance, and centralize analytics across search, social, and web properties.
Who Is AgencyAnalytics Best For?
AgencyAnalytics is a good fit for marketing agencies that need to automate multi-channel client reporting and deliver branded analytics dashboards.
Why AgencyAnalytics Is a Good Databox Alternatives
I picked AgencyAnalytics because I can automate and brand multi-channel analytics reports for each client, connecting search, social, and web data into a single dashboard. My team is able to create custom client portals and deliver scheduled performance updates that match client branding, which is exactly what I need for white-label agency client reporting.
AgencyAnalytics Key Features
- Drag-and-drop dashboard builder: Customize dashboards for each client and marketing channel using a visual editor.
- Automated data integrations: Connects with over 80 marketing platforms for real-time data collection and visualization.
- Report scheduling and delivery: Set up automated report generation and email delivery to clients on a recurring schedule.
- Task and project management tools: Assign tasks, track progress, and manage workflows within the same platform.
AgencyAnalytics Integrations
AgencyAnalytics offers 80+ native integrations, including Google Analytics, Google Ads, Facebook Ads, Facebook Insights, LinkedIn Ads, Mailchimp, HubSpot, Ahrefs, SEMrush, and CallRail. An API is available for custom integrations.
Pros and Cons
Pros:
- Automated multi-channel report scheduling and delivery
- Drag-and-drop editor for dashboard customization
- Custom client portals with advanced branding options
Cons:
- Task management feels limited for complex projects
- No advanced data modeling capabilities
Learn more about AgencyAnalytics: 8Best for enterprise teams outgrowing BI limits
Domo
- 30-day free trial
- Pricing upon request
Visit WebsiteCustomer Rating:4.4/5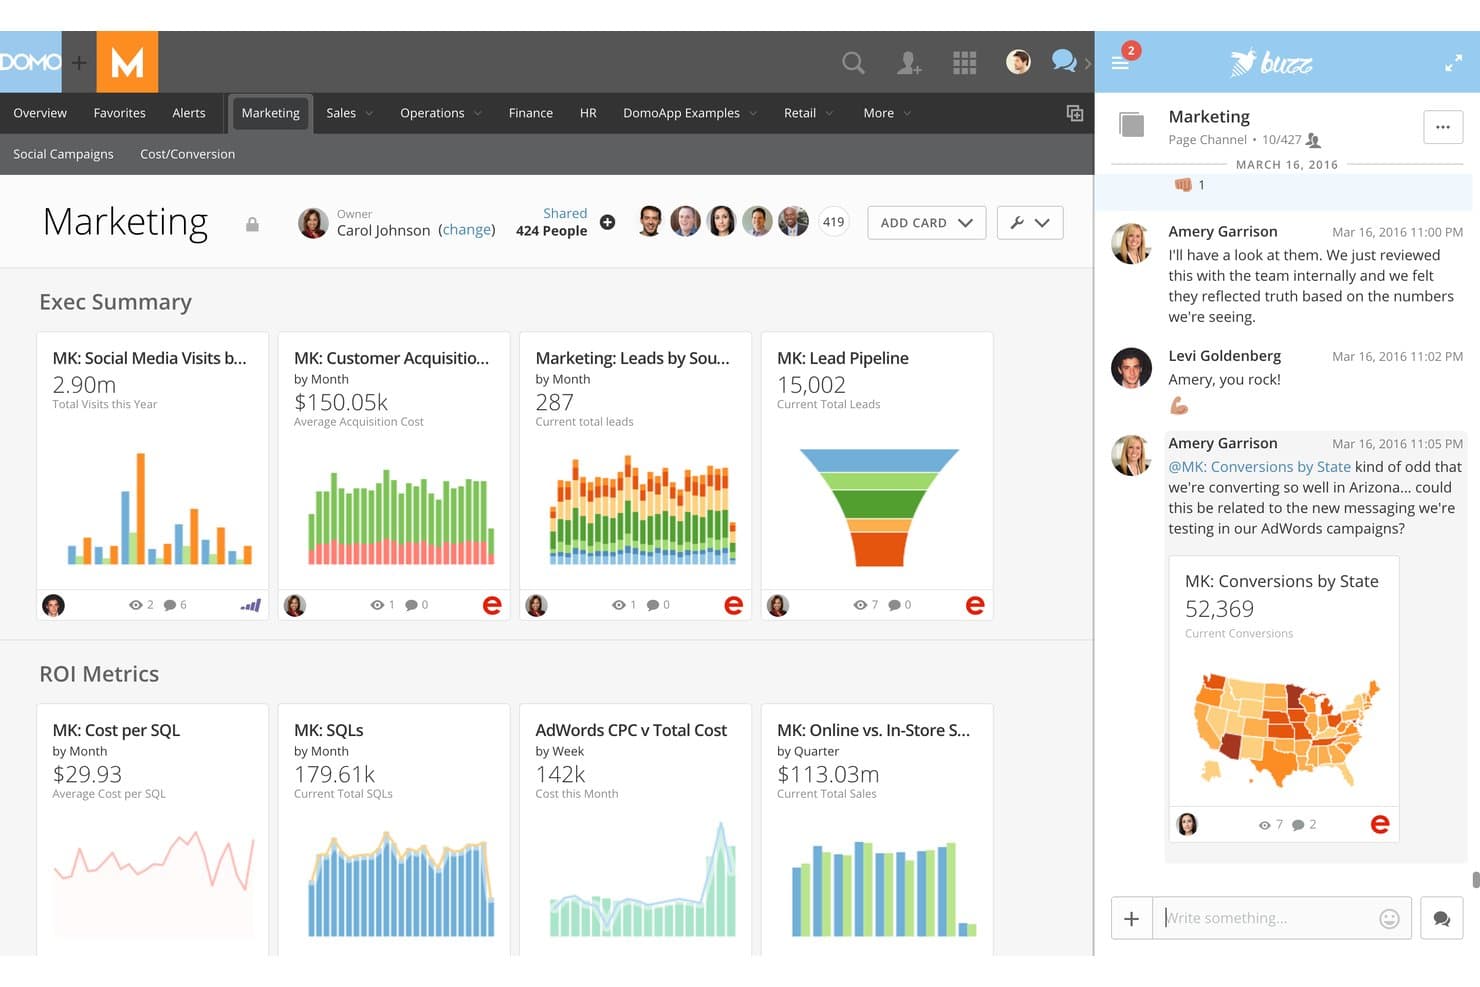
Domo provides marketing metrics alongside team collaboration tools. Domo brings together analytics, data visualization, and cloud-based business intelligence for marketing teams and enterprises that need to connect, analyze, and act on data from a wide range of sources without technical roadblocks.
Who Is Domo Best For?
Domo is a strong fit for large enterprises that need to unify analytics, reporting, and data-driven decision-making across multiple departments and data sources.
Why Domo Is a Good Databox Alternative
I picked Domo as one of the best because it scales across enterprise teams outgrowing normal BI limits. My team connects dozens of data sources, builds real-time reports, and customizes permissions by department, all in one cloud platform. That flexibility helps us manage analytics and decision-making at a scale I can’t get from most content analytics tools.
Domo Key Features
- Low-code data app builder: Create interactive data visualizations and dashboards with drag-and-drop tools.
- Automated data pipelines: Set up connections that pull, cleanse, and sync data from multiple sources without manual updates.
- Embedded analytics: Share live dashboards and reports outside of Domo using secure embed options.
- Data governance controls: Manage access, user roles, and data permissions at a granular level for each department or user.
Domo Integrations
Domo offers hundreds of native integrations, including Google Analytics, Salesforce, HubSpot, Marketo, Shopify, Adobe Analytics, Snowflake, Amazon Redshift, MySQL, Oracle, and Microsoft 365. An API is available for custom integrations.
Pros and Cons
Pros:
- Department-level reporting with granular permissions
- Automated data pipelines reduce manual work
- Scales for large, multi-department organizations
Cons:
- Advanced features require specialized training
- Initial setup can be time-consuming
Learn more about Domo: Best for agencies reporting across many clients
- Free demo + 14-day free trial
- Pricing upon request
Visit WebsiteCustomer Rating:4.3/5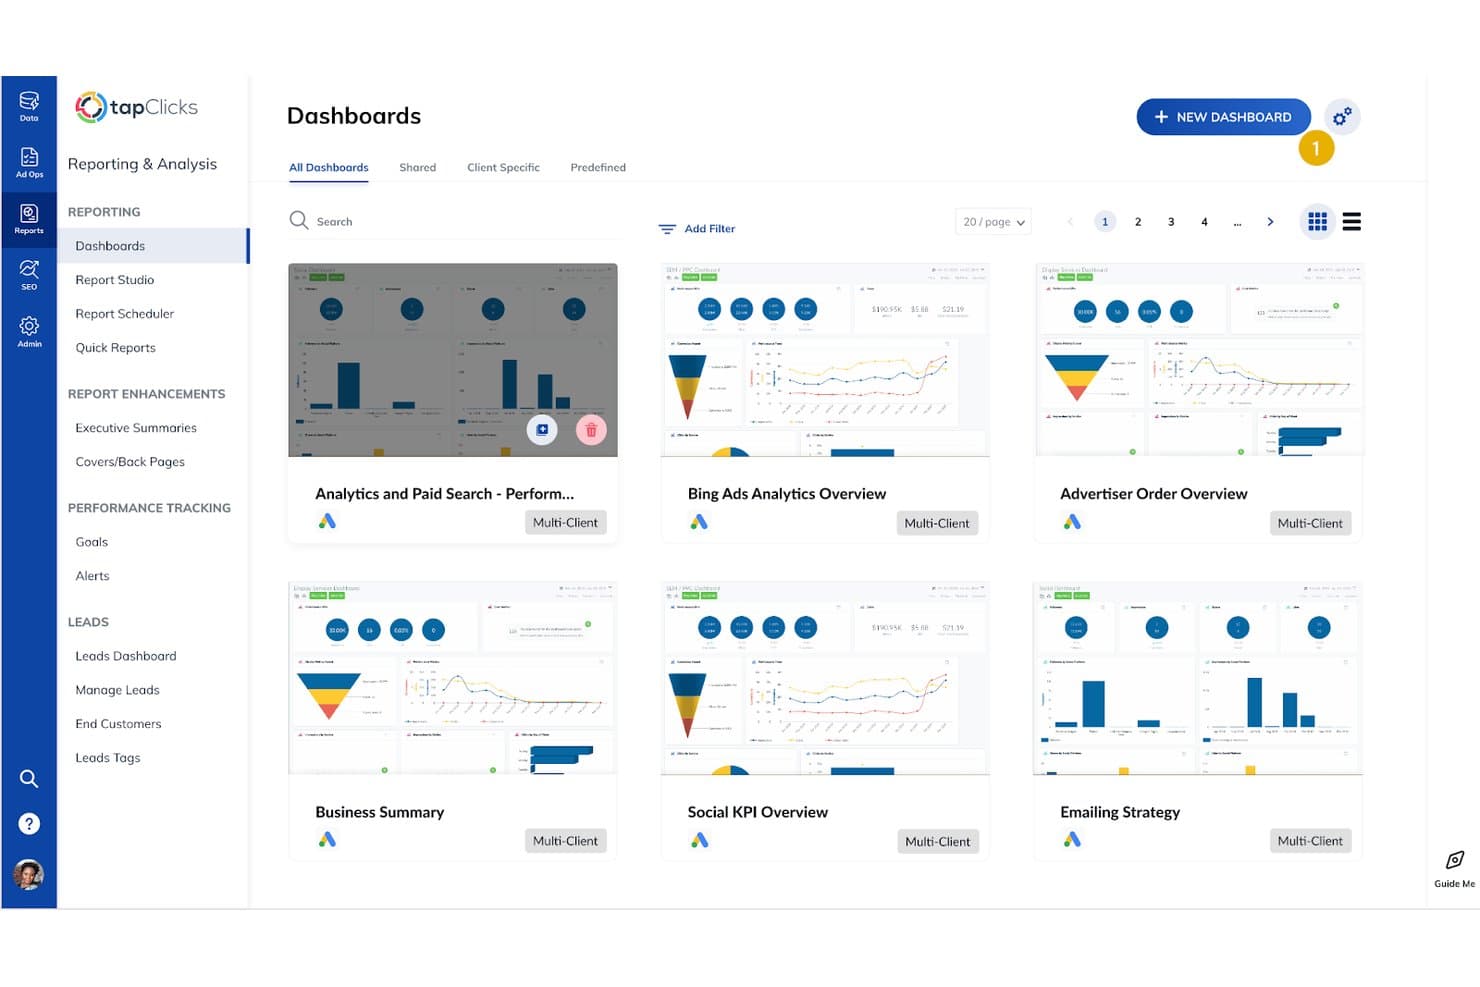
TapClicks provides multi-client reports for tracking marketing performance. TapClicks is a marketing analytics and reporting platform designed for agencies and multi-brand organizations that need to centralize data from diverse sources, simplify client reporting, and gain insights into cross-channel performance.
Who Is TapClicks Best For?
Agencies and marketing teams managing high volumes of clients or brands needing unified analytics and reporting across multiple channels.
Why TapClicks Is a Good Databox Alternatives
I picked TapClicks as one of the best because it centralizes reporting for agencies managing dozens of brands and clients. I use its dashboard to automate data aggregation across digital channels, saving hours on cross-client campaign reviews. The platform’s scheduled reporting and custom widgets let my team deliver tailored analytics for each client without manual exports.
TapClicks Key Features
- Smart connectors: Connects to hundreds of marketing, analytics, and advertising platforms for automated data imports.
- Calculated metrics: Lets you create custom formulas and advanced metric calculations directly in your dashboards.
- Annotation tools: Allows you to add comments and notes to reports and dashboards for added context.
- User access controls: Supports custom roles and permissions for controlling who sees and edits different data sets.
TapClicks Integrations
TapClicks offers native integrations with over 250 marketing and analytics platforms, including Google Ads, Facebook Ads, LinkedIn Ads, Google Analytics, HubSpot, Mailchimp, Twitter Ads, Adobe Analytics, Salesforce, and Amazon Ads. An API is available for custom integrations.
Pros and Cons
Pros:
- Calculated metrics enable advanced custom analysis
- Annotation tools add report context for clients
- Scheduled reporting automates regular client updates
Cons:
- Occasional delays syncing large data volumes
- Custom dashboard setup can be time-consuming
Learn more about TapClicks: 10Best for built-in data warehouse reporting
ClicData
- Free trial + free demo available
- From $265/month (billed annually)
Visit WebsiteCustomer Rating:4.4/5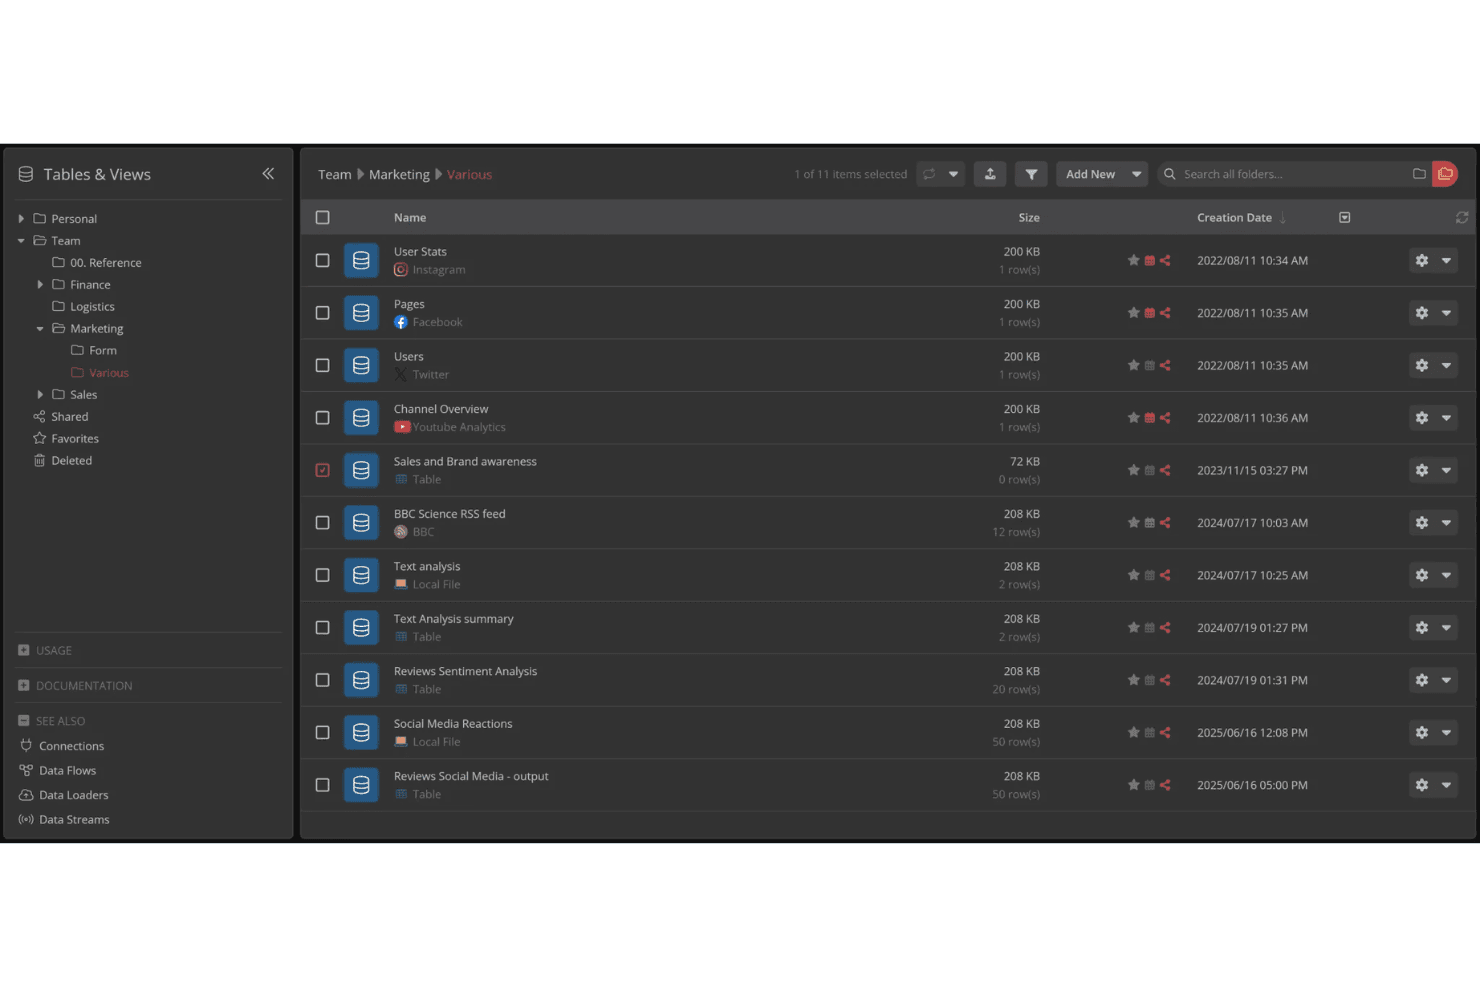
ClicData organizes marketing data tables in a structured folder view. ClicData is a business intelligence platform for teams who want to centralize, visualize, and share content analytics across departments, with flexible dashboard creation and automated data connections built in.
Who Is ClicData Best For?
ClicData fits marketing teams and business analysts who need to centralize diverse data, create dashboards, and automate reporting across departments.
Why ClicData Is a Good Databox Alternative
I picked ClicData as a top alternative because I can centralize content analytics from different sources directly in its built-in data warehouse. I like how my team can create dashboards while automating updates and sharing reports across departments—everything happens in one platform, without managing separate databases or integrations.
ClicData Key Features
- Native data connectors: Connect data from spreadsheets, databases, and cloud apps using built-in integrations.
- Drag-and-drop dashboard editor: Build and customize dashboards visually without any code.
- Scheduled data refreshes: Automate updates to your dashboards on a set schedule.
- Custom user roles: Define granular access permissions for different users and teams.
ClicData Integrations
ClicData offers over 250 native integrations with data sources, including Google Analytics, Google Sheets, HubSpot, Salesforce, Dropbox, Amazon Redshift, MySQL, SQL Server, Shopify, and Facebook Ads. An API is available for custom integrations.
Pros and Cons
Pros:
- Automates scheduled data refresh and reporting
- Drag-and-drop dashboard editor without coding
- Supports built-in data warehousing for analytics
Cons:
- Dashboard visualizations lack advanced customization options
- Collaboration features are limited across teams
Learn more about ClicData:
Diğer Databox Alternatifleri
Kısa listeme giremeyen ancak yine de göz atmaya değer bazı ek Databox alternatifleri şunlardır:
- 11NinjaCatBest for AI-driven multi-client agency reporting
- 12Zoho AnalyticsBest for BI-depth reporting with AI insights
- 13SwydoBest for agency white-label reporting included
- 14GrowBest for BI-depth reporting without per-seat costs
- 15Coupler.ioBest for ETL-first reporting across 400+ sources
How I Evaluate Databox Alternatives
When a team needs to unify paid, organic, and CRM data into one reporting layer—whether for internal stakeholders or client-facing dashboards—I split my evaluation into core functionality every tool must nail and differentiators that separate good from great.
Core Functionality (Table Stakes For This List)
When I'm selecting tools for my list, I rank each one on a scale from 0 (does not offer the functionality) to 5 (excels in this area) for each core functionality listed below. I then calculate the tool's total score into a percentage, using 75% as a benchmark to help assess its overall fit for the list.
- Marketing data integrations: I check how many native connectors each tool offers to sources like Google Analytics, Meta Ads, HubSpot, and LinkedIn—and whether it also supports SQL, API, or warehouse connections.
- Customizable dashboards: Each tool should let you build multi-metric dashboards with drag-and-drop editors, not just static templates that lock you into a rigid layout.
- Automated reporting: I look for scheduled delivery across multiple channels—email, Slack, PDF, live links—so your team or clients get updates without anyone clicking "export."
- KPI and goal tracking: The platform should let you set numeric targets on marketing metrics and visualize real-time pacing, not just display raw numbers without context.
- Custom and calculated metrics: Blending data across sources matters here—for example, combining ad spend from one platform with CRM revenue from another to calculate blended ROAS.
- White-label and client reporting: For agency buyers, I evaluate whether the tool supports branded portals, custom domains, and multi-client account management beyond a basic logo swap.
Once I have a list of tools that meet the criteria, I consider what sets each platform apart.
Differentiating Factors (What Sets Vendors Apart)
Here's how I compare and contrast different vendors:
Standout Features
I look for AI-powered insights that go beyond static charts—tools that flag anomalies and explain why a metric shifted save hours of manual digging. Cross-client benchmarking is equally valuable; I evaluate whether a platform lets agencies compare performance across accounts so KPIs have real context, not just trend lines. I also check for in-dashboard annotations, since tagging a campaign launch or budget change directly on a chart prevents the "what happened here?" questions during client reviews.
Beyond Features
Pricing model matters a lot here. Per-dashboard or per-data-source pricing can quietly balloon costs as your client roster grows, so I evaluate how each vendor scales before committing. I also check connector refresh cadence and historical backfill limits—an agency dashboard that updates only once a day undermines the "real-time" promise during a client call. Granular client-access permissions and SSO support are equally important when you're managing dozens of stakeholders across accounts.
Neden Databox Alternatifi Aramalısınız?
Databox, planlara göre veri kaynaklarını sınırlar ve bazı kullanıcılar panolarını özelleştirmenin zor, kurulumu yavaş ve her zaman güncel olmadığını düşünür; bu durum ajanslar ve veri ağırlıklı pazarlama ekipleri için önemlidir. Başka bir aracın daha uygun olabileceği durumlar şunlardır:
- Birçok kaynak veya müşteri hakkında raporlama yapıyorsunuz. Databox, planlara göre veri kaynaklarını sınırlar ve çoğu planda daha fazla kaynak eklemek için üst bir pakete geçmeniz gerekir; markasızlaştırma özelliği ise ücretli bir eklenti olarak sunulur. Funnel gibi araçlar yüzlerce kaynaktan veri çeker ve AgencyAnalytics markalı müşteri portalları içerir.
- Panolarınız üzerinde tam kontrol istiyorsunuz. Bazı kullanıcılar Databox panolarını özelleştirmenin zor olduğunu düşünür; bu da verilerinizi sunma biçiminizi sınırlar. Tableau gibi platformlar kapsamlı bir görselleştirme kitaplığı ve gelişmiş hesaplanmış ölçümler sunar.
- Kurulum için yeterli zamanınız yok. Bazı ekipler Databox'ı kurmanın ve öğrenmenin zaman aldığını düşünür; bu da ilk raporlarınızı geciktirir. ClicData gibi seçenekler kod gerektirmeyen bir sürükle ve bırak düzenleyicisi kullanır; Whatagraph ise sürükle ve bırak bileşenleri sunar.
- O anda güvenebileceğiniz sayılara ihtiyacınız var. Bazı kullanıcılar Databox panolarının her zaman güncel verileri göstermediğini bildiriyor. Karar vermeden önce ana kaynaklarınızı bağlayın ve yeni sayıların ne kadar hızlı göründüğünü kontrol edin.
Şu durumda Databox hâlâ doğru seçimdir: Performansı sizin için özetleyen bir AI analistine sahip KPI panoları istiyorsanız. Yalın pazarlama ekipleri için bu özellik, plana dayalı kaynak sınırlamalarından, kurulum süresinden ve bildirilen yenileme gecikmelerinden daha önemli olabilir.
Databox'ın Temel Özellikleri
Alternatif çözümlerin sunduklarını karşılaştırmanıza yardımcı olmak için Databox'ın bazı temel özelliklerini aşağıda bulabilirsiniz:
- Birleşik veri panosu: Pazarlama, satış ve analiz kaynaklarını tek bir arayüzde birleştirerek birden fazla kampanyanın metriklerini yan yana görüntülemenizi ve eğilimleri hızlıca fark etmenizi sağlar.
- Özel pano oluşturucu: Sürükle ve bırak düzenleyicisini kullanarak esnek, çok metrikli panolar oluşturmanızı ve hedeflerinizle ilgili sayılara ve görselleştirmelere öncelik vermenizi sağlar.
- Otomatik raporlama: Raporların e-posta, Slack, PDF veya canlı bağlantılar aracılığıyla gönderilmesini planlayarak paydaşların manuel dışa aktarma veya dağıtım işlemlerine gerek kalmadan düzenli olarak güncellemeleri almasını sağlar.
- Hedef ve KPI takibi: Temel metrikler için sayısal hedefler belirlemenize, bu hedeflere yönelik ilerlemeyi gerçek zamanlı olarak izlemenize ve ilerleme sorunlarını daha büyük problemlere dönüşmeden önce öne çıkarmanıza olanak tanır.
- Özel ve hesaplanan metrikler: Özel formüller için birden fazla kaynaktaki verileri birleştirmeyi ve dönüştürmeyi destekler; bu özellik, harmanlanmış ROAS veya çok kanallı edinme başına maliyet gibi metrikler oluşturmanız gerektiğinde kullanışlıdır.
- Veri kaynağı entegrasyonları: Google Analytics, HubSpot ve Facebook Ads gibi pazarlama ve satış platformları için önceden oluşturulmuş bağlayıcıların yanı sıra API, SQL ve veri ambarı verileri için seçenekler sunar.
- Markasızlaştırma ve portal markalama: Ajanslara markalı müşteri portalları, özel alan adları ve tasarım öğeleri ekleme olanağı sunarak raporların her müşteri için profesyonel ve markayla uyumlu görünmesini sağlar.
- Açıklama ekleme ve iş birliği: Bağlamı, kampanya değişikliklerini veya olağan dışı artışları açıklamak için doğrudan grafiklere not ya da yorum eklemenizi sağlar; böylece müşteri ve ekip değerlendirmeleri sırasında iletişimi geliştirir.
- Gerçek zamanlı veri yenileme: Bağlayıcı sınırlamalarına bağlı olarak panoları mümkün olduğunca sık günceller; böylece mevcut performansı izlemenize ve sayılar beklentilerin dışında değişirse harekete geçmenize yardımcı olur.
- Ayrıntılı kullanıcı izinleri: Yöneticiler, ekip üyeleri ve müşteriler için ayrıntılı erişim kontrolleri atayarak hassas bilgileri korumanıza ve panolar genelinde kimlerin neyi göreceğini hassas biçimde ayarlamanıza olanak tanır.
Databox Alternatiflerinin Maliyetleri ve Fiyatlandırması
Databox alternatiflerini seçmek, mevcut çeşitli fiyatlandırma modellerinin ve planların anlaşılmasını gerektirir. Maliyetler özelliklere, ekip büyüklüğüne, eklentilere ve daha fazlasına göre değişir. Aşağıdaki tablo, Databox alternatifi çözümlerinde yaygın olarak sunulan planları, ortalama fiyatlarını ve genellikle dahil edilen özellikleri özetlemektedir:
Databox Alternatifleri İçin Plan Karşılaştırma Tablosu
| Plan Türü | Ortalama Fiyat | Yaygın Özellikler |
|---|---|---|
| Plan TürüÜcretsiz Plan | Ortalama Fiyat$0 | Yaygın ÖzelliklerTemel panolara erişim, sınırlı veri kaynağı entegrasyonları, temel KPI takibi ve temel otomatik raporlama. |
| Plan TürüKişisel Plan | Ortalama Fiyat$10-$30/kullanıcı/ay | Yaygın ÖzelliklerÖzel panolar, daha fazla bağlayıcı, planlanmış raporlama, veri dışa aktarma ve temel özelleştirme seçenekleri. |
| Plan Türüİşletme Planı | Ortalama Fiyat$30-$100/kullanıcı/ay | Yaygın ÖzelliklerEkip iş birliği, gelişmiş pano özelleştirme, daha yüksek veri yenileme sıklığı, özel metrikler ve markasızlaştırma. |
| Plan TürüKurumsal Plan | Ortalama Fiyat$100-$500+/kullanıcı/ay | Yaygın ÖzelliklerSınırsız bağlayıcı, gelişmiş güvenlik kontrolleri, özel destek, tek oturum açma, müşteri portalları ve özel SLA'ler. |