Google Analytics Review 2026: Pros, Cons, Features, and Pricing


Google Analytics is a marketing software that helps you track, analyze, and optimize your website and campaign performance. For marketing managers who need clear data to prove ROI, understand user behavior, and make smarter decisions, Google Analytics offers a flexible platform with deep reporting and integration options.
In this review, you’ll get a clear look at its features, best and worst use cases, pros and cons, and pricing, so you can decide if it fits your team’s needs.
Google Analytics Evaluation Summary
- Pricing upon request
- Free plan available
Why Trust Our Software Reviews
We’ve been testing and reviewing marketing software since 2022. As marketing experts ourselves, we know how critical and difficult it is to make the right decision when selecting software.
We invest in deep research to help our audience make better software purchasing decisions. We’ve tested more than 2,000 tools for different marketing use cases and written over 1,000 comprehensive software reviews. Learn how we stay transparent & our software review methodology.
Google Analytics Overview
If you’re judging Google Analytics as marketing software, I think its free tier, flexible reporting, and deep integrations set it apart for teams that want granular data and custom dashboards. The interface can feel overwhelming at first, and onboarding takes time, but the documentation and community support help bridge the gap.
I’d suggest it’s best for marketers who need to compare multi-channel performance or segment audiences in detail. While some features require technical setup, the ability to connect with ad platforms and automate reporting makes it a top pick for data-driven environments.
pros
-
Free tier offers advanced analytics for most users
-
Deep audience segmentation and funnel analysis tools
-
Free tier offers advanced analytics for most users
cons
-
Data sampling can limit accuracy for large datasets
-
Privacy and consent management require extra configuration
-
Real-time reporting is limited compared to some competitors
-

Eloqua
Visit WebsiteThis is an aggregated rating for this tool including ratings from Crozdesk users and ratings from other sites.4.3 -
Optimizely
Visit WebsiteThis is an aggregated rating for this tool including ratings from Crozdesk users and ratings from other sites.4.2 -
Uberflip
Visit WebsiteThis is an aggregated rating for this tool including ratings from Crozdesk users and ratings from other sites.4.3


How We Test & Score Tools
We’ve spent years building, refining, and improving our software testing and scoring system. The rubric is designed to capture the nuances of software selection and what makes a tool effective, focusing on critical aspects of the decision-making process.
Below, you can see exactly how our testing and scoring works across seven criteria. It allows us to provide an unbiased evaluation of the software based on core functionality, standout features, ease of use, onboarding, customer support, integrations, customer reviews, and value for money.
Core Functionality (25% of final scoring)
The starting point of our evaluation is always the core functionality of the tool. Does it have the basic features and functions that a user would expect to see? Are any of those core features locked to higher-tiered pricing plans? At its core, we expect a tool to stand up against the baseline capabilities of its competitors.
Standout Features (25% of final scoring)
Next, we evaluate uncommon standout features that go above and beyond the core functionality typically found in tools of its kind. A high score reflects specialized or unique features that make the product faster, more efficient, or offer additional value to the user.
We also evaluate how easy it is to integrate with other tools typically found in the tech stack to expand the functionality and utility of the software. Tools offering plentiful native integrations, 3rd party connections, and API access to build custom integrations score best.
Ease of Use (10% of final scoring)
We consider how quick and easy it is to execute the tasks defined in the core functionality using the tool. High scoring software is well designed, intuitive to use, offers mobile apps, provides templates, and makes relatively complex tasks seem simple.
Onboarding (10% of final scoring)
We know how important rapid team adoption is for a new platform, so we evaluate how easy it is to learn and use a tool with minimal training. We evaluate how quickly a team member can get set up and start using the tool with no experience. High scoring solutions indicate little or no support is required.
Customer Support (10% of final scoring)
We review how quick and easy it is to get unstuck and find help by phone, live chat, or knowledge base. Tools and companies that provide real-time support score best, while chatbots score worst.
Customer Reviews (10% of final scoring)
Beyond our own testing and evaluation, we consider the net promoter score from current and past customers. We review their likelihood, given the option, to choose the tool again for the core functionality. A high scoring software reflects a high net promoter score from current or past customers.
Value for Money (10% of final scoring)
Lastly, in consideration of all the other criteria, we review the average price of entry level plans against the core features and consider the value of the other evaluation criteria. Software that delivers more, for less, will score higher.
Core Features
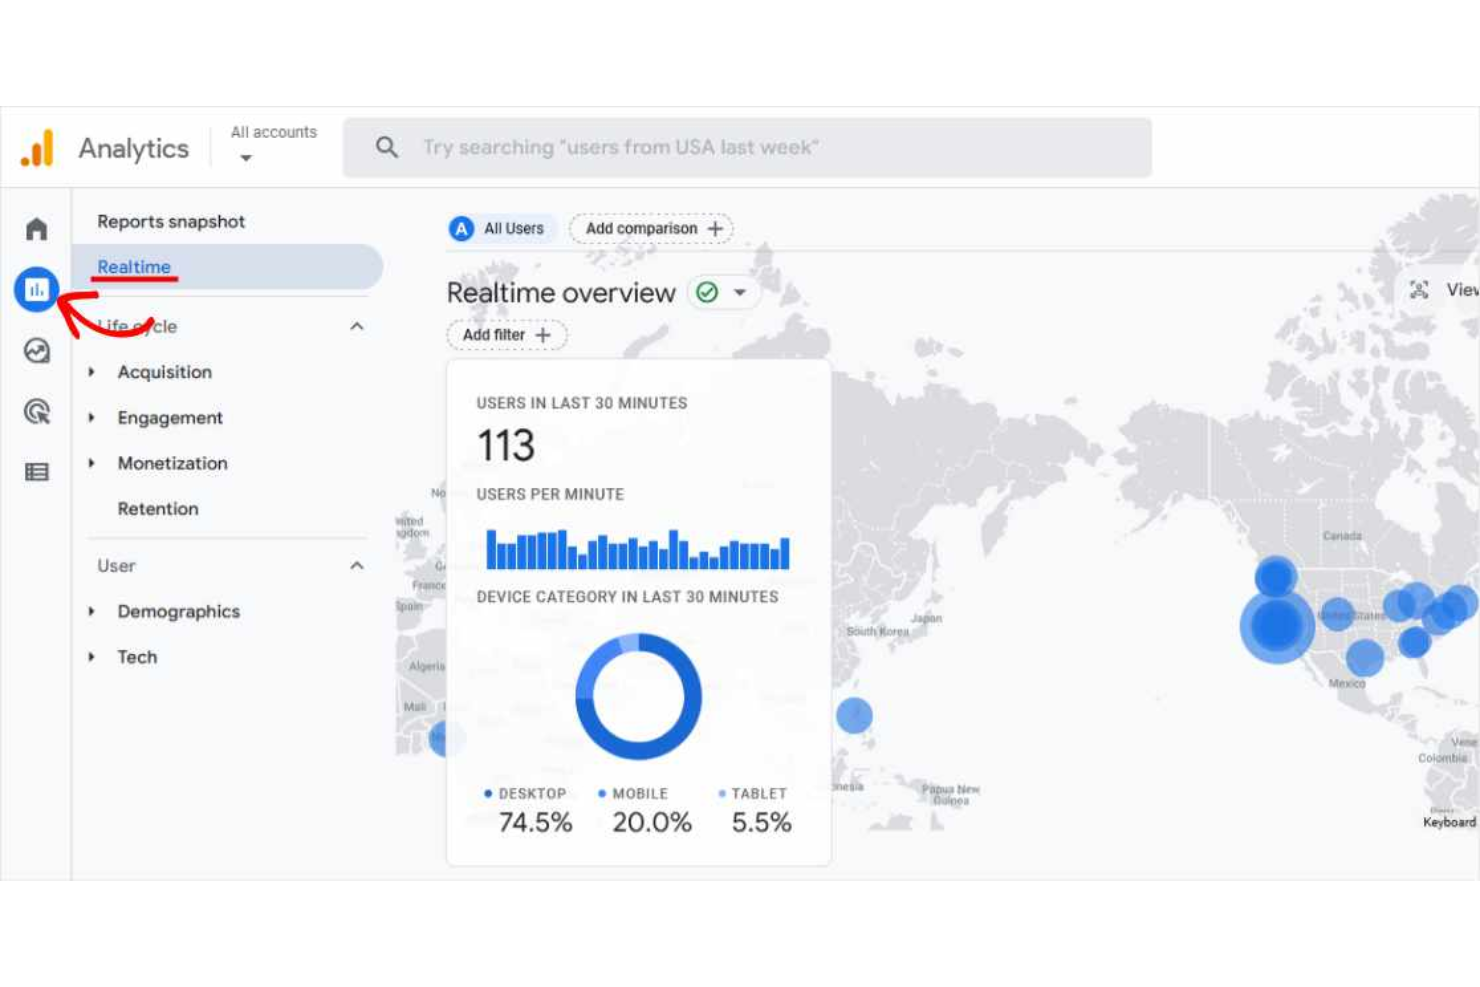
Real-Time Reporting
See live user activity, traffic sources, and top-performing pages as they happen. This helps you monitor campaign launches and sudden traffic spikes instantly.
Audience Segmentation
Group users by demographics, behavior, or custom criteria for targeted analysis. You can compare how different segments interact with your site or campaigns.
Conversion Tracking
Set up goals and events to measure sign-ups, purchases, or downloads. Track the full customer journey from first visit to conversion.
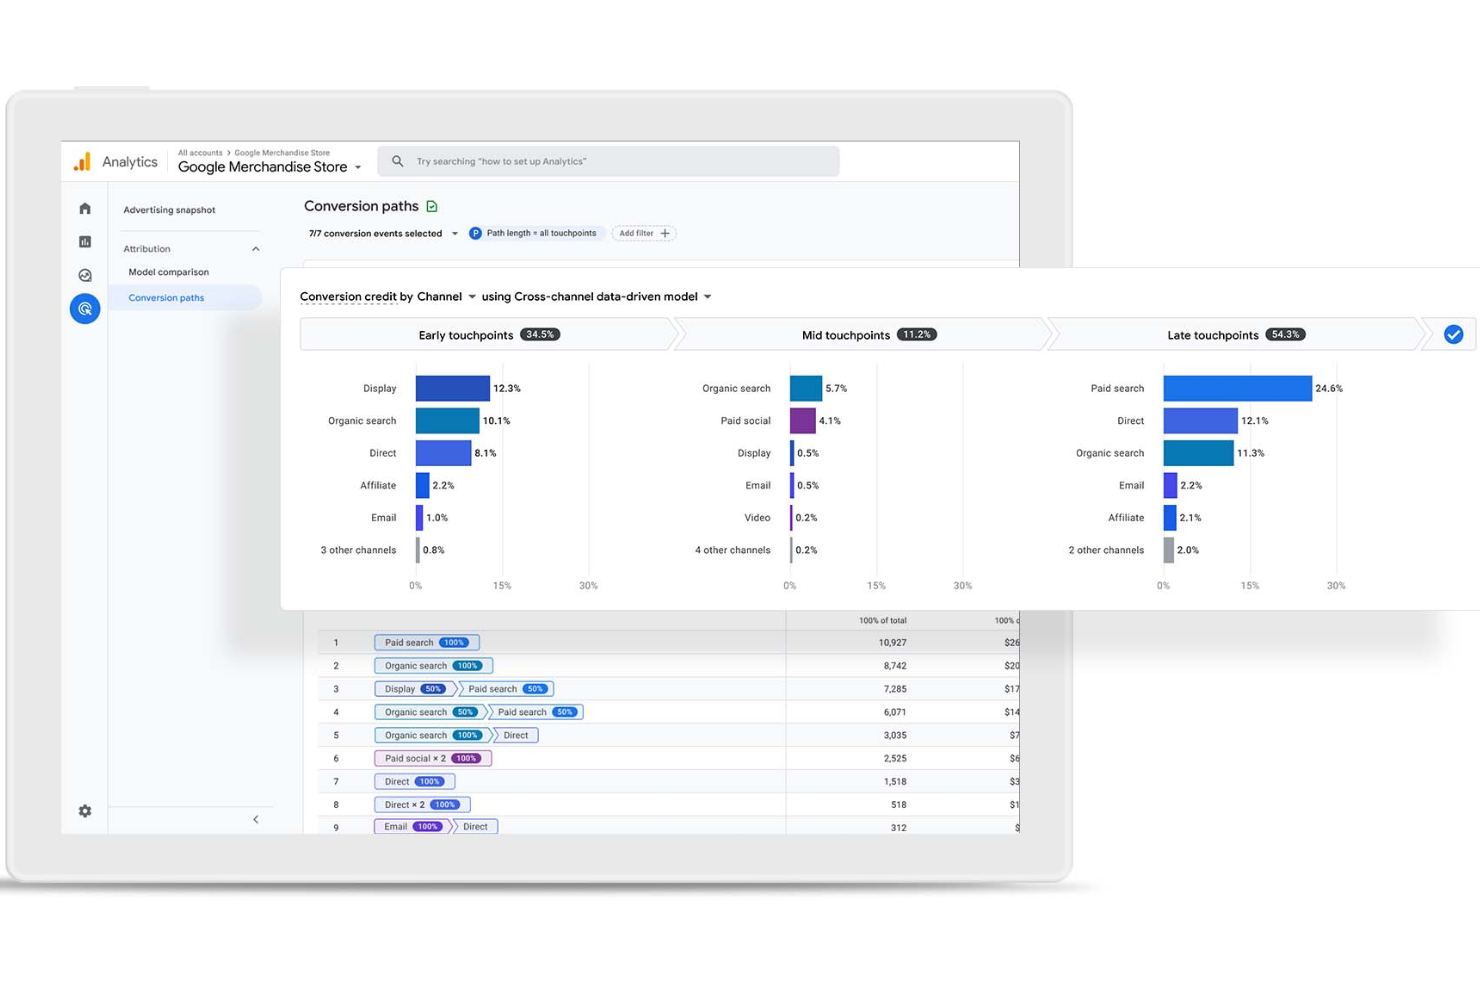
Multi-Channel Attribution
Analyze how different marketing channels contribute to conversions. Attribute value across paid, organic, referral, and direct sources.
Custom Dashboards
Build personalized dashboards with the metrics and visualizations you care about most. Share these dashboards with your team for focused reporting.
Funnel Analysis
Visualize user drop-off at each stage of your sales or signup process. Identify bottlenecks and optimize steps to improve conversion rates.
Ease of Use
Google Analytics offers powerful tools, but the interface can feel overwhelming for new users, especially when setting up custom reports or advanced tracking. Many users mention that navigating menus and finding specific metrics takes practice. However, once you’re familiar with the layout, the depth of data and customization options make it a strong choice for marketers who want detailed insights and control over their analytics environment.
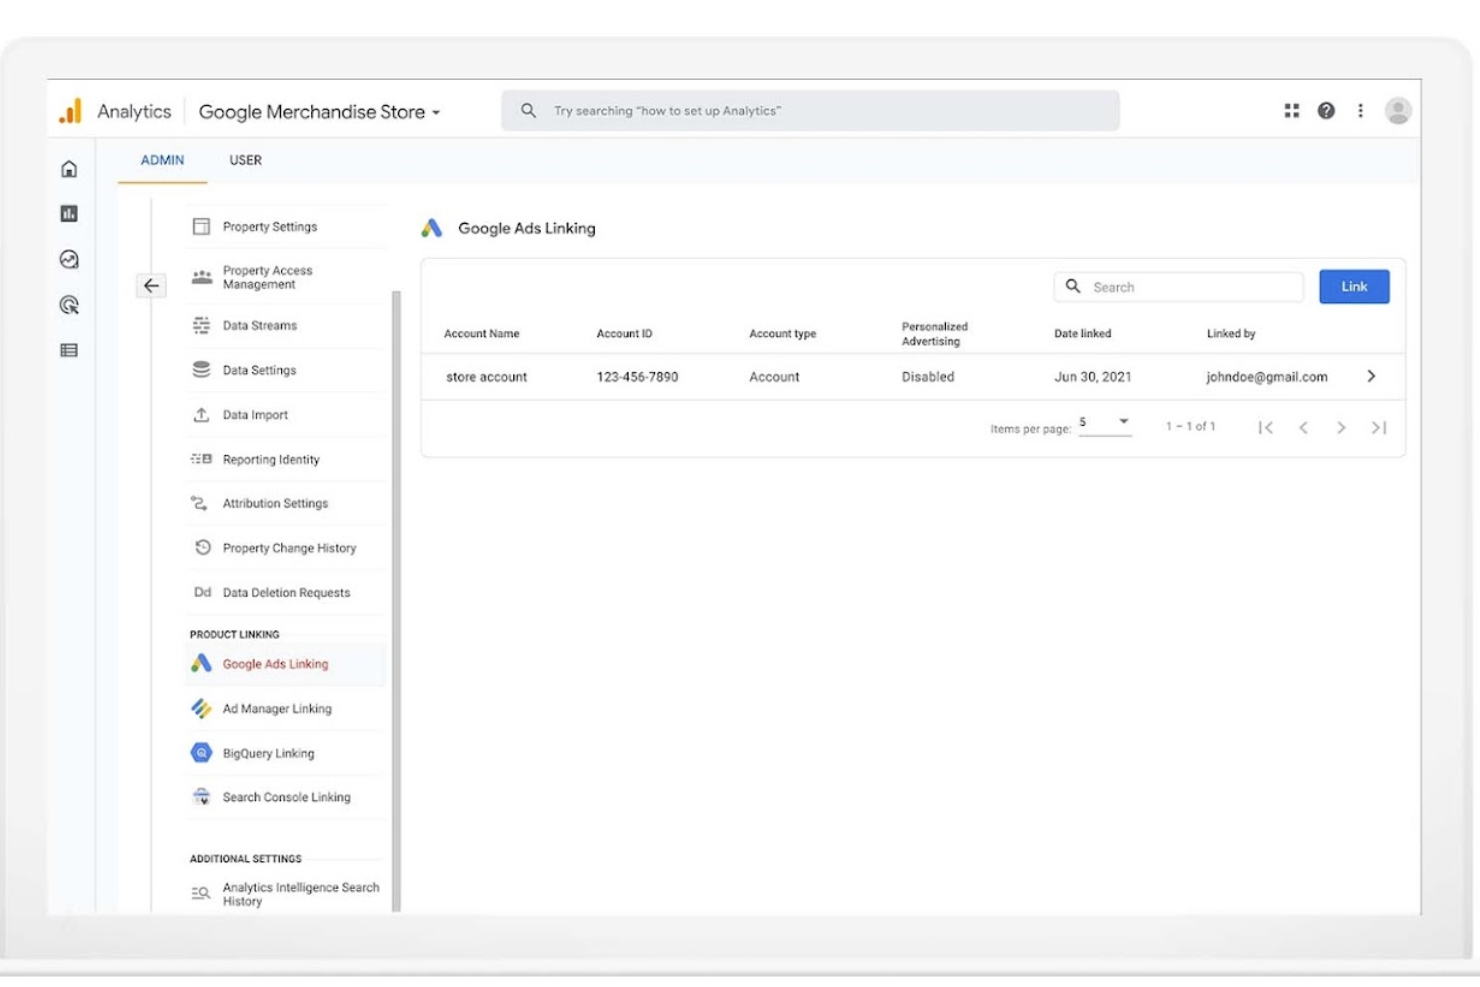
Integrations
Google Analytics integrates with Google Ads, Search Ads 360, Display & Video 360, Google Cloud, Google Search Console, Google Tag Manager, Google Optimize, Google Data Studio, Firebase, and BigQuery, among others.
Google Analytics also offers a robust API and connects with third-party integration tools.

Google Analytics Specs
- A/B Testing
- AI Integration
- Analytics
- API
- Big Data
- Campaign Management
- Conversion Tracking
- Custom Reports
- Dashboard
- Data Export
- Data Import
- Data Visualization
- External Integrations
- Feedback Management
- Keyword Tracking
- Landing Pages
- Link Tracking
- Multi-User
- Notifications
- Process Reporting
- Referral Tracking
- Sentiment Analysis
- SEO
- Workflow Management