

Uma ferramenta de relatórios do Instagram é uma ferramenta de análise que recolhe, analisa e visualiza dados das suas contas de redes sociais para ajudar a acompanhar o desempenho e medir os resultados. Se está à procura da melhor ferramenta de relatórios do Instagram, provavelmente precisa de comprovar o retorno do investimento, monitorizar o impacto das campanhas e partilhar relatórios mensais com a sua equipa ou clientes. Muitas plataformas disponibilizam painéis completos com funcionalidades baseadas em IA que destacam as principais métricas e fornecem informações práticas para melhorar os seus esforços de marketing. Com funcionalidades como relatórios automatizados e modelos personalizáveis, estas ferramentas ajudam a simplificar a análise e a tomada de decisões. Este guia apresenta as principais ferramentas de relatórios do Instagram para 2026, para que possa comparar funcionalidades, compreender o que distingue cada uma e escolher a solução certa para levar a sua estratégia de marketing mais longe.
Why Trust Our Software Recommendations
6,700+
Reviews
20
Industry experts
16+
Evaluation factors
14
Years
Our team has been testing and reviewing software since 2012. As marketing leaders ourselves, we know how difficult—and important—it is to choose the right software.
For this guide, we evaluated tools using hands-on testing and independent research, scoring tools using our selection criteria.
Our reviews reflect our human editorial judgment, not a sales pitch.
Expert reviewers:
 Gui DrusinaCreative Director
- Shriya GhateSenior Marketing Lead
 Amanda JacquesMarketing Ops Leader

Tabela comparativa de ferramentas de relatórios do Instagram
A tabela abaixo compara os detalhes de preços das minhas principais escolhas de ferramentas de relatórios do Instagram.
| Tool | Best For | Trial Info | Price | ||
|---|---|---|---|---|---|
| 1 | Best with multilingual sentiment analysis | Free trial available | From $199/month (billed annually) | Website | |
| 2 | Best for client-ready report templates | Free demo + 14-day free trial | From $20/client/month (billed annually) | Website | |
| 3 | Best for competitive social media benchmarking | 14-day free trial + free demo available | From $199/month (billed annually) | Website | |
| 4 | Best for cross-platform data aggregation | Free demo available | From $812/month (billed annually) | Website | |
| 5 | Best for advanced data pipeline integrations | Free plan + free demo available | From $100/month | Website | |
| 6 | Best for in-depth visual performance analytics | 14-day free trial and free plan available | From $33/month (billed annually) | Website | |
| 7 | Best for real-time KPI tracking | Free plan + 14-day free trial + free demo available | From $71/month (billed annually) | Website | |
| 8 | Best for unified analytics across networks | Free plan available | From $20/month | Website | |
| 9 | Best for customizable white-label dashboards | 14-day free trial available | From $20/month | Website | |
| 10 | Best for automated multi-channel report scheduling | 14-day free trial + free plan available | From $12.5/account/month (billed annually) | Website |


Avaliações de ferramentas de relatórios do Instagram
Abaixo encontram-se os meus resumos detalhados das ferramentas de relatórios do Instagram que entraram na minha lista restrita. As minhas avaliações apresentam uma análise detalhada das funcionalidades, integrações e melhores casos de utilização de cada plataforma, para ajudar a encontrar a opção mais adequada para si.
 Best with multilingual sentiment analysis
- Free trial available
- From $199/month (billed annually)
Visit WebsiteCustomer Rating:4.7/5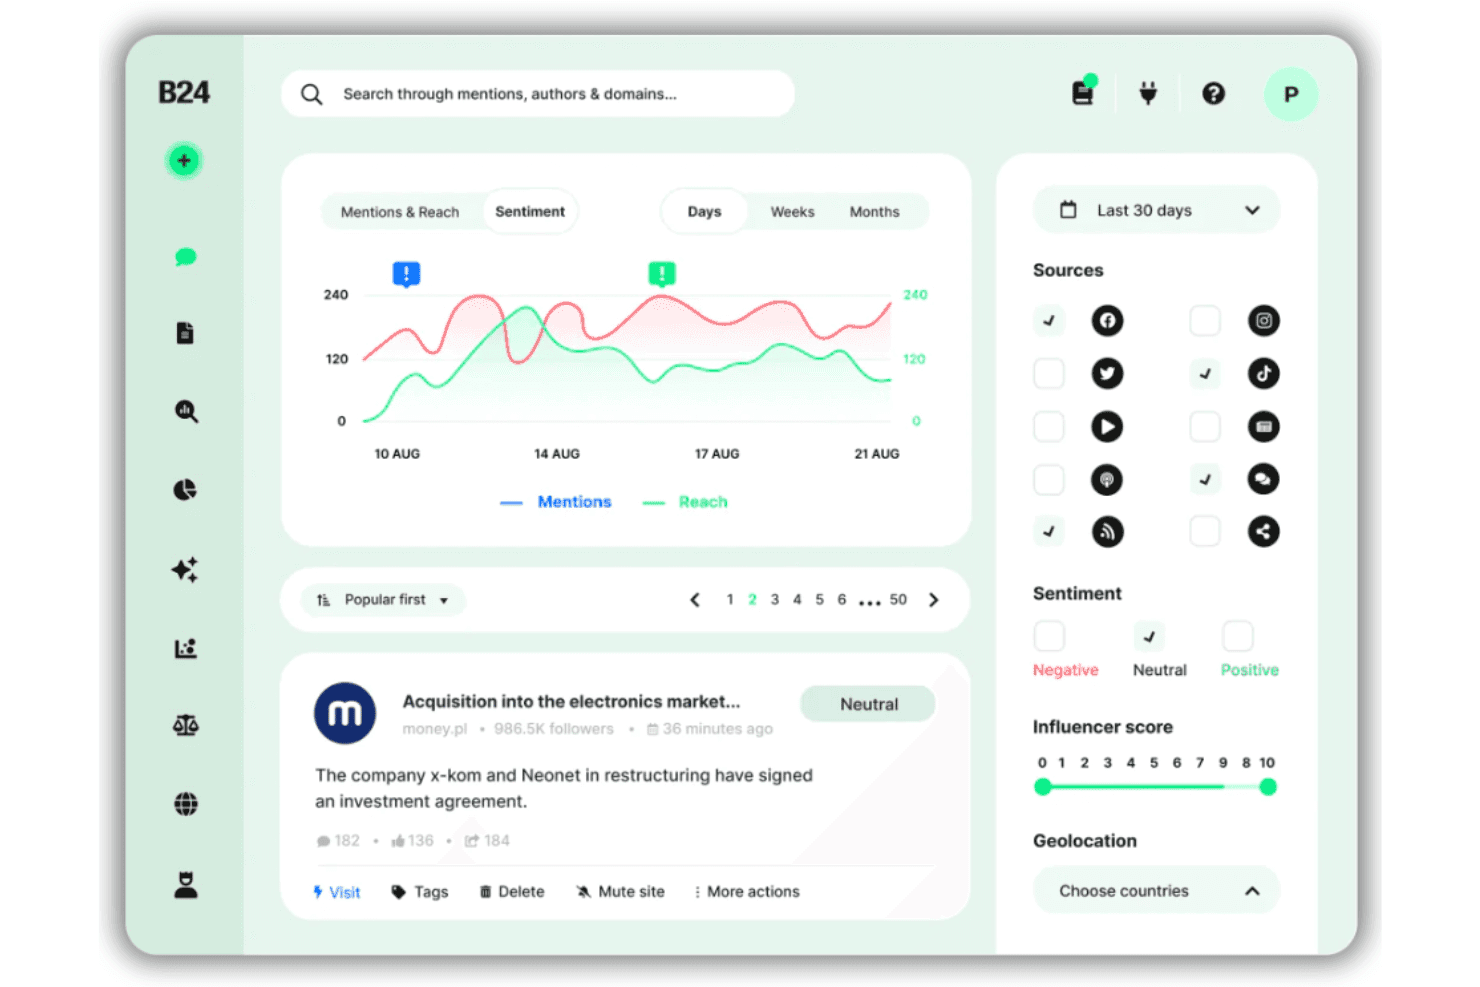
Brand24 offers a sentiment analysis dashboard with mention tracking, reach metrics, source filtering, and influencer scoring across social media platforms. Brand24 is an AI-powered social listening platform that tracks Instagram mentions, hashtag performance, sentiment, and competitor share of voice across 25M+ online sources in real time.
Who Is Brand24 Best For?
Brand24 suits marketing and PR teams at global brands or agencies that need to track Instagram sentiment and mentions across multiple languages and regions.
Why I Picked Brand24
Brand24 earns its spot as one of the best on my shortlist because its sentiment analysis covers 108 languages, which is rare among Instagram reporting tools. I love how AI Events Detection automatically flags spikes in brand mentions, so I can pinpoint the exact Instagram moment that shifted audience sentiment. The AI Insights feature then turns that raw multilingual data into a ready-to-share report without manual interpretation.
Brand24 Key Features
- QuickShare report links: Generate instant, shareable report links with adjustable date ranges for clients or teammates.
- Hashtag tracking: Monitor the reach, volume, and activity of any Instagram hashtag in real time.
- Competitor mention benchmarking: Compare share of voice and sentiment against competing brands across Instagram and other channels.
- Multi-platform source coverage: Collect and analyze brand mentions from Instagram, TikTok, Facebook, YouTube, Reddit, and more in one dashboard.
Brand24 Integrations
Brand24 offers native integrations with Slack and Microsoft Teams. An API is available for custom integrations.
Pros and Cons
Pros:
- Real-time competitor share of voice tracking
- AI detects sudden mention spikes automatically
- Sentiment analysis spans 108 languages
Cons:
- Mention caps limit large agency workflows
- Stories and Reels metrics not fully supported
Learn more about Brand24: Best for client-ready report templates
- Free demo + 14-day free trial
- From $20/client/month (billed annually)
Visit WebsiteCustomer Rating:4.7/5
AgencyAnalytics structures agency performance data. If you manage Instagram analytics for multiple clients, AgencyAnalytics gives you a way to centralize and automate your reporting. The platform is designed for agencies and marketing teams that need to deliver polished, data-rich Instagram reports without manual effort. With its focus on ready-made templates and visual dashboards, it helps you present Instagram performance in a format clients can quickly understand.
Who Is AgencyAnalytics Best For?
AgencyAnalytics is a strong choice for marketing agencies and consultants who need to deliver professional Instagram analytics reports to clients.
Why I Picked AgencyAnalytics
What makes AgencyAnalytics stand out for Instagram reporting is its library of client-ready report templates. These templates let you quickly generate polished Instagram analytics reports without having to build layouts from scratch. I like that you can customize these templates with your agency’s branding and adjust the metrics to match each client’s needs. This approach saves time and ensures that every Instagram report looks professional and is easy for clients to understand.
AgencyAnalytics Key Features
Some other features that make AgencyAnalytics useful for Instagram reporting include:
- Instagram stories analytics: Track reach, impressions, and engagement for Instagram stories in dedicated widgets.
- Automated report scheduling: Set up recurring Instagram analytics reports to be sent to clients on a custom schedule.
- Drag-and-drop dashboard builder: Build custom Instagram dashboards by adding, removing, or rearranging widgets.
- White-label client portal: Give clients direct access to their Instagram analytics through a branded, secure online portal.
AgencyAnalytics Integrations
Integrations include Instagram, Instagram Ads, Facebook, Google Analytics 4, Google Ads, LinkedIn, LinkedIn Ads, TikTok, YouTube, Mailchimp, and more.
Pros and Cons
Pros:
- Multi-account Instagram data management in one place
- White-label reporting supports agency branding needs
- Prebuilt Instagram analytics widgets save setup time
Cons:
- Mobile dashboard editing is not supported
- Instagram story analytics lack advanced breakdowns
Learn more about AgencyAnalytics: Best for competitive social media benchmarking
- 14-day free trial + free demo available
- From $199/month (billed annually)
Visit WebsiteCustomer Rating:4.6/5
Rival IQ visualizes social performance data across channels. If you need to track how your Instagram performance stacks up against competitors, Rival IQ gives you a focused analytics platform. The tool is built for marketers and agencies who want to benchmark Instagram metrics and spot trends across multiple brands. It helps you identify where your content stands out and where you might be falling behind in your industry.
Who Is Rival IQ Best For?
Rival IQ is a strong fit for marketing teams and agencies that need to benchmark Instagram performance against competitors in their industry.
Why I Picked Rival IQ
What sets Rival IQ apart for Instagram reporting is its focus on competitive benchmarking. I picked this tool because it lets you track your Instagram metrics side by side with those of your competitors, so you can see exactly where you lead or lag in your industry. Rival IQ’s customizable dashboards and automated competitor tracking make it easy to monitor engagement rates, follower growth, and content performance across multiple brands. This approach gives you actionable context for your Instagram results, not just raw numbers.
Rival IQ Key Features
Some other Rival IQ features that support Instagram reporting include:
- Hashtag tracking: Monitor the performance and reach of specific hashtags used in your Instagram posts.
- Instagram stories analytics: Access metrics for story views, completion rates, and engagement.
- Historical data exports: Download past Instagram performance data for deeper analysis or presentations.
- Automated alerts: Receive notifications when there are significant changes in your Instagram metrics or competitor activity.
Rival IQ Integrations
Native integrations are not currently listed. However, Rival IQ does offer an API for custom integrations.
Pros and Cons
Pros:
- Historical Instagram data exports are supported
- Automated Instagram performance alerts are available
- Competitor Instagram benchmarking is highly detailed
Cons:
- Instagram ad analytics are limited
- Instagram influencer tracking is not included
Learn more about Rival IQ: Best for cross-platform data aggregation
- Free demo available
- From $812/month (billed annually)
Visit WebsiteCustomer Rating:4.5/5
Whatagraph turns marketing data into clear, easy-to-read reports and dashboards. If you need to bring together Instagram data with metrics from other platforms, Whatagraph is built for that kind of cross-channel reporting. Marketing teams and agencies use it to create unified reports that combine Instagram analytics with data from dozens of other sources. This approach helps you see how Instagram fits into your broader marketing performance without switching between multiple dashboards.
Who Is Whatagraph Best For?
Whatagraph suits marketing agencies and in-house teams that need to consolidate Instagram analytics with data from multiple marketing channels.
Why I Picked Whatagraph
I picked Whatagraph because it makes cross-platform data aggregation for Instagram reporting straightforward and flexible. The platform lets you pull Instagram metrics alongside data from other social channels, paid ads, and web analytics into a single, unified report. I like that you can automate these multi-source reports and customize them with widgets, so you always see the metrics that matter most to your team or clients. This approach is especially useful if you need to show Instagram’s impact as part of a bigger marketing picture.
Whatagraph Key Features
Some other features that make Whatagraph useful for Instagram reporting include:
- White-label reporting: Create reports with your own branding, colors, and logos for client-facing presentations.
- Scheduled report delivery: Set up automated email delivery of Instagram reports to stakeholders on a recurring basis.
- Pre-built Instagram templates: Use ready-made templates designed specifically for Instagram analytics to speed up report creation.
- Team collaboration tools: Invite team members to collaborate on report building and data analysis within the platform.
Whatagraph Integrations
Integrations include Facebook, Instagram, LinkedIn, Pinterest, TikTok, YouTube, Google Analytics 4, Google Ads, HubSpot, Shopify, and more.
Pros and Cons
Pros:
- Enables team collaboration on Instagram analytics
- Allows multi-account Instagram reporting
- Combines Instagram with other channel data
Cons:
- Instagram data refresh can be delayed
- Limited control for advanced data modeling
 Best for advanced data pipeline integrations
- Free plan + free demo available
- From $100/month
Visit WebsiteCustomer Rating:4.5/5
Improvado aggregates marketing data to deliver advanced analytics and performance insights. Improvado is a marketing data platform designed for teams that need to centralize and analyze Instagram data alongside other marketing sources. It appeals to data-driven marketers, agencies, and enterprises looking to automate complex data collection and reporting workflows. If you need to connect Instagram insights with a wide range of analytics and business intelligence tools, Improvado helps bridge those gaps.
Who Is Improvado Best For?
Improvado is a strong fit for marketing analytics teams at mid-sized to enterprise companies that need to unify Instagram data with other marketing and sales sources.
Why I Picked Improvado
I chose Improvado because it offers advanced data pipeline integrations that go far beyond basic Instagram analytics exports. For teams that need to blend Instagram data with dozens of other marketing, sales, and analytics sources, Improvado’s automated data connectors and transformation tools are especially valuable. I appreciate how you can map, normalize, and push Instagram metrics directly into your preferred business intelligence or data warehouse environment. This level of flexibility is ideal if your reporting needs require custom data models or cross-channel attribution.
Improvado Key Features
Some other features that make Improvado useful for Instagram reporting include:
- Custom dashboard builder: Create tailored dashboards to visualize Instagram metrics alongside other marketing data.
- Data transformation engine: Apply rules and formulas to Instagram data before it reaches your reporting tools.
- Automated data extraction: Schedule regular pulls of Instagram analytics without manual intervention.
- Role-based access controls: Manage who can view, edit, or share Instagram reports within your organization.
Improvado Integrations
Integrations include Instagram Organic, Facebook Ads, Google Analytics 4, TikTok Ads, LinkedIn Ads, Pinterest Ads, HubSpot, Shopify, Amazon Advertising, YouTube, and more.
Pros and Cons
Pros:
- Offers advanced data transformation for Instagram
- Enables automated Instagram data extraction
- Supports custom Instagram metric mapping
Cons:
- Instagram data syncs may have occasional delays
- Requires setup for Instagram data normalization
Learn more about Improvado: Best for in-depth visual performance analytics
- 14-day free trial and free plan available
- From $33/month (billed annually)
Visit WebsiteCustomer Rating:4.4/5
Iconosquare helps brands track social media engagement and manage conversations in one place. If you need to dig deep into your Instagram visual content performance, Iconosquare offers analytics built for brands and agencies. The platform appeals to marketing teams who want to understand how images, videos, and stories drive engagement and reach. Iconosquare helps you spot trends in your visual strategy and optimize content based on detailed reporting.
Who Is Iconosquare Best For?
Iconosquare is a strong fit for social media managers and agencies that need advanced analytics on Instagram visual content performance.
Why I Picked Iconosquare
What drew me to Iconosquare for Instagram reporting is its focus on visual performance analytics. The platform gives you granular insights into how your images, videos, and stories perform, breaking down metrics like reach, impressions, and engagement for each content type. I appreciate that you can drill into post-level analytics and compare visual formats to see what resonates most with your audience. This level of detail is especially useful for brands and agencies that rely on strong visual storytelling to drive results on Instagram.
Iconosquare Key Features
Some other features that make Iconosquare valuable for Instagram reporting include:
- Competitor tracking: Monitor and compare your Instagram performance against selected competitors to identify strengths and gaps.
- Hashtag analytics: Track the reach and engagement of specific hashtags used in your posts and stories.
- Customizable dashboards: Build dashboards with the metrics and widgets that matter most to your team or clients.
- Automated reporting: Schedule and send recurring Instagram performance reports directly to stakeholders or clients.
Iconosquare Integrations
Integrations include Instagram, Facebook, TikTok, LinkedIn, X (Twitter), Pinterest, Threads, YouTube, Dropbox, OneDrive, Zapier, and more.
Pros and Cons
Pros:
- Instagram stories analytics are built in
- Instagram hashtag tracking is included
- Historical Instagram data exports are supported
Cons:
- Instagram API connection setup can be complex
- Does not support direct posting for all social platforms
Learn more about Iconosquare: Best for real-time KPI tracking
- Free plan + 14-day free trial + free demo available
- From $71/month (billed annually)
Visit WebsiteCustomer Rating:4.5/5
Databox helps teams track performance by aggregating metrics across tools and platforms. Databox gives marketing teams a way to monitor Instagram metrics alongside other business KPIs in real time. The platform is a good fit for agencies and brands that want to centralize social analytics and quickly spot trends across multiple data sources. If you need to keep Instagram performance visible and actionable for your team, Databox offers a flexible dashboard approach.
Who Is Databox Best For?
Databox suits marketing teams and agencies that need to track Instagram and other KPIs in real time across multiple campaigns.
Why I Picked Databox
What stands out about Databox for Instagram reporting is its real-time KPI tracking, which is especially valuable for teams that need up-to-the-minute insights. I picked Databox because it lets you build custom dashboards that pull in Instagram metrics alongside data from other marketing and sales platforms, so you can monitor everything in one place. The platform’s live data visualizations and automated alerts help you catch sudden changes in Instagram engagement or reach as they happen. For anyone who needs to keep a constant pulse on Instagram performance and quickly react to trends, Databox’s real-time approach is a strong fit.
Databox Key Features
Some other features that make Databox useful for Instagram reporting include:
- Pre-built Instagram templates: Choose from ready-made dashboard templates designed specifically for Instagram analytics.
- Scheduled report delivery: Set up automated email delivery of Instagram performance reports to your team or clients.
- Goal tracking for Instagram metrics: Define and monitor progress toward specific Instagram KPIs within your dashboards.
- Mobile app access: View and manage Instagram analytics dashboards from Databox’s dedicated mobile app.
Databox Integrations
Integrations include Instagram Business, Facebook Ads, Google Analytics 4, HubSpot, Shopify, LinkedIn Ads, Mailchimp, Google Sheets, Salesforce, and more.
Pros and Cons
Pros:
- Goal tracking for Instagram KPIs included
- Pre-built Instagram analytics templates available
- Scheduled Instagram report delivery via email
Cons:
- Advanced Instagram sentiment analysis not available
- Data connectors can be unstable
Learn more about Databox: Best for unified analytics across networks
- Free plan available
- From $20/month
Visit WebsiteCustomer Rating:4.4/5
Metricool helps teams monitor engagement, impressions, and growth across social channels. If you manage multiple social channels and want a single place to track Instagram alongside other platforms, Metricool is worth a look. The platform appeals to marketers and agencies who need unified analytics and content management for Instagram, Facebook, X, and more. It helps simplify reporting and scheduling for teams juggling several accounts and networks.
Who Is Metricool Best For?
Metricool fits marketing teams and agencies that need unified analytics and scheduling across multiple social media platforms, including Instagram.
Why I Picked Metricool
What drew me to Metricool is how it brings Instagram analytics together with data from other social networks in one dashboard. This unified view makes it much easier to compare Instagram performance alongside Facebook, X, LinkedIn, and more, without switching between tools. I also appreciate that Metricool lets you schedule posts and analyze results for multiple accounts in a single place, which is especially useful for agencies or teams managing several brands. For anyone who needs to track Instagram as part of a broader social media strategy, Metricool’s cross-network analytics are a strong fit.
Metricool Key Features
Some other features that make Metricool useful for Instagram reporting include:
- Hashtag tracking: Track the performance of specific hashtags used in your Instagram posts and campaigns.
- Instagram reels analytics: Access dedicated analytics for Instagram Reels, including reach and engagement metrics.
- Competitor analysis: Monitor and compare Instagram metrics against selected competitors’ accounts.
- Custom report builder: Create and export tailored Instagram reports with selected metrics and branding.
Metricool Integrations
Integrations include Instagram, Facebook, TikTok, YouTube, LinkedIn, Pinterest, Google Business Profile, Shopify, Canva, Google Drive, and more.
Pros and Cons
Pros:
- Custom Instagram report builder with export options
- Instagram reels and hashtag performance tracking
- Unified Instagram and cross-network analytics dashboard
Cons:
- Instagram ad analytics less detailed than organic
- Historical data access is limited
Learn more about Metricool: Best for customizable white-label dashboards
- 14-day free trial available
- From $20/month

Reporting Ninja creates customizable marketing and analytics reports from multiple data sources. Reporting Ninja gives marketing teams and agencies a way to create detailed Instagram analytics dashboards tailored to their brand. The platform is designed for professionals who need to present client-ready reports with flexible data visualization options. If you want to combine Instagram insights with other marketing data in a single, customizable view, Reporting Ninja offers a focused solution.
Who Is Reporting Ninja Best For?
Reporting Ninja is a good fit for marketing agencies and consultants who need to deliver branded, customizable Instagram analytics dashboards to clients.
Why I Picked Reporting Ninja
What drew me to Reporting Ninja is its focus on customizable white-label dashboards, which is especially valuable for agencies managing Instagram analytics for multiple clients. The platform lets you fully brand reports with your own logo, colors, and domain, so every Instagram dashboard looks like an extension of your agency. I also appreciate the flexible widget system, which allows you to build dashboards that highlight the exact Instagram metrics your clients care about. This level of customization makes it easy to deliver polished, client-ready Instagram reports that stand out from generic templates.
Reporting Ninja Key Features
Some other features that make Reporting Ninja useful for Instagram reporting include:
- Automated report scheduling: Set up recurring Instagram analytics reports to be sent to clients or team members on a custom schedule.
- Multi-channel data blending: Combine Instagram data with metrics from other marketing platforms in a single dashboard.
- Custom calculated metrics: Create your own Instagram KPIs by applying formulas to existing data fields.
- PDF and web report exports: Export Instagram dashboards as PDFs or share them via live web links for easy client access.
Reporting Ninja Integrations
Integrations include Google Analytics 4, Meta Ads, Instagram Insights, Google Ads, Facebook Insights, LinkedIn Ads, Mailchimp, Microsoft Advertising, YouTube, TikTok Ads, and more.
Pros and Cons
Pros:
- Multi-channel data blending in one dashboard
- Custom calculated metrics for Instagram KPIs
- White-label dashboards support full client branding
Cons:
- Limited Instagram story analytics granularity
- No Instagram post scheduling or publishing
Learn more about Reporting Ninja: 10Best for automated multi-channel report scheduling
Porter
- 14-day free trial + free plan available
- From $12.5/account/month (billed annually)

Porter helps teams track performance across marketing channels with automated reporting. Porter is a reporting platform designed for marketers and agencies who need to centralize Instagram analytics alongside other channels. The tool connects directly to your data sources and brings your metrics into Google Looker Studio for easy visualization. If you want to automate reporting and reduce manual data pulls, Porter offers a focused solution.
Who Is Porter Best For?
Porter is a good fit for marketing teams and agencies that need to automate Instagram and multi-channel reporting within Google Looker Studio.
Why I Picked Porter
I picked Porter because its automated multi-channel report scheduling stands out for teams managing multiple Instagram accounts and other social platforms. The platform lets you set up recurring reports that pull fresh Instagram analytics into Google Looker Studio without manual intervention. I appreciate how you can customize the frequency and content of these reports, making it easy to keep stakeholders updated. This automation is especially useful for agencies or marketers who need to deliver consistent, timely insights across several client accounts.
Porter Key Features
Some other features that make Porter useful for Instagram reporting include:
- Pre-built Instagram templates: Choose from ready-made templates to quickly visualize your Instagram metrics in Google Looker Studio.
- Custom field mapping: Map Instagram data fields to your preferred report structure for more tailored analytics.
- Multi-account connections: Connect and report on multiple Instagram accounts from a single Porter workspace.
- Scheduled email delivery: Automatically send Instagram reports to stakeholders on a set schedule directly from the platform.
Porter Integrations
Integrations include Instagram, Meta Ads, Google Ads, Google Analytics 4, Shopify, HubSpot, LinkedIn Ads, TikTok Ads, Google Sheets, Looker Studio, and more.
Pros and Cons
Pros:
- Supports multiple Instagram accounts per workspace
- Pre-built Instagram analytics templates available
- Automated multi-channel report scheduling options
Cons:
- Lacks advanced Instagram competitor benchmarking
- No sentiment analysis for Instagram comments
Learn more about Porter:
Outras ferramentas de relatórios do Instagram
Eis algumas opções adicionais de ferramentas de relatórios do Instagram que não entraram na minha lista restrita, mas que ainda vale a pena conhecer:
- 11InsTrackBest for mobile-first analytics access
- 12DashThisBest for quick drag-and-drop dashboard creation
- 13Social StatusBest for granular engagement breakdowns
- 14BufferBest for collaborative post performance tracking
- 15PallyyBest for visual content calendar reporting
How I Evaluate Instagram Reporting Tools
I split Instagram reporting tools into two layers: baseline requirements every tool must meet, and differentiators—like white-labeling and data depth—that determine fit for agencies or in-house teams.
Core Functionality (Table Stakes For This List)
When I'm selecting tools for my list, I rank each one on a scale from 0 (does not offer the functionality) to 5 (excels in this area) for each core functionality listed below. Then, I calculate the tool's total score into a percentage. Each tool needs to achieve a minimum total score of 65% to be considered for inclusion.
- Instagram Metrics Tracking: I check whether a tool pulls data for all content types—Feed, Reels, Stories, Carousels—and goes beyond likes to include saves, shares, and reach.
- Custom Report Building: Each tool should let you pick specific KPIs, adjust date ranges, and add branding so reports match what a client or CMO actually wants to see.
- Automated Report Scheduling: I look for recurring delivery options—weekly PDF to a client inbox or a monthly CSV drop—so reporting doesn't eat into your team's sprint time.
- Audience & Engagement Analytics: A good tool breaks down followers by age, location, and gender, and surfaces engagement patterns like best posting times per audience segment.
- Competitor Benchmarking: I evaluate whether you can add competitor profiles and compare metrics side by side, which is essential for quarterly reviews and pitch decks.
- Hashtag & Content Analysis: The tool should surface which hashtags drive reach and identify top-performing content themes, not just list the tags you've already used.
Once I have a list of tools that meet this criteria, I consider what sets each platform apart.
Differentiating Factors (What Sets Vendors Apart)
Here's how I compare and contrast different vendors:
Standout Features
I pay close attention to whether a tool offers live interactive dashboards—clients and stakeholders who can filter data themselves ask fewer follow-up questions. Multi-platform reporting matters too, especially when your team manages Instagram alongside TikTok or LinkedIn and needs one unified view for monthly reviews. I also evaluate influencer campaign tracking, since measuring creator-level performance and earned media value in the same place you pull organic metrics saves real time during campaign wrap-ups.
Beyond Features
Data accuracy and historical depth are a big deal here. I check whether a tool pulls data through the official Instagram Graph API and how far back it retains metrics, since Instagram's native 90-day window rarely covers a full campaign cycle. Integrations also shape my evaluation—teams that pipe Instagram data into Looker Studio or connect it to HubSpot for attribution need reliable native connectors or API access. For agencies, I look at white-labeling and client management, including branded report URLs, role-based permissions, and multi-account billing under one roof.
Como escolher uma ferramenta de relatórios do Instagram
É fácil ficar perdido entre listas extensas de funcionalidades e estruturas de preços complexas. Para ajudar a manter o foco enquanto analisa o seu processo específico de seleção de software, eis uma lista de verificação dos fatores a ter em conta:
| Fator | O que deve considerar |
|---|---|
| FatorEscalabilidade | O que deve considerarA ferramenta suportará o crescimento da sua conta, utilizadores adicionais ou vários perfis do Instagram à medida que as suas necessidades aumentam? |
| FatorIntegrações | O que deve considerarA ferramenta liga-se de forma nativa ao seu conjunto atual de ferramentas de marketing, como ferramentas de agendamento, CRM ou plataformas de análise? |
| FatorPersonalização | O que deve considerarPode adaptar painéis, relatórios ou notificações aos fluxos de trabalho e às necessidades de relatórios da sua equipa? |
| FatorFacilidade de utilização | O que deve considerarCom que rapidez podem os membros da equipa aprender a utilizar a ferramenta e aceder às informações de que precisam sem formação adicional? |
| FatorImplementação e integração inicial | O que deve considerarQue recursos, guias ou apoio disponibiliza o fornecedor para o ajudar a começar a trabalhar rapidamente? |
| FatorCusto | O que deve considerarOs níveis de preços são claros e estão alinhados com a sua utilização, dimensão da equipa e requisitos de elaboração de relatórios? Tenha atenção às taxas ocultas. |
| FatorMedidas de segurança | O que deve considerarA ferramenta segue as melhores práticas de privacidade dos dados e proteção das contas, especialmente no caso de credenciais sensíveis do Instagram? |
| FatorDisponibilidade do apoio | O que deve considerarQue canais de apoio são disponibilizados e estão disponíveis durante o seu horário de funcionamento ou na sua região? |
O que é uma ferramenta de relatórios do Instagram?
As ferramentas de relatórios do Instagram são plataformas de software especializadas que acompanham, analisam e visualizam os dados de desempenho de contas do Instagram. Estas ferramentas ajudam as equipas de marketing e os gestores de redes sociais a monitorizar métricas como o crescimento de seguidores, as taxas de interação e o alcance do conteúdo. Ao fornecer painéis claros e relatórios exportáveis, a ferramenta de relatórios do Instagram facilita a avaliação da eficácia das campanhas, a identificação de tendências e a definição de futuras estratégias de conteúdo — tudo a partir de uma única interface centralizada.
Funcionalidades da ferramenta de relatórios do Instagram
Ao selecionar uma ferramenta de relatórios do Instagram, procure as seguintes funcionalidades essenciais:
- Análise de seguidores: Acompanha as alterações no número de seguidores, identifica novos seguidores e pessoas que deixaram de seguir a conta e destaca as tendências de crescimento do público ao longo do tempo.
- Acompanhamento da interação: Mede gostos, comentários, partilhas e guardados nas publicações e histórias para ajudar a compreender que conteúdo desperta maior interesse junto do público.
- Relatórios de desempenho do conteúdo: Fornece análises detalhadas sobre o desempenho de publicações, histórias ou reels individuais, incluindo alcance, impressões e taxas de interação.
- Dados demográficos do público: Analisa dados dos seguidores, como idade, género, localização e horários de atividade, para apoiar a definição do público-alvo e o planeamento de conteúdos.
- Análise de hashtags: Monitoriza quais as hashtags que geram mais interação e alcance, ajudando a aperfeiçoar a estratégia de hashtags para obter maior visibilidade.
- Gestão de várias contas: Permite acompanhar e elaborar relatórios sobre várias contas do Instagram a partir de um único painel, facilitando o trabalho de agências ou equipas de grande dimensão.
- Painéis personalizáveis: Permite adaptar as visualizações analíticas e os relatórios para dar destaque às métricas e aos períodos mais relevantes para a equipa.
- Relatórios exportáveis: Permite descarregar ou partilhar dados analíticos em formatos como PDF ou CSV para apresentações, colaboração ou manutenção de registos.
- Atualizações de dados em tempo real: Fornece métricas e alertas atualizados, permitindo responder rapidamente a alterações no desempenho ou no comportamento do público.
- Comparação com a concorrência: Compara o desempenho da conta com o dos concorrentes para identificar pontos fortes, pontos fracos e novas oportunidades.
Benefícios da ferramenta de relatórios do Instagram
A implementação de uma ferramenta de relatórios do Instagram proporciona vários benefícios à equipa e à empresa. Eis alguns dos benefícios que pode esperar:
- Tomada de decisões baseada em dados: O acesso a painéis analíticos e relatórios claros ajuda a equipa a tomar decisões informadas sobre conteúdos e estratégia.
- Melhoria do desempenho das campanhas: O acompanhamento da interação e do desempenho dos conteúdos em tempo real permite identificar rapidamente o que está a funcionar e ajustar as campanhas no momento.
- Gestão eficiente de várias contas: Os painéis e as funcionalidades de elaboração de relatórios centralizados poupam tempo às equipas que gerem várias contas do Instagram em simultâneo.
- Melhor compreensão do público: A análise demográfica e comportamental revela quem são os seguidores e quando estão mais ativos, orientando uma melhor definição do público-alvo.
- Processos de elaboração de relatórios simplificados: Os relatórios exportáveis e personalizáveis facilitam a partilha de resultados com as partes interessadas e o registo da evolução ao longo do tempo.
- Informações sobre a concorrência: As ferramentas de comparação ajudam a comparar o desempenho com o dos concorrentes, revelando novas oportunidades e áreas a melhorar.
- Resposta mais rápida às tendências: As atualizações de dados e as notificações em tempo real permitem reagir rapidamente a aumentos ou diminuições da interação, protegendo a reputação da marca.
Custos e preços da ferramenta de relatórios do Instagram
A seleção de uma ferramenta de relatórios do Instagram exige uma compreensão dos vários modelos de preços e planos disponíveis. Os custos variam consoante as funcionalidades, a dimensão da equipa, os complementos e outros fatores. A tabela abaixo resume os planos mais comuns, os respetivos preços médios e as funcionalidades normalmente incluídas nas soluções de ferramentas de relatórios do Instagram:
Tabela de comparação de planos da ferramenta de relatórios do Instagram
| Tipo de plano | Preço médio | Funcionalidades comuns |
|---|---|---|
| Tipo de planoPlano gratuito | Preço médio$0 | Funcionalidades comunsAnálise básica, acompanhamento limitado de contas, histórico de dados restrito e métricas simples de interação. |
| Tipo de planoPlano pessoal | Preço médio$5-$25/utilizador/mês | Funcionalidades comunsPainel analítico completo, suporte para uma única conta, relatórios descarregáveis e informações básicas sobre o público. |
| Tipo de planoPlano empresarial | Preço médio$30-$80/utilizador/mês | Funcionalidades comunsGestão de várias contas, elaboração avançada de relatórios, ferramentas de colaboração em equipa e análise de hashtags. |
| Tipo de planoPlano empresarial de grande dimensão | Preço médio$100-$300+/mês | Funcionalidades comunsIntegrações personalizadas, suporte dedicado, comparação com a concorrência, contas ilimitadas e acesso à API. |
Perguntas frequentes sobre a ferramenta de relatórios do Instagram
Eis algumas respostas a perguntas frequentes sobre a ferramenta de relatórios do Instagram:
A ferramenta de relatórios do Instagram pode acompanhar as Histórias e os Reels do Instagram?
Sim, a maioria das ferramentas de relatórios do Instagram acompanha as métricas de desempenho das Histórias e dos Reels, incluindo visualizações, respostas e interação. No entanto, a profundidade das análises pode variar consoante a ferramenta, por isso, verifique se a solução que prefere abrange as métricas específicas de que necessita.
A ferramenta de relatórios do Instagram requer acesso de administrador à minha conta do Instagram?
Sim, a maioria das ferramentas requer acesso de administrador ou acesso autorizado à sua conta do Instagram para recolher dados. Isto é necessário para obter análises diretamente da API do Instagram e garantir relatórios precisos e atualizados.
Com que frequência são atualizados os dados na ferramenta de relatórios do Instagram?
A frequência de atualização dos dados depende da ferramenta, mas a maioria atualiza as métricas em tempo real ou, pelo menos, diariamente. Algumas ferramentas oferecem notificações instantâneas relativamente a alterações significativas, enquanto outras atualizam os dados de acordo com um calendário definido.
Posso exportar relatórios da ferramenta de relatórios do Instagram?
Sim, quase todas as ferramentas de relatórios do Instagram permitem exportar relatórios em formatos como PDF ou CSV. Isto facilita a partilha de informações com as partes interessadas ou o arquivo de dados de desempenho para consulta futura.
Existe alguma ferramenta de relatórios do Instagram que suporte várias contas?
Sim, muitas ferramentas de relatórios do Instagram suportam a gestão de várias contas, permitindo acompanhar as análises de vários perfis do Instagram a partir de um único painel. Isto é especialmente útil para agências ou equipas que gerem várias marcas.