

Whatagraph-review: Voordelen, nadelen, functies en prijzen
Whatagraph onderscheidt zich door moeiteloze rapportage over meerdere kanalen, maar als je behoefte hebt aan uitgebreide aanpassingsmogelijkheden of geavanceerde analyses, wil je misschien twee keer nadenken voordat je eraan begint.

We review tools independently, and commissions help fund our testing. See our transparency policy, our methodology, or suggest a tool.
Whatagraph is a marketing intelligence software built for marketing teams and agencies that need to consolidate cross-channel data into a single reporting layer. It's worth a close look if you're outgrowing tools like Looker Studio—Whatagraph comes with pre-built channel connectors and client-ready report templates, so you're not spending hours on manual data wiring just to get a dashboard that works.
Whatagraph Evaluation Summary
4.5/5
- From $812/month (billed annually)
- Free demo available
Waarom u onze softwareaanbevelingen kunt vertrouwen
6,700+
Reviews
20
Industry experts
16+
Evaluation factors
14
Years
Ons team test en beoordeelt software sinds 2012. Als marketingleiders weten we zelf hoe moeilijk — en belangrijk — het is om de juiste software te kiezen.
Voor deze gids hebben we tools geëvalueerd met behulp van praktijktests en onafhankelijk onderzoek, waarbij we tools beoordeelden aan de hand van onze selectiecriteria.
Onze reviews weerspiegelen ons menselijke redactionele oordeel, geen verkooppraatje.
Deskundige beoordelaars:
 Gui DrusinaCreatief directeur
- Shriya GhateSenior Marketing Lead
 Amanda JacquesMarketing Ops Leader

Whatagraph Overview
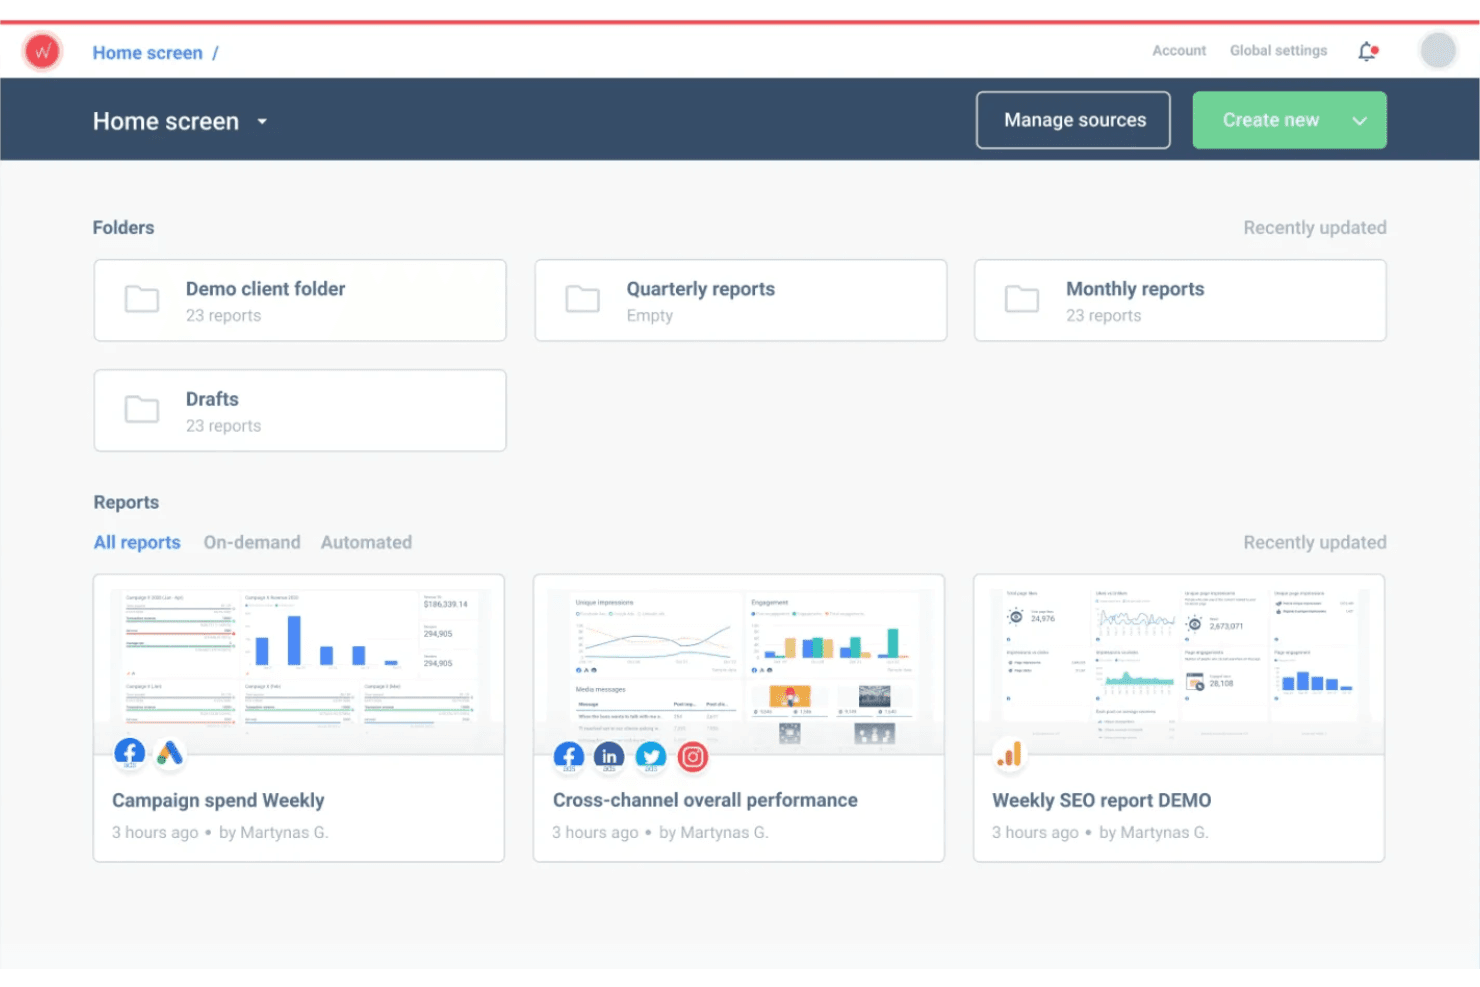
If you’re judging Whatagraph against other marketing intelligence platforms, I think its intuitive interface and quick onboarding set it apart. The drag-and-drop report builder and wide range of integrations make it easy to pull data from multiple sources. Pricing is mid-tier, but you get strong support and automation features.
It’s not the best fit if you need deep data modeling or custom metrics, but for agencies or teams who want fast, visual reporting without a steep learning curve, Whatagraph is a smart pick. I’d suggest it for marketing teams managing multiple client accounts or channels.
Pros
- Customer support is responsive and knowledgeable
- Visual report builder supports fast client-ready dashboards
- Automated cross-channel reporting saves significant time
Cons
- Pricing is higher than some similar reporting tools
- Filtering and segmentation features can feel restrictive
- Limited options for advanced data modeling and calculations
Is Whatagraph Right For Your Needs?
Who Would be a Good Fit for Whatagraph?
Whatagraph is a strong choice for teams that need to automate multi-channel marketing reports and share visual dashboards with clients or stakeholders. Agencies, digital marketing teams, and departments managing multiple brands or campaigns will get the most value from its automated reporting, pre-built templates, and easy data visualization. If your work involves frequent client communication or you need to quickly turn complex data into clear, shareable insights, Whatagraph’s features are going to save you time and keep your reporting consistent.
- Small to Mid-Sized CompaniesUser-friendly setup and automation reduce manual reporting work.
- Social Media ManagersPre-built templates speed up social and ad performance reporting.
- Franchise BusinessesRoll-up reporting makes it easy to compare multiple locations.
- E-commerce BrandsMulti-channel data connectors support tracking sales and ad spend.
- In-House Marketing TeamsCentralized reporting across channels helps teams track campaign performance.
- Marketing AgenciesAutomated client reporting and white-label dashboards simplify agency workflows.
Who Would be a Bad Fit for Whatagraph?
Whatagraph isn’t ideal for organizations that need highly customized analytics, deep data modeling, or advanced segmentation. If your team relies on granular data manipulation, complex calculations, or needs to integrate with niche data sources, you’ll likely find Whatagraph’s feature set limiting. Large enterprises with strict data governance or companies needing real-time analytics may also want to look elsewhere for a more specialized solution.
- IT DepartmentsNo support for technical monitoring or infrastructure data sources.
- B2B SaaS CompaniesAccount-based reporting and segmentation options are basic.
- Healthcare OrganizationsLimited compliance features for sensitive or regulated data.
- Financial ServicesDoes not offer granular, real-time financial data integrations.
- Data Science TeamsLacks support for complex calculations and predictive modeling.
- Large EnterprisesAdvanced analytics and custom data modeling are limited.
How We Test & Score Tools
We’ve spent years building, refining, and improving our software testing and scoring system. The rubric is designed to capture the nuances of software selection and what makes a tool effective, focusing on critical aspects of the decision-making process.
Below, you can see exactly how our testing and scoring works across seven criteria. It allows us to provide an unbiased evaluation of the software based on core functionality, standout features, ease of use, onboarding, customer support, integrations, customer reviews, and value for money.
Core Functionality (25% of final scoring)
The starting point of our evaluation is always the core functionality of the tool. Does it have the basic features and functions that a user would expect to see? Are any of those core features locked to higher-tiered pricing plans? At its core, we expect a tool to stand up against the baseline capabilities of its competitors.
Standout Features (25% of final scoring)
Next, we evaluate uncommon standout features that go above and beyond the core functionality typically found in tools of its kind. A high score reflects specialized or unique features that make the product faster, more efficient, or offer additional value to the user.
We also evaluate how easy it is to integrate with other tools typically found in the tech stack to expand the functionality and utility of the software. Tools offering plentiful native integrations, 3rd party connections, and API access to build custom integrations score best.
Ease of Use (10% of final scoring)
We consider how quick and easy it is to execute the tasks defined in the core functionality using the tool. High scoring software is well designed, intuitive to use, offers mobile apps, provides templates, and makes relatively complex tasks seem simple.
Onboarding (10% of final scoring)
We know how important rapid team adoption is for a new platform, so we evaluate how easy it is to learn and use a tool with minimal training. We evaluate how quickly a team member can get set up and start using the tool with no experience. High scoring solutions indicate little or no support is required.
Customer Support (10% of final scoring)
We review how quick and easy it is to get unstuck and find help by phone, live chat, or knowledge base. Tools and companies that provide real-time support score best, while chatbots score worst.
Customer Reviews (10% of final scoring)
Beyond our own testing and evaluation, we consider the net promoter score from current and past customers. We review their likelihood, given the option, to choose the tool again for the core functionality. A high scoring software reflects a high net promoter score from current or past customers.
Value for Money (10% of final scoring)
Lastly, in consideration of all the other criteria, we review the average price of entry level plans against the core features and consider the value of the other evaluation criteria. Software that delivers more, for less, will score higher.
Core Features
Automated Report Generation
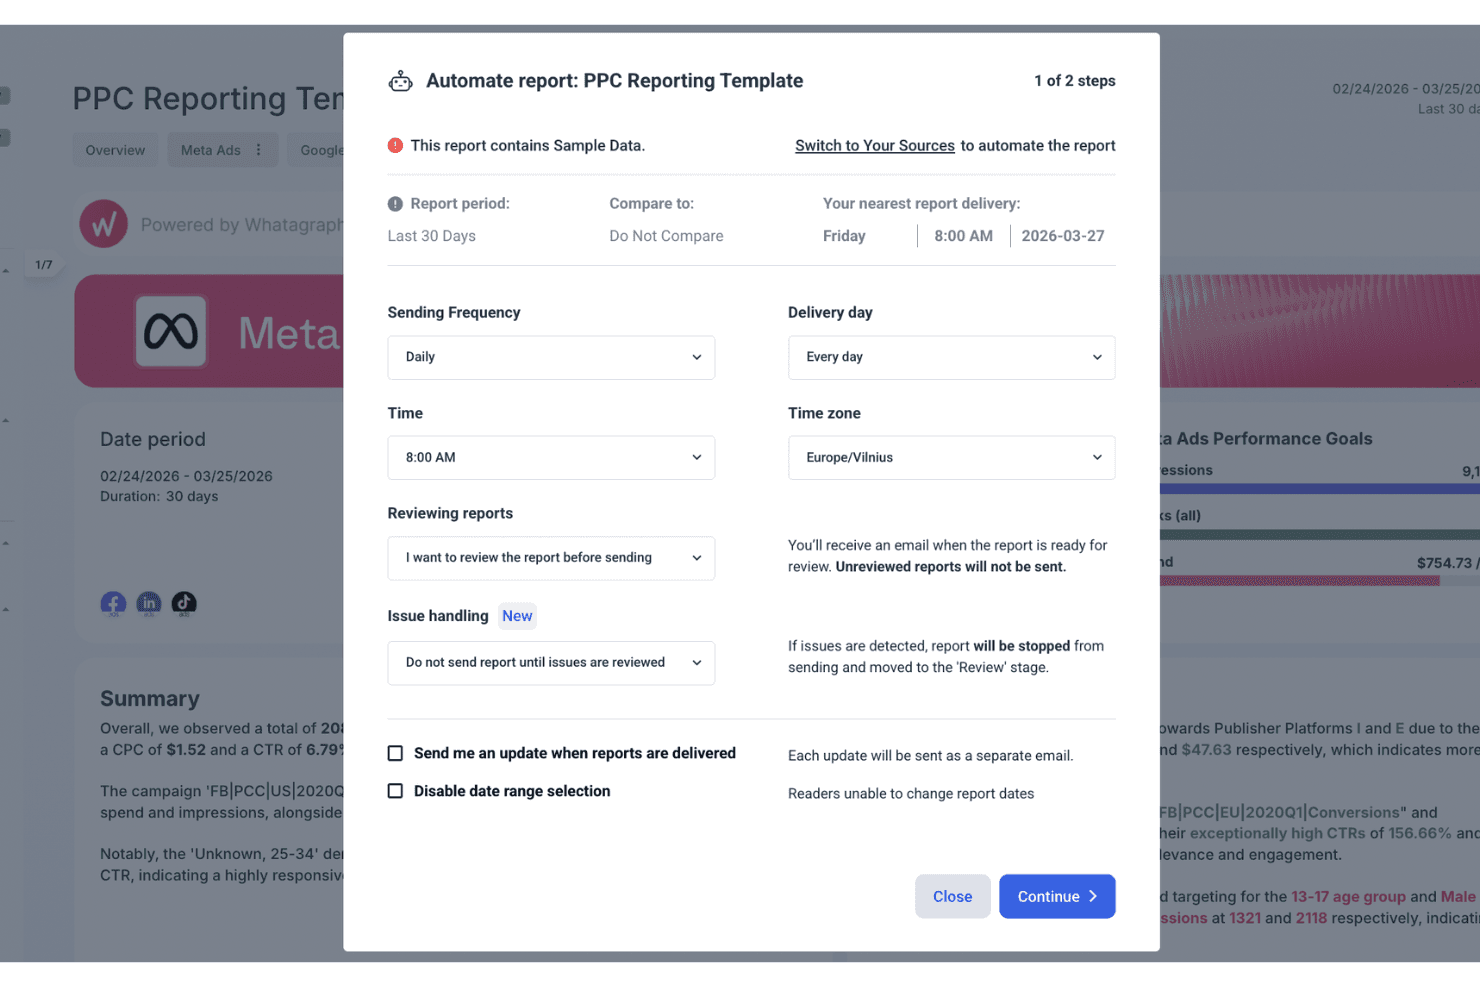
Create and schedule marketing reports that update with the latest data, saving hours on manual work.
AI-Powered Insights
Get instant summaries and actionable insights from your marketing data using built-in AI tools.
Drag-and-Drop Report Builder
Build custom dashboards and reports visually, with no coding or technical skills required.
White-Label Reporting
Brand your reports with custom logos and colors for client-ready presentations.
Multi-Channel Data Aggregation
Combine data from all your marketing channels into a single, unified dashboard.
Pre-Built Templates
Start reporting quickly with templates designed for common marketing use cases like social, PPC, and web analytics.
Ease of Use
Whatagraph is one of the most approachable marketing intelligence platforms for non-technical users. The drag-and-drop builder, clear navigation, and pre-built templates make setup fast, even for first-timers.
Users often mention how quickly they can create and share reports without needing help from IT or data specialists. I think the intuitive interface and guided onboarding really lower the barrier for busy marketing teams who want actionable insights without a steep learning curve.

Integrations
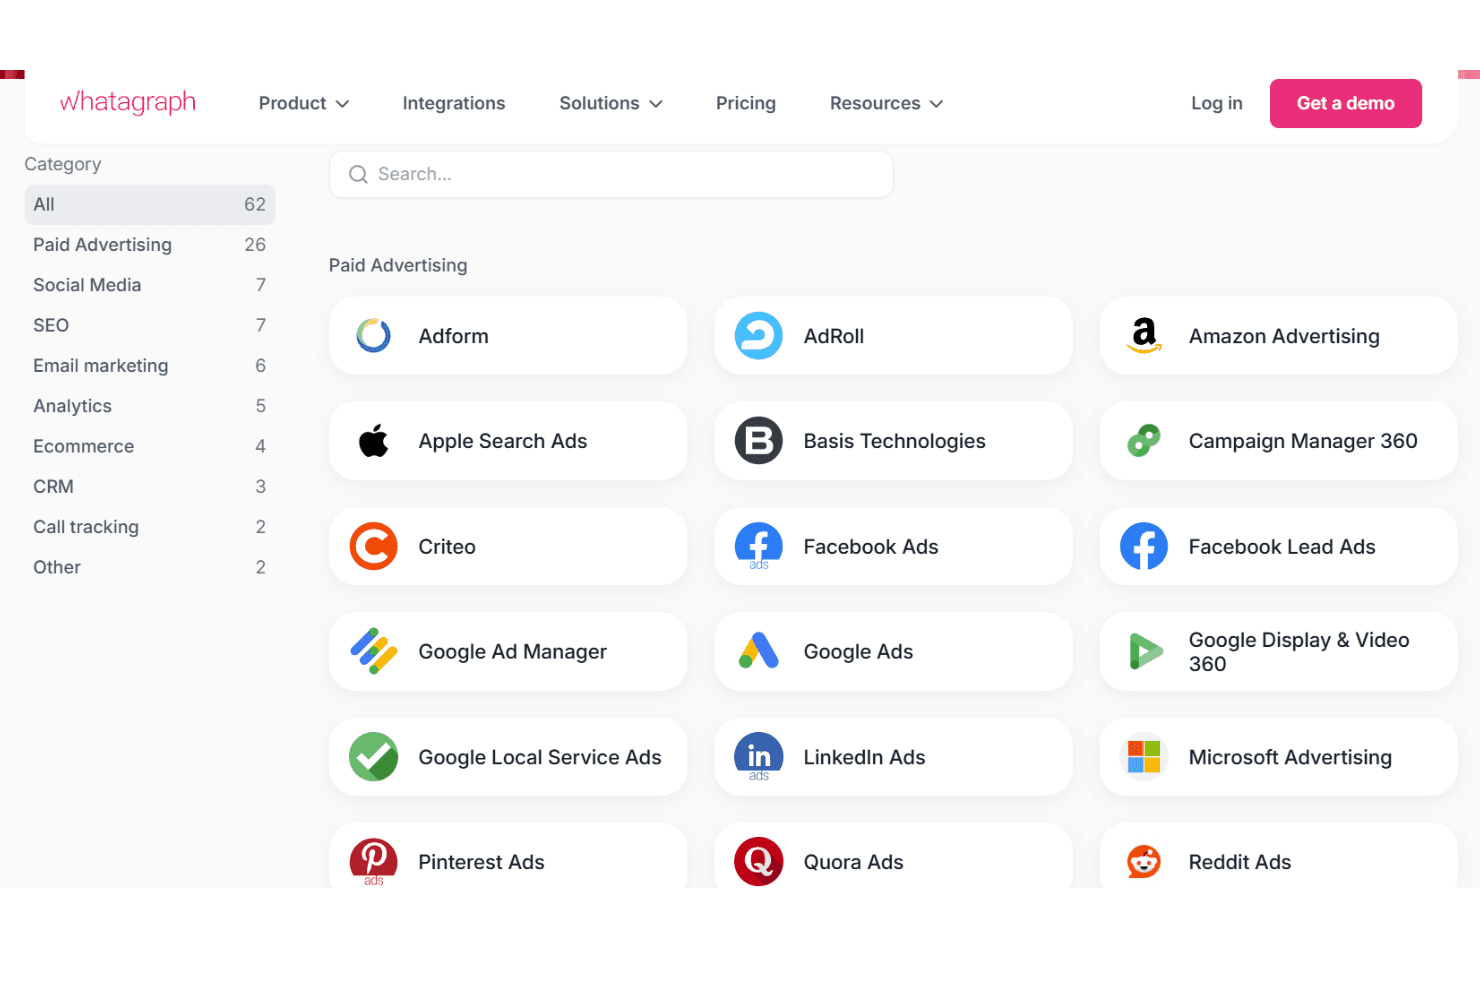
Whatagraph integrates with Google Analytics 4, Facebook Ads, Instagram, LinkedIn Ads, Shopify, HubSpot, Mailchimp, Google Ads, TikTok Ads, and Salesforce, among others.
Whatagraph also offers a custom API and connects with Google Sheets and BigQuery for additional data sources.
Whatagraph Specs
- API: No
- Audience Targeting: Yes
- Brand Management: No
- Conversion Tracking: Yes
- Data Export: Yes
- Data Import: Yes
- External Integrations: Yes
- Keyword Tracking: Yes
- Lead Management: Yes
- Lead Scoring: Yes
- Link Tracking: Yes
- Marketing Automation: Yes
- Multi-User: Yes
- Net Promoter Score: No
- Notifications: Yes
- Social-Media Integration: Yes


