

Avis Whatagraph 2026 : Avantages, Inconvénients, Fonctionnalités et Tarifs
Whatagraph se distingue par la simplicité de ses rapports multicanaux, facilitant la création de rapports marketing clairs et prêts pour les clients sur différentes plateformes.

Nous évaluons les outils de manière indépendante, et les commissions aident à financer nos tests. Consultez notre politique de transparence, notre méthodologie ou suggérez un outil.
Whatagraph is a marketing intelligence software built for marketing teams and agencies that need to consolidate cross-channel data into a single reporting layer. It's worth a close look if you're outgrowing tools like Looker Studio—Whatagraph comes with pre-built channel connectors and client-ready report templates, so you're not spending hours on manual data wiring just to get a dashboard that works.
Whatagraph Evaluation Summary
4.5/5
- From $812/month (billed annually)
- Free demo available
Pourquoi faire confiance à nos recommandations de logiciels
6,700+
Reviews
20
Industry experts
16+
Evaluation factors
14
Years
Notre équipe teste et évalue des logiciels depuis 2012. En tant que leaders marketing nous-mêmes, nous savons à quel point il est difficile — et important — de choisir le bon logiciel.
Pour ce guide, nous avons évalué les outils grâce à des tests pratiques et une recherche indépendante, en notant les outils selon nos critères de sélection.
Nos avis reflètent notre jugement éditorial humain, et non un argumentaire de vente.
Réviseurs experts:
 Gui DrusinaDirecteur de la création
- Shriya GhateSenior Marketing Lead
 Amanda JacquesResponsable Marketing Ops

Whatagraph Overview
If you’re judging Whatagraph against other marketing intelligence platforms, I think its intuitive interface and quick onboarding set it apart. The drag-and-drop report builder and wide range of integrations make it easy to pull data from multiple sources. Pricing is mid-tier, but you get strong support and automation features.
It’s not the best fit if you need deep data modeling or custom metrics, but for agencies or teams who want fast, visual reporting without a steep learning curve, Whatagraph is a smart pick. I’d suggest it for marketing teams managing multiple client accounts or channels.
Pros
- Customer support is responsive and knowledgeable
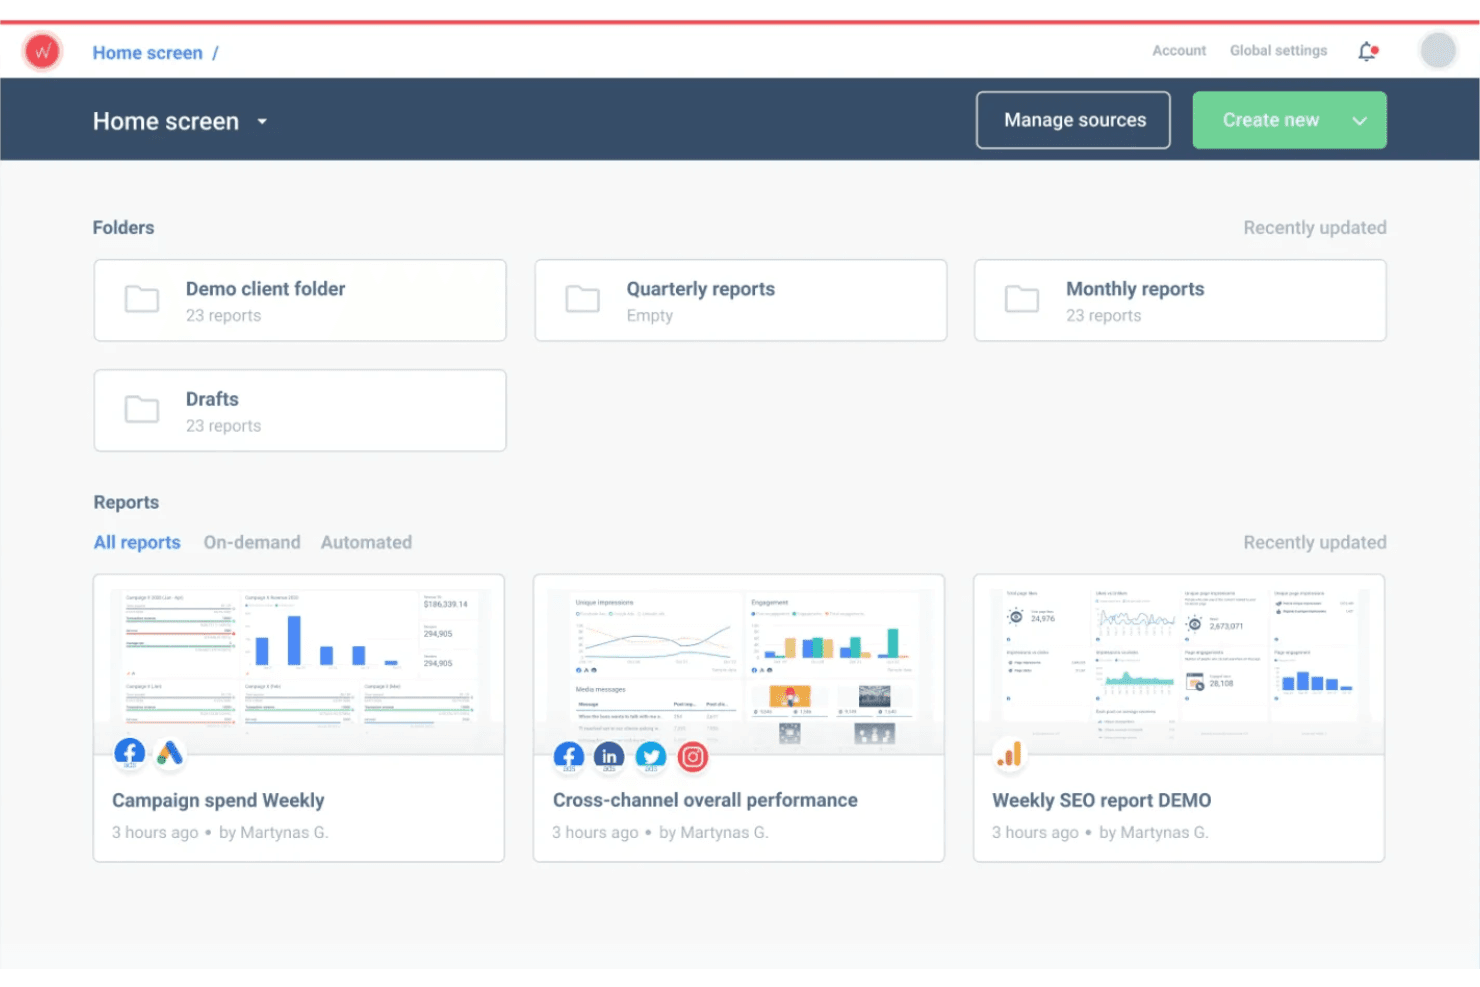
- Visual report builder supports fast client-ready dashboards
- Automated cross-channel reporting saves significant time
Cons
- Pricing is higher than some similar reporting tools
- Filtering and segmentation features can feel restrictive
- Limited options for advanced data modeling and calculations
Is Whatagraph Right For Your Needs?
Who Would be a Good Fit for Whatagraph?
Whatagraph is a strong choice for teams that need to automate multi-channel marketing reports and share visual dashboards with clients or stakeholders. Agencies, digital marketing teams, and departments managing multiple brands or campaigns will get the most value from its automated reporting, pre-built templates, and easy data visualization. If your work involves frequent client communication or you need to quickly turn complex data into clear, shareable insights, Whatagraph’s features are going to save you time and keep your reporting consistent.
- Small to Mid-Sized CompaniesUser-friendly setup and automation reduce manual reporting work.
- Social Media ManagersPre-built templates speed up social and ad performance reporting.
- Franchise BusinessesRoll-up reporting makes it easy to compare multiple locations.
- E-commerce BrandsMulti-channel data connectors support tracking sales and ad spend.
- In-House Marketing TeamsCentralized reporting across channels helps teams track campaign performance.
- Marketing AgenciesAutomated client reporting and white-label dashboards simplify agency workflows.
Who Would be a Bad Fit for Whatagraph?
Whatagraph isn’t ideal for organizations that need highly customized analytics, deep data modeling, or advanced segmentation. If your team relies on granular data manipulation, complex calculations, or needs to integrate with niche data sources, you’ll likely find Whatagraph’s feature set limiting. Large enterprises with strict data governance or companies needing real-time analytics may also want to look elsewhere for a more specialized solution.
- IT DepartmentsNo support for technical monitoring or infrastructure data sources.
- B2B SaaS CompaniesAccount-based reporting and segmentation options are basic.
- Healthcare OrganizationsLimited compliance features for sensitive or regulated data.
- Financial ServicesDoes not offer granular, real-time financial data integrations.
- Data Science TeamsLacks support for complex calculations and predictive modeling.
- Large EnterprisesAdvanced analytics and custom data modeling are limited.
Comment nous testons et évaluons les outils
Nous avons passé des années à construire, affiner et améliorer notre système de test et de notation des logiciels. Notre grille d’évaluation est conçue pour prendre en compte toutes les nuances du choix logiciel et ce qui rend un outil efficace, en mettant l’accent sur les aspects critiques du processus de décision. Ci-dessous, vous pouvez découvrir précisément comment nos tests et notations fonctionnent selon sept critères. Cela nous permet d’offrir une évaluation impartiale des logiciels en fonction de la fonctionnalité principale, des fonctionnalités différenciantes, de la facilité d’utilisation, de l’onboarding, du support client, des intégrations, des avis clients et du rapport qualité-prix.
Fonctionnalité principale (25% de la note finale)
Le point de départ de notre évaluation est toujours la fonctionnalité principale de l’outil. Dispose-t-il des fonctions de base attendues ? Certaines de ces fonctionnalités sont-elles bloquées dans des offres tarifaires supérieures ? Nous attendons d’un outil qu’il soit à la hauteur des capacités fondamentales de ses concurrents.
Fonctionnalités différenciantes (25% de la note finale)
Ensuite, nous évaluons les fonctionnalités spéciales qui vont au-delà de ce que l’on trouve habituellement chez ce type d’outils. Un score élevé indique des fonctionnalités uniques ou spécialisées qui rendent le produit plus rapide, plus efficace, ou offrent une valeur ajoutée à l’utilisateur. Nous évaluons également la facilité d’intégration avec d’autres outils couramment utilisés pour élargir les possibilités et l’utilité du logiciel. Les outils offrant de nombreuses intégrations natives, des connexions tierces et un accès API pour bâtir des intégrations personnalisées obtiennent les meilleures notes.
Facilité d’utilisation (10% de la note finale)
Nous considérons la rapidité et la facilité d’exécution des tâches principales via l’outil. Les logiciels les mieux notés sont bien conçus, intuitifs à utiliser, proposent des applications mobiles, des modèles prêts à l’emploi, et simplifient des tâches parfois complexes.
Onboarding (10% de la note finale)
Nous savons combien l’adoption rapide par l’équipe est cruciale pour une nouvelle plateforme. Nous évaluons donc la facilité avec laquelle il est possible d’apprendre et d’utiliser un outil sans formation poussée. On mesure aussi la vitesse à laquelle un membre de l’équipe peut être opérationnel, sans expérience préalable. Les solutions bien notées requièrent peu ou pas d’assistance.
Support client (10% de la note finale)
Nous examinons la rapidité et la facilité avec lesquelles on peut obtenir de l’aide par téléphone, chat en direct ou base de connaissances. Les outils et sociétés offrant un support en temps réel sont favorisés ; les chatbots sont pénalisés.
Avis clients (10% de la note finale)
Au-delà de nos propres tests et évaluations, nous prenons en compte le score de recommandation nette des clients actuels et passés. Nous étudions leur propension, si l’occasion se présente, à réutiliser l’outil pour sa fonctionnalité principale. Un score élevé reflète donc un bon taux de recommandation.
Rapport qualité-prix (10% de la note finale)
Enfin, après avoir pris en compte tous les autres critères, nous confrontons le prix moyen des offres de base aux fonctionnalités principales et prenons en compte la valeur apportée par les autres éléments d’évaluation. Les logiciels qui offrent plus pour moins obtiennent une note supérieure.
Core Features
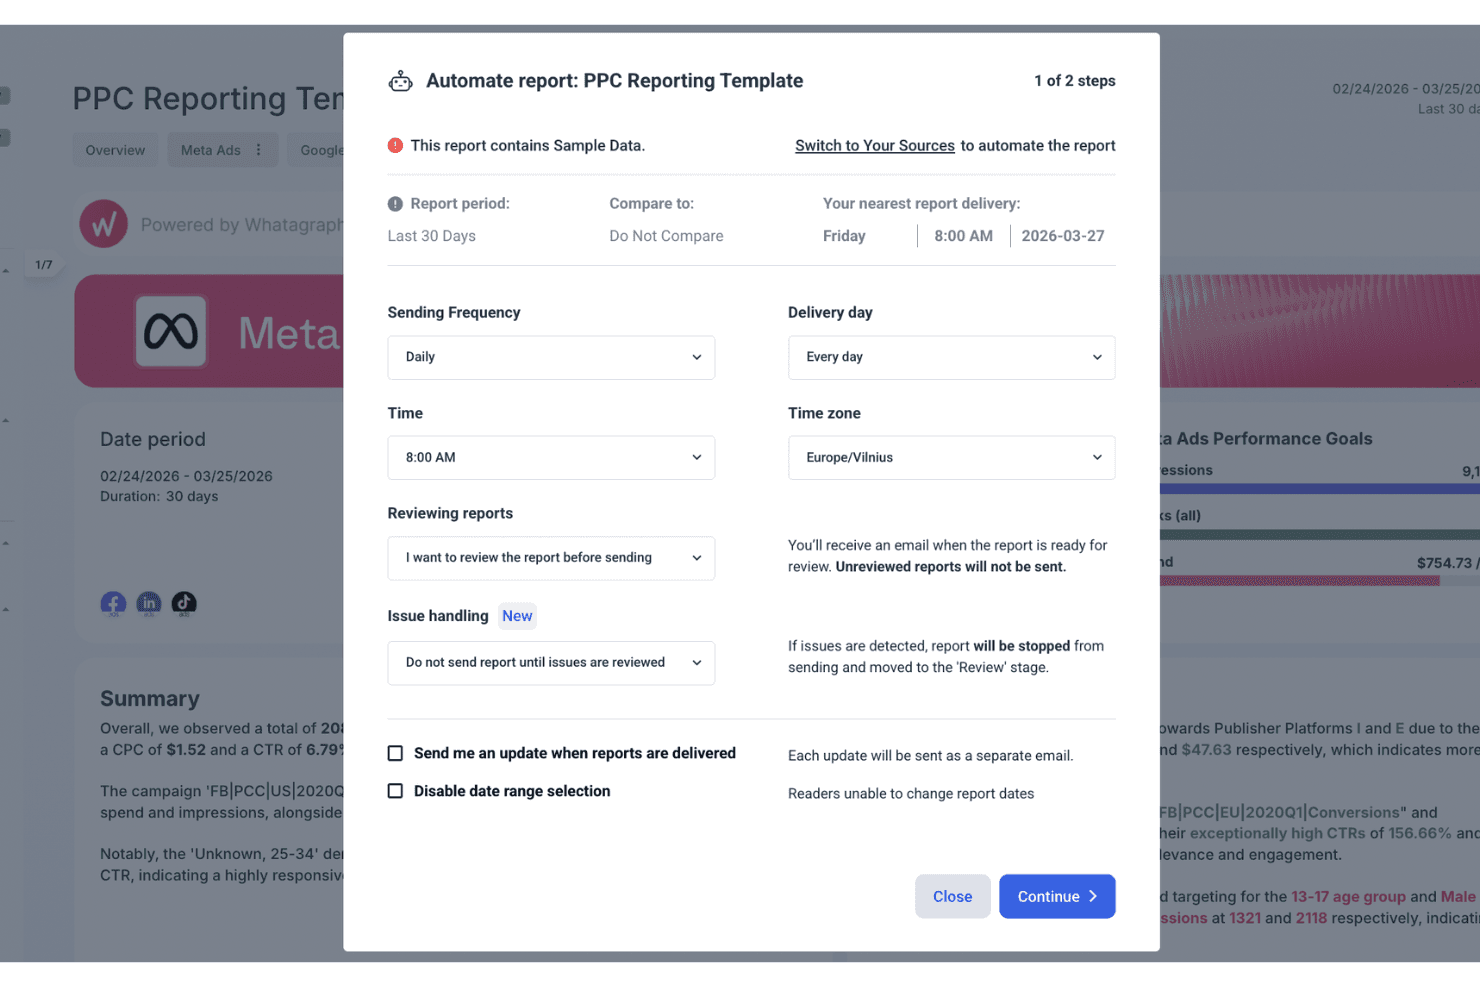
Automated Report Generation
Create and schedule marketing reports that update with the latest data, saving hours on manual work.
AI-Powered Insights
Get instant summaries and actionable insights from your marketing data using built-in AI tools.
Drag-and-Drop Report Builder
Build custom dashboards and reports visually, with no coding or technical skills required.
White-Label Reporting
Brand your reports with custom logos and colors for client-ready presentations.
Multi-Channel Data Aggregation
Combine data from all your marketing channels into a single, unified dashboard.
Pre-Built Templates
Start reporting quickly with templates designed for common marketing use cases like social, PPC, and web analytics.
Ease of Use
Whatagraph is one of the most approachable marketing intelligence platforms for non-technical users. The drag-and-drop builder, clear navigation, and pre-built templates make setup fast, even for first-timers.
Users often mention how quickly they can create and share reports without needing help from IT or data specialists. I think the intuitive interface and guided onboarding really lower the barrier for busy marketing teams who want actionable insights without a steep learning curve.

Integrations
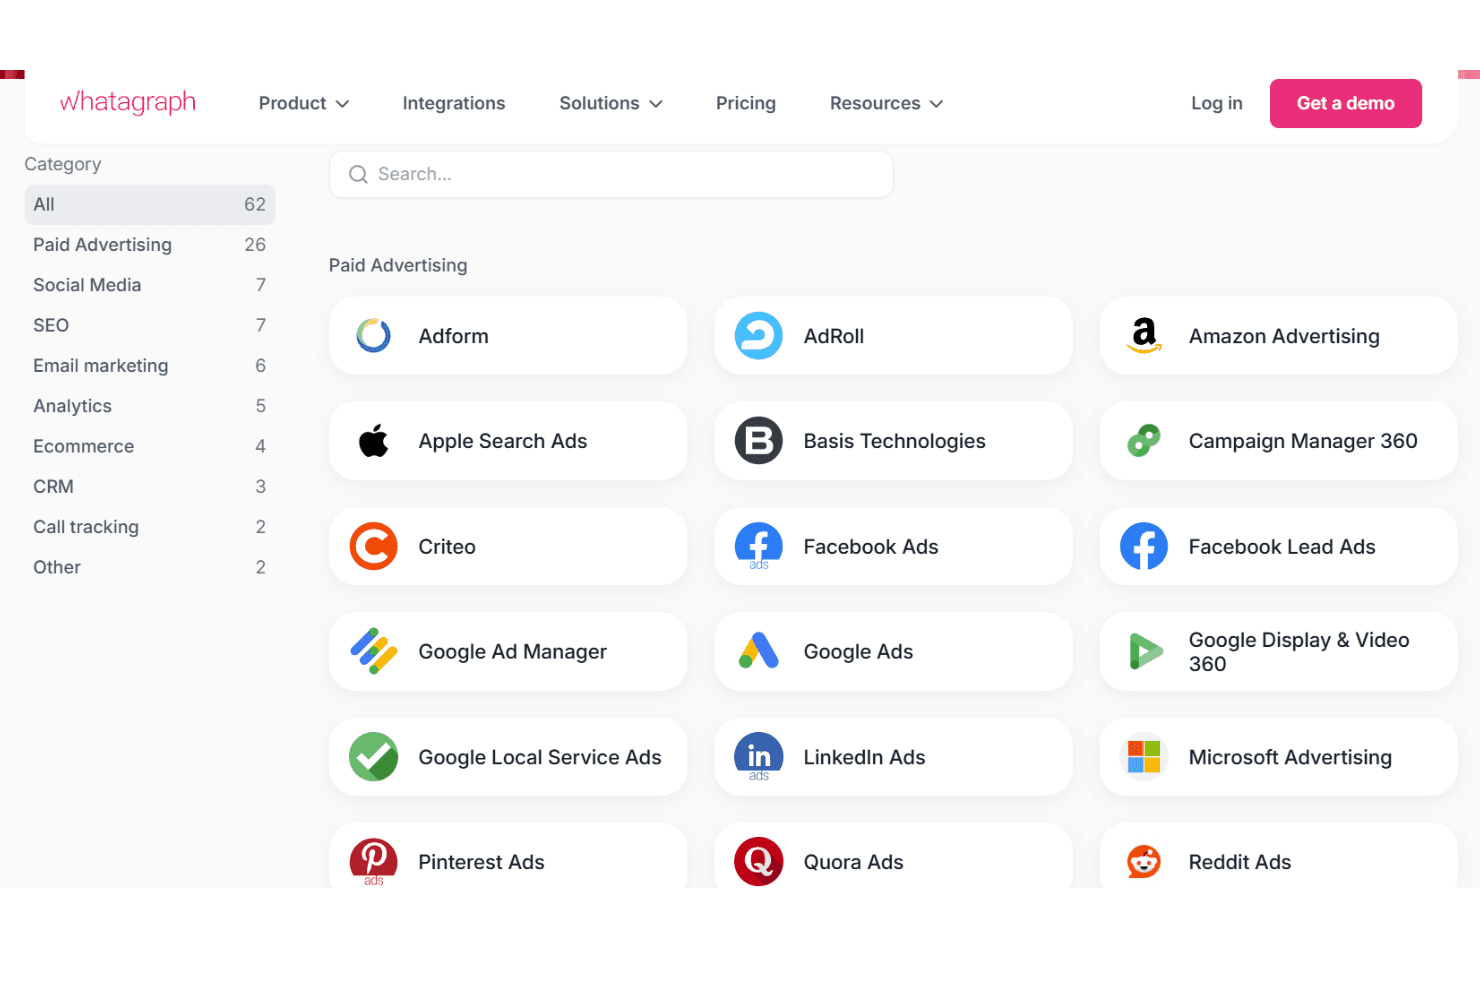
Whatagraph integrates with Google Analytics 4, Facebook Ads, Instagram, LinkedIn Ads, Shopify, HubSpot, Mailchimp, Google Ads, TikTok Ads, and Salesforce, among others.
Whatagraph also offers a custom API and connects with Google Sheets and BigQuery for additional data sources.
Whatagraph Specs
- API: No
- Audience Targeting: Yes
- Brand Management: No
- Conversion Tracking: Yes
- Data Export: Yes
- Data Import: Yes
- External Integrations: Yes
- Keyword Tracking: Yes
- Lead Management: Yes
- Lead Scoring: Yes
- Link Tracking: Yes
- Marketing Automation: Yes
- Multi-User: Yes
- Net Promoter Score: No
- Notifications: Yes
- Social-Media Integration: Yes


