

Una herramienta de informes de Instagram es una herramienta de análisis que recopila, analiza y visualiza datos de tus cuentas de redes sociales para ayudarte a realizar un seguimiento del rendimiento y medir los resultados. Si buscas la mejor herramienta de informes de Instagram, probablemente necesites demostrar el ROI, supervisar el impacto de las campañas y compartir informes mensuales con tu equipo o tus clientes. Muchas plataformas ofrecen paneles todo en uno con funciones basadas en IA que muestran las métricas clave y proporcionan información práctica para mejorar tus esfuerzos de marketing. Con funciones como la generación automatizada de informes y las plantillas personalizables, estas herramientas te ayudan a agilizar el análisis y la toma de decisiones. Esta guía desglosa las principales herramientas de informes de Instagram para 2026, para que puedas comparar sus funciones, entender qué diferencia a cada una y elegir la solución adecuada para impulsar tu estrategia de marketing.
Por qué confiar en nuestras recomendaciones de software
6,700+
Reviews
20
Industry experts
16+
Evaluation factors
14
Years
Nuestro equipo lleva probando y evaluando software desde 2012. Como líderes de marketing, sabemos lo difícil —y lo importante— que es elegir el software adecuado.
Para esta guía, evaluamos las herramientas mediante pruebas prácticas e investigación independiente, puntuando las herramientas según nuestros criterios de selección.
Nuestras reseñas reflejan nuestro criterio editorial humano, no un discurso de ventas.
Revisores expertos:
 Gui DrusinaDirector creativo
- Shriya GhateSenior Marketing Lead
 Amanda JacquesLíder de Marketing Ops

Tabla comparativa de herramientas de informes de Instagram
La tabla siguiente compara los detalles de precios de mi selección de las principales herramientas de informes de Instagram.
| Tool | Best For | Trial Info | Price | ||
|---|---|---|---|---|---|
| 1 | Mejor con análisis de sentimiento multilingüe | Prueba gratuita de 14 días | Desde $199/mes (facturado anualmente) | Website | |
| 2 | Mejor para plantillas de informes listas para el cliente | Prueba gratuita de 14 días + demo gratis | Desde $20/cliente/mes (facturado anualmente) | Website | |
| 3 | Ideal para la comparación competitiva en redes sociales | Prueba gratuita de 14 días + demo gratuita | Desde $199/mes (facturación anual) | Website | |
| 4 | Ideal para analíticas unificadas entre redes | Plan gratuito disponible | Desde $20/mes | Website | |
| 5 | Mejor para la agregación de datos multiplataforma | Plan gratuito disponible | Desde $229/mes (facturado anualmente) | Website | |
| 6 | Ideal para integraciones avanzadas de flujos de datos | Demo gratuita disponible | Precio a consultar | Website | |
| 7 | Mejor para análisis profundos de rendimiento visual | Prueba gratuita de 14 días y plan gratuito disponible | Desde $33/mes (facturación anual) | Website | |
| 8 | Ideal para seguimiento de KPIs en tiempo real | Plan gratuito + prueba gratuita + demostración gratuita disponible | Desde $64/mes (facturado anualmente) | Website | |
| 9 | Mejor para paneles personalizables de marca blanca | Prueba gratuita de 14 días disponible | Desde $20/mes | Website | |
| 10 | Ideal para la programación automatizada de informes multicanal | Prueba gratuita de 14 días + plan gratis disponible | Desde $12.5/cuenta/mes (facturación anual) | Website |


Reseñas de herramientas de informes de Instagram
A continuación encontrarás mis resúmenes detallados de las herramientas de informes de Instagram que llegaron a mi lista. Mis reseñas ofrecen un análisis detallado de las funciones, integraciones y casos de uso más adecuados de cada plataforma para ayudarte a encontrar la mejor opción para ti.
 Mejor con análisis de sentimiento multilingüe
- Prueba gratuita de 14 días
- Desde $199/mes (facturado anualmente)
Visit WebsiteCustomer Rating:4.7/5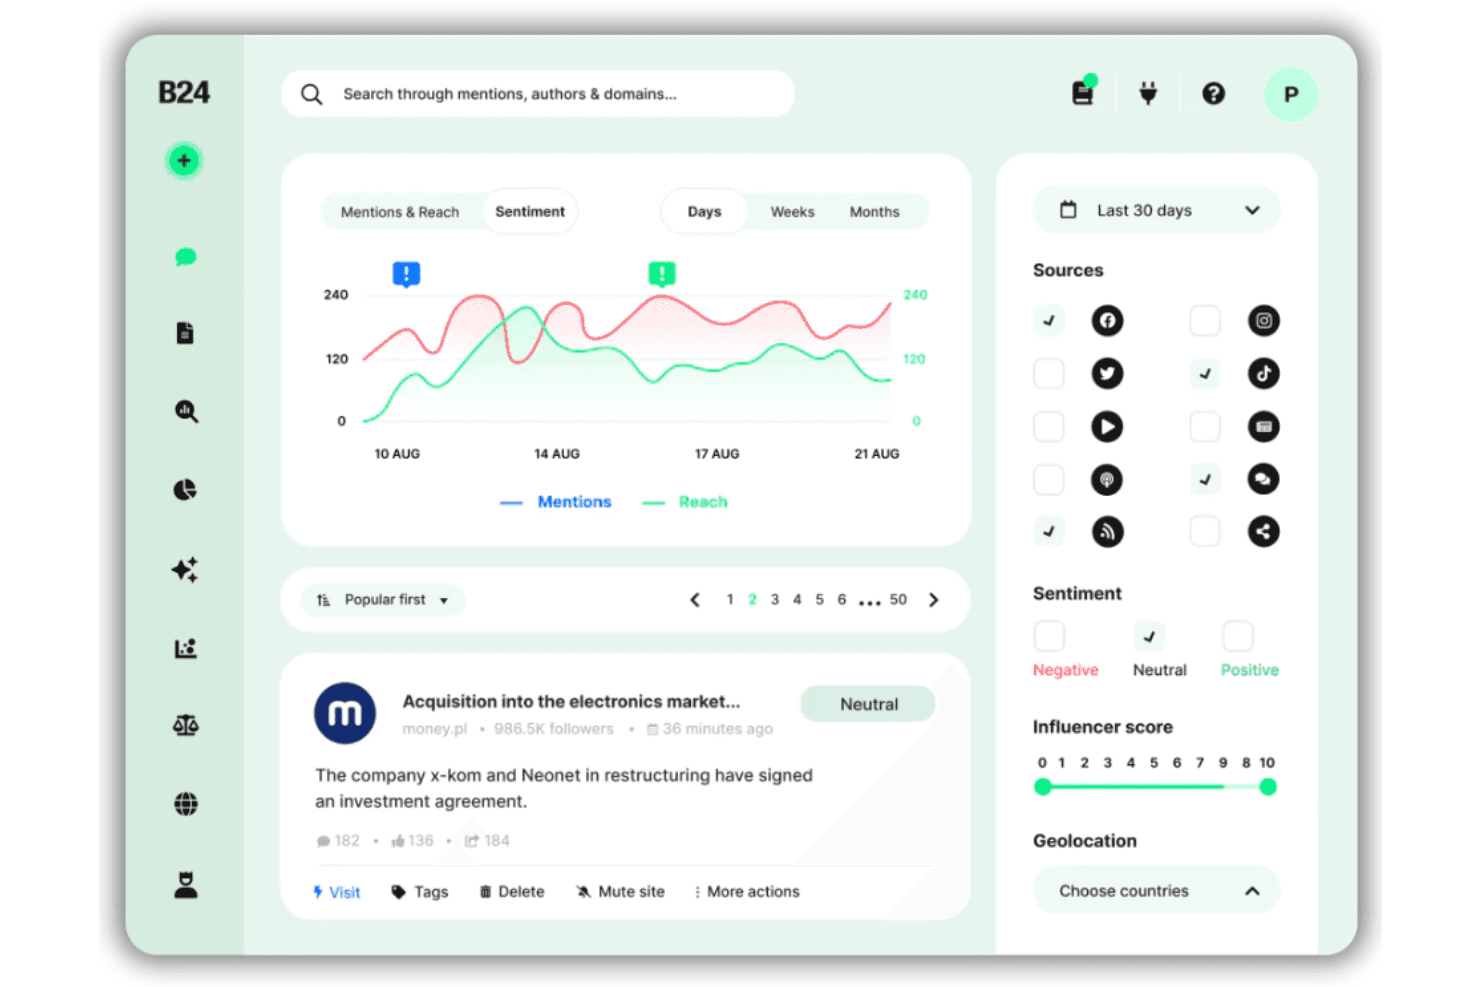
Brand24 ofrece un panel de análisis de sentimiento con seguimiento de menciones, métricas de alcance, filtrado por fuente y puntuación de influencers en plataformas de redes sociales. Brand24 es una plataforma de escucha social impulsada por IA que rastrea menciones en Instagram, rendimiento de hashtags, sentimiento y cuota de voz de competidores en más de 25 millones de fuentes en línea en tiempo real.
¿Para Quién Es Mejor Brand24?
Brand24 es ideal para equipos de marketing y relaciones públicas de marcas globales o agencias que necesitan seguir el sentimiento y las menciones en Instagram a través de múltiples idiomas y regiones.
Por Qué Elegí Brand24
Brand24 merece su lugar como uno de los mejores en mi lista porque su análisis de sentimiento abarca 108 idiomas, lo cual es poco común entre las herramientas de reporte de Instagram. Me encanta cómo la Detección de Eventos por IA señala automáticamente picos en menciones de marca, así puedo identificar el momento exacto en Instagram que cambió el sentimiento de la audiencia. Luego, la función de Insights de IA convierte esos datos multilingües en un informe listo para compartir sin necesidad de interpretación manual.
Características Clave de Brand24
- Enlaces de informes QuickShare: Genera enlaces de informes instantáneos y compartibles con rangos de fechas ajustables para clientes o compañeros.
- Seguimiento de hashtags: Monitorea el alcance, el volumen y la actividad de cualquier hashtag de Instagram en tiempo real.
- Benchmarking de menciones de competidores: Compara cuota de voz y sentimiento frente a marcas competidoras en Instagram y otros canales.
- Cobertura de fuentes multiplataforma: Recopila y analiza menciones de marca de Instagram, TikTok, Facebook, YouTube, Reddit y más en un solo panel.
Integraciones de Brand24
Brand24 ofrece integraciones nativas con Slack y Microsoft Teams. Hay una API disponible para integraciones personalizadas.
Pros and Cons
Pros:
- El análisis de sentimiento abarca 108 idiomas
- La IA detecta automáticamente picos repentinos de menciones
- Seguimiento en tiempo real de la cuota de voz de competidores
Cons:
- Las métricas de Stories y Reels no están totalmente soportadas
- Los límites de menciones restringen los flujos de trabajo de grandes agencias
Learn more about Brand24: Mejor para plantillas de informes listas para el cliente
- Prueba gratuita de 14 días + demo gratis
- Desde $20/cliente/mes (facturado anualmente)
Visit WebsiteCustomer Rating:4.7/5
AgencyAnalytics estructura los datos de desempeño de la agencia. Si gestionas análisis de Instagram para varios clientes, AgencyAnalytics te ofrece una forma de centralizar y automatizar tus informes. La plataforma está diseñada para agencias y equipos de marketing que necesitan entregar reportes de Instagram profesionales, llenos de datos, sin esfuerzo manual. Con su enfoque en plantillas listas para usar y paneles visuales, te ayuda a presentar el rendimiento de Instagram en un formato que los clientes pueden entender rápidamente.
¿Para quién es mejor AgencyAnalytics?
AgencyAnalytics es una opción sólida para agencias de marketing y consultores que necesitan entregar informes profesionales de análisis de Instagram a sus clientes.
Por qué elegí AgencyAnalytics
Lo que hace que AgencyAnalytics destaque para informes de Instagram es su biblioteca de plantillas de informes listas para el cliente. Estas plantillas te permiten generar rápidamente informes pulidos de análisis de Instagram sin tener que crear los formatos desde cero. Me gusta que puedes personalizar estas plantillas con la marca de tu agencia y ajustar las métricas según las necesidades de cada cliente. Este enfoque ahorra tiempo y garantiza que cada informe de Instagram luzca profesional y sea fácil de entender para los clientes.
Características principales de AgencyAnalytics
Otras funciones que hacen útil a AgencyAnalytics para los informes de Instagram incluyen:
- Análisis de historias de Instagram: Haz seguimiento del alcance, impresiones e interacción de las historias de Instagram en widgets dedicados.
- Programación automatizada de informes: Configura envíos recurrentes de informes de análisis de Instagram a clientes según un calendario personalizado.
- Constructor de paneles de control con arrastrar y soltar: Crea paneles personalizados de Instagram añadiendo, eliminando o reordenando widgets.
- Portal de cliente marca blanca: Ofrece a los clientes acceso directo a sus análisis de Instagram mediante un portal online seguro con la marca de tu agencia.
Integraciones de AgencyAnalytics
Las integraciones incluyen Instagram, Instagram Ads, Facebook, Google Analytics 4, Google Ads, LinkedIn, LinkedIn Ads, TikTok, YouTube, Mailchimp y más.
Pros and Cons
Pros:
- Widgets preconstruidos de análisis de Instagram ahorran tiempo de configuración
- Los informes marca blanca apoyan las necesidades de branding de la agencia
- Gestión de datos de varias cuentas de Instagram en un solo lugar
Cons:
- El análisis de historias de Instagram carece de desglose avanzado
- No se admite la edición del panel en dispositivos móviles
Learn more about AgencyAnalytics: Ideal para la comparación competitiva en redes sociales
- Prueba gratuita de 14 días + demo gratuita
- Desde $199/mes (facturación anual)
Visit WebsiteCustomer Rating:4.6/5
Rival IQ visualiza datos de rendimiento en redes sociales a través de distintos canales. Si necesitas comparar tu rendimiento en Instagram frente al de la competencia, Rival IQ te ofrece una plataforma de análisis enfocada. Esta herramienta está creada para los profesionales de marketing y agencias que desean comparar métricas de Instagram y detectar tendencias entre varias marcas. Te ayuda a identificar en qué aspectos destaca tu contenido y en cuáles podrías estar quedándote atrás en tu sector.
¿Para Quién es Mejor Rival IQ?
Rival IQ es ideal para equipos de marketing y agencias que necesitan comparar el rendimiento de Instagram frente a sus competidores del sector.
Por Qué Elegí Rival IQ
Lo que diferencia a Rival IQ para los informes de Instagram es su enfoque en la medición competitiva. Elegí esta herramienta porque te permite comparar tus métricas de Instagram directamente con las de tus competidores, así puedes ver exactamente dónde eres líder o dónde te quedas atrás en tu sector. Los paneles personalizables de Rival IQ y el seguimiento automatizado de competidores facilitan monitorizar tasas de interacción, crecimiento de seguidores y el rendimiento del contenido en varias marcas. Este enfoque te da un contexto accionable para tus resultados en Instagram, no solo cifras sin analizar.
Funciones Clave de Rival IQ
Otras funciones de Rival IQ que apoyan los informes de Instagram incluyen:
- Seguimiento de hashtags: Monitoriza el rendimiento y el alcance de hashtags específicos usados en tus publicaciones de Instagram.
- Análisis de historias de Instagram: Accede a métricas como visualizaciones de historias, tasas de finalización e interacción.
- Exportación de datos históricos: Descarga datos pasados de rendimiento en Instagram para análisis más profundos o presentaciones.
- Alertas automáticas: Recibe notificaciones cuando se produzcan cambios significativos en tus métricas de Instagram o en la actividad de tus competidores.
Integraciones de Rival IQ
Actualmente no se indican integraciones nativas. Sin embargo, Rival IQ ofrece una API para integraciones personalizadas.
Pros and Cons
Pros:
- El benchmarking de competidores en Instagram es muy detallado
- Las alertas automáticas de rendimiento en Instagram están disponibles
- Se permite la exportación de datos históricos de Instagram
Cons:
- No se incluye el seguimiento de influencers en Instagram
- El análisis de anuncios en Instagram es limitado
Learn more about Rival IQ: Ideal para analíticas unificadas entre redes
- Plan gratuito disponible
- Desde $20/mes
Visit WebsiteCustomer Rating:4.5/5
Metricool ayuda a los equipos a monitorizar el engagement, las impresiones y el crecimiento entre canales sociales. Si gestionas varios canales sociales y buscas un solo lugar para monitorizar Instagram junto con otras plataformas, Metricool merece tu atención. La plataforma resulta atractiva para profesionales de marketing y agencias que necesitan analíticas unificadas y gestión de contenido para Instagram, Facebook, X y más. Ayuda a simplificar la elaboración de informes y la programación de publicaciones para equipos que gestionan múltiples cuentas y redes.
¿Para quién es mejor Metricool?
Metricool se ajusta a equipos de marketing y agencias que necesitan analíticas unificadas y programación para varias plataformas de redes sociales, incluyendo Instagram.
Por qué elegí Metricool
Lo que me atrajo de Metricool es la manera en que reúne las analíticas de Instagram junto con datos de otras redes sociales en un mismo panel. Esta vista unificada facilita mucho comparar el rendimiento de Instagram junto con Facebook, X, LinkedIn y más, sin tener que cambiar de herramienta. También valoro que Metricool permite programar publicaciones y analizar resultados de múltiples cuentas en un solo lugar, lo que resulta especialmente útil para agencias o equipos que gestionan varias marcas. Para quienes necesitan monitorizar Instagram como parte de una estrategia más amplia de redes sociales, las analíticas cruzadas de Metricool son una gran opción.
Características clave de Metricool
Otras funciones que hacen útil a Metricool para reportes de Instagram incluyen:
- Seguimiento de hashtags: Rastrea el rendimiento de hashtags específicos utilizados en tus publicaciones y campañas de Instagram.
- Analíticas de reels de Instagram: Accede a análisis dedicados para Instagram Reels, incluyendo métricas de alcance e interacción.
- Análisis de la competencia: Supervisa y compara las métricas de Instagram respecto a cuentas competidoras seleccionadas.
- Constructor de informes personalizados: Crea y exporta informes personalizados de Instagram con métricas y branding seleccionados.
Integraciones de Metricool
Entre sus integraciones se incluyen Instagram, Facebook, TikTok, YouTube, LinkedIn, Pinterest, Google Business Profile, Shopify, Canva, Google Drive y más.
Pros and Cons
Pros:
- Panel unificado de analíticas de Instagram y otras redes
- Analíticas de reels de Instagram y seguimiento de rendimiento de hashtags
- Creador de informes personalizados de Instagram con opciones de exportación
Cons:
- El acceso a datos históricos es limitado
- Las métricas de anuncios de Instagram son menos detalladas que las orgánicas
Learn more about Metricool: Mejor para la agregación de datos multiplataforma
- Plan gratuito disponible
- Desde $229/mes (facturado anualmente)
Visit WebsiteCustomer Rating:4.5/5
Whatagraph convierte los datos de marketing en informes y paneles claros y fáciles de leer. Si necesitas reunir datos de Instagram con métricas de otras plataformas, Whatagraph está diseñado para ese tipo de informes multicanal. Los equipos de marketing y las agencias lo utilizan para crear informes unificados que combinan análisis de Instagram con datos de docenas de otras fuentes. Este enfoque te ayuda a ver cómo encaja Instagram dentro del rendimiento general de tu marketing sin tener que cambiar entre varios paneles.
¿Para quién es mejor Whatagraph?
Whatagraph es ideal para agencias de marketing y equipos internos que necesitan consolidar los análisis de Instagram con datos de múltiples canales de marketing.
Por qué elegí Whatagraph
Elegí Whatagraph porque hace que la agregación de datos multiplataforma para informes de Instagram sea sencilla y flexible. La plataforma te permite reunir métricas de Instagram junto con datos de otros canales sociales, anuncios de pago y análisis web en un solo informe unificado. Me gusta que puedas automatizar estos informes de múltiples fuentes y personalizarlos con widgets, de modo que siempre veas las métricas que más importan a tu equipo o clientes. Este enfoque es especialmente útil si necesitas mostrar el impacto de Instagram como parte de una visión de marketing más amplia.
Características clave de Whatagraph
Otras funciones que hacen que Whatagraph sea útil para los informes de Instagram incluyen:
- Informes con etiqueta blanca: Crea informes con tu propia marca, colores y logotipos para presentaciones orientadas al cliente.
- Entrega programada de informes: Configura el envío automático por correo electrónico de informes de Instagram a las partes interesadas de forma recurrente.
- Plantillas predefinidas para Instagram: Usa plantillas ya hechas, diseñadas específicamente para análisis de Instagram, para agilizar la creación de informes.
- Herramientas de colaboración en equipo: Invita a miembros del equipo a colaborar en la elaboración de informes y análisis de datos dentro de la plataforma.
Integraciones de Whatagraph
Las integraciones incluyen Facebook, Instagram, LinkedIn, Pinterest, TikTok, YouTube, Google Analytics 4, Google Ads, HubSpot, Shopify y más.
Pros and Cons
Pros:
- Combina Instagram con datos de otros canales
- Permite informes de Instagram para múltiples cuentas
- Permite la colaboración en equipo en los análisis de Instagram
Cons:
- Control limitado para modelado avanzado de datos
- La actualización de datos de Instagram puede demorarse
 Ideal para integraciones avanzadas de flujos de datos
- Demo gratuita disponible
- Precio a consultar
Visit WebsiteCustomer Rating:4.5/5
Improvado agrega datos de marketing para ofrecer análisis avanzados e insights de rendimiento. Improvado es una plataforma de datos de marketing diseñada para equipos que necesitan centralizar y analizar datos de Instagram junto con otras fuentes de marketing. Resulta atractiva para los especialistas en marketing guiados por datos, agencias y empresas que buscan automatizar flujos de trabajo complejos de recopilación y generación de informes de datos. Si necesitas conectar los insights de Instagram con una amplia gama de herramientas de análisis y business intelligence, Improvado ayuda a cerrar esas brechas.
¿Para quién es ideal Improvado?
Improvado es una excelente opción para equipos de análisis de marketing en empresas medianas y grandes que necesitan unificar los datos de Instagram con otras fuentes de marketing y ventas.
Por qué elegí Improvado
Elegí Improvado porque ofrece integraciones avanzadas de flujos de datos que van mucho más allá de las exportaciones básicas de análisis de Instagram. Para los equipos que necesitan combinar datos de Instagram con docenas de otras fuentes de marketing, ventas y análisis, los conectores automatizados y las herramientas de transformación de datos de Improvado son especialmente valiosos. Valoro la posibilidad de mapear, normalizar e insertar las métricas de Instagram directamente en tu entorno de business intelligence o almacén de datos preferido. Este nivel de flexibilidad es ideal si tus necesidades de informes requieren modelos de datos personalizados o atribución entre canales.
Características clave de Improvado
Otras características que hacen de Improvado una herramienta útil para los informes de Instagram incluyen:
- Constructor de dashboards personalizados: Crea paneles adaptados para visualizar métricas de Instagram junto con otros datos de marketing.
- Motor de transformación de datos: Aplica reglas y fórmulas a los datos de Instagram antes de que lleguen a tus herramientas de informes.
- Extracción automatizada de datos: Programa extracciones regulares de métricas de Instagram sin intervención manual.
- Controles de acceso basados en roles: Gestiona quién puede ver, editar o compartir reportes de Instagram dentro de tu organización.
Integraciones de Improvado
Las integraciones incluyen Instagram Orgánico, Facebook Ads, Google Analytics 4, TikTok Ads, LinkedIn Ads, Pinterest Ads, HubSpot, Shopify, Amazon Advertising, YouTube y más.
Pros and Cons
Pros:
- Admite el mapeo personalizado de métricas de Instagram
- Permite la extracción automatizada de datos de Instagram
- Ofrece transformación avanzada de datos para Instagram
Cons:
- Requiere configuración para la normalización de datos de Instagram
- La sincronización de datos de Instagram puede registrar retrasos ocasionales
Learn more about Improvado: Mejor para análisis profundos de rendimiento visual
- Prueba gratuita de 14 días y plan gratuito disponible
- Desde $33/mes (facturación anual)
Visit WebsiteCustomer Rating:4.4/5
Iconosquare ayuda a las marcas a monitorear la interacción en redes sociales y gestionar conversaciones en un solo lugar. Si necesitas profundizar en el rendimiento de tu contenido visual en Instagram, Iconosquare ofrece analíticas diseñadas para marcas y agencias. La plataforma atrae a equipos de marketing que desean entender cómo las imágenes, videos e historias generan interacción y alcance. Iconosquare te ayuda a detectar tendencias en tu estrategia visual y a optimizar el contenido basándote en informes detallados.
¿Para quién es mejor Iconosquare?
Iconosquare es ideal para responsables de redes sociales y agencias que necesitan análisis avanzados sobre el desempeño visual en Instagram.
Por qué elegí Iconosquare
Lo que me atrajo de Iconosquare para los reportes de Instagram es su enfoque en las analíticas de rendimiento visual. La plataforma te brinda información detallada sobre cómo rinden tus imágenes, videos e historias, desglosando métricas como alcance, impresiones e interacción para cada tipo de contenido. Me gusta que puedes profundizar en la analítica a nivel de publicación y comparar formatos visuales para ver qué conecta más con tu audiencia. Este nivel de detalle es especialmente útil para marcas y agencias que dependen de un sólido relato visual para conseguir resultados en Instagram.
Funciones clave de Iconosquare
Otras funciones que hacen valioso a Iconosquare para los reportes de Instagram incluyen:
- Seguimiento de competidores: Supervisa y compara tu desempeño en Instagram frente a competidores seleccionados para identificar fortalezas y oportunidades de mejora.
- Analítica de hashtags: Haz un seguimiento del alcance y la interacción de los hashtags utilizados en tus publicaciones e historias.
- Paneles personalizables: Crea paneles con las métricas y widgets que más importan a tu equipo o clientes.
- Reportes automatizados: Programa y envía informes periódicos de rendimiento en Instagram directamente a los interesados o clientes.
Integraciones de Iconosquare
Las integraciones incluyen Instagram, Facebook, TikTok, LinkedIn, X (Twitter), Pinterest, Threads, YouTube, Dropbox, OneDrive, Zapier y más.
Pros and Cons
Pros:
- Se admite la exportación de datos históricos de Instagram
- El seguimiento de hashtags de Instagram está incluido
- Las estadísticas de historias de Instagram están integradas
Cons:
- No admite la publicación directa en todas las plataformas sociales
- La configuración de la conexión a la API de Instagram puede ser compleja
Learn more about Iconosquare: Ideal para seguimiento de KPIs en tiempo real
- Plan gratuito + prueba gratuita + demostración gratuita disponible
- Desde $64/mes (facturado anualmente)
Visit WebsiteCustomer Rating:4.5/5
Databox ayuda a los equipos a seguir el rendimiento agregando métricas de varias herramientas y plataformas. Databox ofrece a los equipos de marketing una forma de monitorizar las métricas de Instagram junto con otros KPIs empresariales en tiempo real. La plataforma es ideal para agencias y marcas que desean centralizar la analítica social y detectar rápidamente tendencias a través de múltiples fuentes de datos. Si necesitas mantener visible y accionable el rendimiento de Instagram para tu equipo, Databox ofrece un enfoque flexible de paneles de control.
¿Para Quién es Mejor Databox?
Databox es adecuado para equipos de marketing y agencias que necesitan seguir Instagram y otros KPIs en tiempo real a través de múltiples campañas.
Por Qué Elegí Databox
Lo que destaca de Databox para los informes de Instagram es su seguimiento de KPIs en tiempo real, lo cual es especialmente valioso para equipos que requieren información al minuto. Elegí Databox porque te permite crear paneles personalizados que integran métricas de Instagram junto con datos de otras plataformas de marketing y ventas, para que puedas monitorizar todo en un solo lugar. Las visualizaciones de datos en tiempo real y las alertas automáticas de la plataforma te ayudan a detectar cambios repentinos en el engagement o el alcance de Instagram a medida que ocurren. Para quienes necesitan mantener un pulso constante sobre el rendimiento en Instagram y reaccionar rápidamente a las tendencias, el enfoque en tiempo real de Databox es una excelente opción.
Funciones Clave de Databox
Otras funciones que hacen que Databox sea útil para informes de Instagram incluyen:
- Plantillas prediseñadas para Instagram: Elige entre paneles listos para usar diseñados específicamente para la analítica de Instagram.
- Entrega programada de informes: Configura el envío automático de informes de rendimiento de Instagram por correo electrónico a tu equipo o clientes.
- Seguimiento de objetivos para métricas de Instagram: Define y supervisa el avance hacia KPIs específicos de Instagram dentro de tus paneles.
- Acceso a la app móvil: Visualiza y gestiona los paneles de analítica de Instagram desde la aplicación móvil dedicada de Databox.
Integraciones de Databox
Las integraciones incluyen Instagram Business, Facebook Ads, Google Analytics 4, HubSpot, Shopify, LinkedIn Ads, Mailchimp, Google Sheets, Salesforce y más.
Pros and Cons
Pros:
- Entrega programada de informes de Instagram por correo electrónico
- Plantillas prediseñadas de analítica de Instagram disponibles
- Seguimiento de objetivos para KPIs de Instagram incluido
Cons:
- Los conectores de datos pueden ser inestables
- Análisis avanzado de sentimiento en Instagram no disponible
Learn more about Databox: Mejor para paneles personalizables de marca blanca
- Prueba gratuita de 14 días disponible
- Desde $20/mes

Reporting Ninja crea informes de marketing y analítica personalizables a partir de múltiples fuentes de datos. Reporting Ninja ofrece a los equipos de marketing y agencias una forma de crear paneles detallados de analíticas de Instagram adaptados a su marca. La plataforma está diseñada para profesionales que necesitan presentar informes listos para clientes con opciones flexibles de visualización de datos. Si deseas combinar los insights de Instagram con otros datos de marketing en una sola vista personalizable, Reporting Ninja ofrece una solución enfocada.
¿Para quién es mejor Reporting Ninja?
Reporting Ninja es ideal para agencias de marketing y consultores que necesitan entregar paneles de analítica de Instagram personalizados y con marca a sus clientes.
Por qué elegí Reporting Ninja
Lo que me atrajo de Reporting Ninja es su enfoque en paneles personalizables y de marca blanca, lo cual es especialmente valioso para agencias que gestionan analíticas de Instagram para múltiples clientes. La plataforma te permite ponerle totalmente tu marca a los informes con tu propio logotipo, colores y dominio, por lo que cada panel de Instagram se ve como una extensión de tu agencia. También valoro el sistema flexible de widgets, que te permite construir paneles que destacan exactamente las métricas de Instagram que les interesan a tus clientes. Este nivel de personalización facilita la entrega de informes de Instagram pulidos, listos para el cliente, que destacan frente a las plantillas genéricas.
Características clave de Reporting Ninja
Otras funciones que hacen que Reporting Ninja sea útil para informes de Instagram incluyen:
- Programación automática de informes: Configura informes recurrentes de análisis de Instagram para ser enviados a clientes o miembros del equipo en un calendario personalizado.
- Mezcla de datos multicanal: Combina datos de Instagram con métricas de otras plataformas de marketing en un solo panel.
- Métricas calculadas personalizadas: Crea tus propios KPIs de Instagram aplicando fórmulas a los campos de datos existentes.
- Exportación de informes en PDF y web: Exporta paneles de Instagram como PDF o compártelos a través de enlaces web en vivo para fácil acceso del cliente.
Integraciones de Reporting Ninja
Las integraciones incluyen Google Analytics 4, Meta Ads, Instagram Insights, Google Ads, Facebook Insights, LinkedIn Ads, Mailchimp, Microsoft Advertising, YouTube, TikTok Ads y más.
Pros and Cons
Pros:
- Paneles de marca blanca permiten marca de cliente completa
- Métricas calculadas personalizadas para KPIs de Instagram
- Mezcla de datos multicanal en un solo panel
Cons:
- Sin programación ni publicación de posts de Instagram
- Granularidad limitada en analíticas de historias de Instagram
Learn more about Reporting Ninja: 10Ideal para la programación automatizada de informes multicanal
Porter
- Prueba gratuita de 14 días + plan gratis disponible
- Desde $12.5/cuenta/mes (facturación anual)

Porter ayuda a los equipos a seguir el rendimiento en canales de marketing con informes automatizados. Porter es una plataforma de informes diseñada para especialistas en marketing y agencias que necesitan centralizar los análisis de Instagram junto con otros canales. La herramienta se conecta directamente a tus fuentes de datos y lleva tus métricas a Google Looker Studio para una fácil visualización. Si deseas automatizar los informes y reducir la extracción manual de datos, Porter ofrece una solución enfocada.
¿Para quién es Porter?
Porter es ideal para equipos de marketing y agencias que necesitan automatizar los informes de Instagram y de múltiples canales dentro de Google Looker Studio.
Por qué elegí Porter
Elegí Porter porque su programación automatizada de informes multicanal destaca para los equipos que gestionan varias cuentas de Instagram y otras plataformas sociales. La plataforma te permite configurar informes recurrentes que obtienen análisis de Instagram actualizados en Google Looker Studio sin intervención manual. Me gusta cómo puedes personalizar la frecuencia y el contenido de estos informes, facilitando mantener informados a los interesados. Esta automatización es especialmente útil para agencias o profesionales del marketing que necesitan entregar conocimientos consistentes y puntuales a varias cuentas de clientes.
Características clave de Porter
Otras características que hacen que Porter sea útil para los informes de Instagram incluyen:
- Plantillas prediseñadas para Instagram: Elige entre plantillas listas para visualizar rápidamente tus métricas de Instagram en Google Looker Studio.
- Mapeo de campos personalizado: Asocia los campos de datos de Instagram a la estructura de informe que prefieras para obtener análisis más personalizados.
- Conexiones multi-cuenta: Conecta y genera informes de varias cuentas de Instagram desde un único espacio de trabajo en Porter.
- Envío programado por correo electrónico: Envía automáticamente los informes de Instagram a los interesados en un horario definido, directamente desde la plataforma.
Integraciones de Porter
Las integraciones incluyen Instagram, Meta Ads, Google Ads, Google Analytics 4, Shopify, HubSpot, LinkedIn Ads, TikTok Ads, Google Sheets, Looker Studio y más.
Pros and Cons
Pros:
- Opciones de programación automatizada de informes multicanal
- Plantillas prediseñadas de análisis de Instagram disponibles
- Admite múltiples cuentas de Instagram por espacio de trabajo
Cons:
- No ofrece análisis de sentimiento para comentarios de Instagram
- Carece de comparación avanzada de la competencia en Instagram
Learn more about Porter:
Otras herramientas de informes de Instagram
Estas son algunas opciones adicionales de herramientas de informes de Instagram que no llegaron a mi lista, pero que aún merece la pena consultar:
- 11InsTrackLa mejor opción para acceso analítico centrado en dispositivos móviles
- 12DashThisIdeal para la creación rápida de paneles de control con función de arrastrar y soltar
- 13Social StatusIdeal para desgloses granulares de interacción
- 14PallyyIdeal para informes visuales de calendarios de contenido
Cómo Evalúo las Herramientas de Informes de Instagram
Divido las herramientas de informes de Instagram en dos capas: los requisitos básicos que toda herramienta debe cumplir y los diferenciadores—como la opción de marca blanca y la profundidad de los datos—que determinan si se adaptan a agencias o equipos internos.
Funcionalidad Básica (Requisitos Indispensables en Esta Lista)
Cuando selecciono herramientas para mi lista, califico cada una en una escala de 0 (no ofrece la funcionalidad) a 5 (destaca en esta área) para cada funcionalidad principal que se detalla a continuación. Luego calculo la puntuación total de la herramienta como un porcentaje. Cada herramienta necesita alcanzar una puntuación mínima total del 65% para ser considerada.
- Seguimiento de Métricas de Instagram: Verifico si la herramienta extrae datos de todo tipo de contenido—Feed, Reels, Stories, Carruseles—y va más allá de los "me gusta" para incluir guardados, compartidos y alcance.
- Creación de Informes Personalizados: Cada herramienta debe permitirte seleccionar KPIs específicos, ajustar rangos de fechas y añadir tu marca para que los informes se adapten a lo que un cliente o CMO realmente quiere ver.
- Programación Automática de Informes: Busco opciones de entrega recurrente—un PDF semanal al correo del cliente o una descarga mensual en CSV—para que los informes no consuman el tiempo del equipo.
- Análisis de Audiencia e Interacción: Una buena herramienta desglosa seguidores por edad, ubicación y género, y muestra patrones de interacción como los mejores horarios de publicación según segmento de audiencia.
- Comparativa con Competidores: Evalúo si es posible agregar perfiles de la competencia y comparar métricas lado a lado, lo cual es esencial para revisiones trimestrales y presentaciones comerciales.
- Análisis de Hashtags y Contenidos: La herramienta debe mostrar qué hashtags contribuyen realmente al alcance e identificar temáticas de contenido más exitosas, no solo listar las etiquetas que ya usaste.
Una vez tengo una lista de herramientas que cumplen estos criterios, considero qué distingue a cada plataforma.
Factores Diferenciadores (Lo que Distingue a los Proveedores)
Así es como comparo y destaco a los diferentes proveedores:
Funciones Destacadas
Pongo especial atención a si la herramienta ofrece paneles interactivos en vivo—los clientes y partes interesadas que pueden filtrar datos por sí mismos requieren menos preguntas de seguimiento. La generación de informes de múltiples plataformas también es importante, especialmente cuando tu equipo gestiona Instagram junto a TikTok o LinkedIn y necesita una visión unificada para los informes mensuales. También evalúo el seguimiento de campañas con influencers, ya que medir el rendimiento de los creadores y el valor del earned media en la misma plataforma donde obtienes las métricas orgánicas ahorra realmente tiempo al finalizar campañas.
Más Allá de las Funciones
La precisión de los datos y la profundidad histórica son aspectos cruciales aquí. Verifico si la herramienta extrae los datos por la API oficial de Instagram Graph y cuán atrás tiene históricos, ya que la ventana nativa de 90 días de Instagram rara vez cubre todo el ciclo de una campaña. Las integraciones también influyen en mi evaluación—los equipos que transfieren datos de Instagram a Looker Studio o los conectan a HubSpot para atribución necesitan conectores nativos confiables o acceso por API. Para agencias, reviso la opción de marca blanca y gestión de clientes, incluyendo URLs de informes con branding, permisos según rol y facturación de varias cuentas bajo un mismo techo.
Cómo elegir una herramienta de informes de Instagram
Es fácil perderse entre largas listas de funciones y estructuras de precios complejas. Para ayudarte a mantener la concentración mientras avanzas en tu proceso único de selección de software, aquí tienes una lista de factores que debes tener en cuenta:
| Factor | Qué debes tener en cuenta |
|---|---|
| FactorEscalabilidad | Qué debes tener en cuenta¿Admitirá la herramienta el crecimiento de tu cuenta, usuarios adicionales o varios perfiles de Instagram a medida que aumenten tus necesidades? |
| FactorIntegraciones | Qué debes tener en cuenta¿Se conecta la herramienta de forma nativa con tu conjunto actual de herramientas de marketing, como herramientas de programación, CRM o plataformas de análisis? |
| FactorPersonalización | Qué debes tener en cuenta¿Puedes adaptar los paneles, informes o notificaciones para que se ajusten a los flujos de trabajo y las necesidades de generación de informes de tu equipo? |
| FactorFacilidad de uso | Qué debes tener en cuenta¿Con qué rapidez pueden los miembros del equipo aprender a utilizar la herramienta y acceder a la información que necesitan sin formación adicional? |
| FactorImplementación e incorporación | Qué debes tener en cuenta¿Qué recursos, guías o asistencia ofrece el proveedor para ayudarte a empezar a utilizarla rápidamente? |
| FactorCoste | Qué debes tener en cuenta¿Son claros los niveles de precios y se ajustan a tu uso, el tamaño de tu equipo y tus requisitos de generación de informes? Presta atención a las tarifas ocultas. |
| FactorMedidas de seguridad | Qué debes tener en cuenta¿Sigue la herramienta las prácticas recomendadas de privacidad de datos y protección de cuentas, especialmente cuando se trata de credenciales confidenciales de Instagram? |
| FactorDisponibilidad de asistencia | Qué debes tener en cuenta¿Qué canales de asistencia se ofrecen y están disponibles durante tu horario laboral o en tu región? |
¿Qué es una herramienta de informes de Instagram?
Las herramientas de informes de Instagram son plataformas de software especializadas que rastrean, analizan y visualizan los datos de rendimiento de las cuentas de Instagram. Estas herramientas ayudan a los equipos de marketing y a los gestores de redes sociales a supervisar métricas como el crecimiento de seguidores, las tasas de interacción y el alcance del contenido. Al proporcionar paneles claros e informes exportables, la herramienta de informes de Instagram facilita la evaluación de la eficacia de las campañas, la identificación de tendencias y la planificación de futuras estrategias de contenido, todo desde una única interfaz centralizada.
Funciones de la herramienta de informes de Instagram
Al seleccionar una herramienta de informes de Instagram, presta atención a las siguientes funciones clave:
- Análisis de seguidores: Realiza un seguimiento de los cambios en el número de seguidores, identifica a los nuevos seguidores y a quienes han dejado de seguirte, y destaca las tendencias de crecimiento de la audiencia a lo largo del tiempo.
- Seguimiento de la interacción: Mide los «me gusta», los comentarios, las veces que se comparte y los guardados de las publicaciones y las historias para ayudarte a comprender qué contenido resulta más atractivo para tu audiencia.
- Informes de rendimiento del contenido: Proporciona desgloses detallados del rendimiento de cada publicación, historia o reel, incluido el alcance, las impresiones y las tasas de interacción.
- Datos demográficos de la audiencia: Analiza datos de los seguidores, como la edad, el género, la ubicación y las horas de actividad, para orientar la segmentación y la planificación del contenido.
- Análisis de etiquetas: Supervisa qué etiquetas generan más interacción y alcance, lo que te ayuda a perfeccionar tu estrategia de etiquetas para mejorar la visibilidad.
- Gestión de varias cuentas: Permite realizar un seguimiento y elaborar informes sobre varias cuentas de Instagram desde un único panel, lo que facilita el trabajo de las agencias o los equipos grandes.
- Paneles personalizables: Permite adaptar las vistas de análisis y los informes para centrarse en las métricas y los periodos de tiempo más relevantes para tu equipo.
- Informes exportables: Permite descargar o compartir datos analíticos en formatos como PDF o CSV para presentaciones, colaboración o conservación de registros.
- Actualizaciones de datos en tiempo real: Proporciona métricas y alertas actualizadas para que puedas responder rápidamente a los cambios en el rendimiento o el comportamiento de la audiencia.
- Comparativa con la competencia: Compara el rendimiento de tu cuenta con el de tus competidores para identificar fortalezas, debilidades y nuevas oportunidades.
Beneficios de la herramienta de informes de Instagram
La implementación de una herramienta de informes de Instagram ofrece varios beneficios para tu equipo y tu empresa. Estos son algunos de los que puedes esperar:
- Toma de decisiones basada en datos: El acceso a paneles de análisis e informes claros ayuda a tu equipo a tomar decisiones fundamentadas sobre el contenido y la estrategia.
- Mejora del rendimiento de las campañas: El seguimiento de la interacción y del rendimiento del contenido en tiempo real te permite identificar rápidamente qué funciona y ajustar las campañas sobre la marcha.
- Gestión eficiente de varias cuentas: Los paneles y las funciones de elaboración de informes centralizados ahorran tiempo a los equipos que gestionan varias cuentas de Instagram al mismo tiempo.
- Mejor comprensión de la audiencia: Los análisis demográficos y de comportamiento revelan quiénes son tus seguidores y cuándo están más activos, lo que permite mejorar la segmentación.
- Flujos de trabajo de informes optimizados: Los informes exportables y personalizables simplifican el intercambio de resultados con las partes interesadas y la documentación del progreso a lo largo del tiempo.
- Información sobre la competencia: Las herramientas de comparación te ayudan a comparar tu rendimiento con el de tus competidores, descubriendo nuevas oportunidades y áreas de mejora.
- Respuesta más rápida a las tendencias: Las actualizaciones de datos y las notificaciones en tiempo real te permiten reaccionar rápidamente ante aumentos o descensos en la interacción, protegiendo la reputación de tu marca.
Costes y precios de la herramienta de informes de Instagram
Seleccionar una herramienta de informes de Instagram requiere comprender los distintos modelos de precios y planes disponibles. Los costes varían en función de las funciones, el tamaño del equipo, los complementos y otros factores. La tabla siguiente resume los planes habituales, sus precios medios y las funciones que suelen incluir las soluciones de herramientas de informes de Instagram:
Tabla comparativa de planes para la herramienta de informes de Instagram
| Tipo de plan | Precio medio | Funciones habituales |
|---|---|---|
| Tipo de planPlan gratuito | Precio medio$0 | Funciones habitualesAnálisis básicos, seguimiento limitado de cuentas, historial de datos restringido y métricas de interacción sencillas. |
| Tipo de planPlan personal | Precio medio$5-$25/usuario/mes | Funciones habitualesPanel de análisis completo, compatibilidad con una sola cuenta, informes descargables e información básica sobre la audiencia. |
| Tipo de planPlan empresarial | Precio medio$30-$80/usuario/mes | Funciones habitualesGestión de varias cuentas, informes avanzados, herramientas de colaboración en equipo y análisis de etiquetas. |
| Tipo de planPlan para empresas | Precio medio$100-$300+/mes | Funciones habitualesIntegraciones personalizadas, asistencia exclusiva, comparación con la competencia, cuentas ilimitadas y acceso a la API. |
Preguntas frecuentes sobre la herramienta de informes de Instagram
Aquí tienes algunas respuestas a preguntas habituales sobre la herramienta de informes de Instagram:
¿Puede la herramienta de informes de Instagram realizar un seguimiento de las historias y los reels de Instagram?
Sí, la mayoría de las herramientas de informes de Instagram realizan un seguimiento de las métricas de rendimiento de las historias y los reels, incluidas las visualizaciones, las respuestas y la interacción. Sin embargo, el nivel de detalle de los análisis puede variar según la herramienta, así que comprueba si la solución que prefieres incluye las métricas específicas que necesitas.
¿La herramienta de informes de Instagram requiere acceso de administrador a mi cuenta de Instagram?
Sí, la mayoría de las herramientas requieren acceso de administrador o autorizado a tu cuenta de Instagram para recopilar datos. Esto es necesario para extraer análisis directamente de la API de Instagram y garantizar informes precisos y actualizados.
¿Con qué frecuencia se actualizan los datos en la herramienta de informes de Instagram?
La frecuencia de actualización de los datos depende de la herramienta, pero la mayoría actualiza las métricas en tiempo real o, al menos, diariamente. Algunas herramientas ofrecen notificaciones instantáneas para cambios importantes, mientras que otras actualizan los datos según un calendario establecido.
¿Puedo exportar informes desde la herramienta de informes de Instagram?
Sí, casi todas las herramientas de informes de Instagram permiten exportar informes en formatos como PDF o CSV. Esto facilita compartir información relevante con las partes interesadas o archivar los datos de rendimiento para consultarlos en el futuro.
¿Existe una herramienta de informes de Instagram compatible con varias cuentas?
Sí, muchas herramientas de informes de Instagram permiten gestionar varias cuentas, lo que te permite realizar un seguimiento de los análisis de varios perfiles de Instagram desde un único panel. Esto resulta especialmente útil para agencias o equipos que gestionan varias marcas.