

Et rapporteringsverktøy for Instagram er et analyseverktøy som samler inn, analyserer og visualiserer data fra kontoene dine i sosiale medier, slik at du kan følge med på resultater og måle effekten. Hvis du leter etter det beste rapporteringsverktøyet for Instagram, trenger du sannsynligvis å dokumentere avkastningen på investeringen, overvåke kampanjeeffekten og dele månedlige rapporter med teamet eller kundene dine. Mange plattformer tilbyr alt-i-ett-dashbord med AI-drevne funksjoner som fremhever viktige måltall og gir handlingsrettet innsikt for å forbedre markedsføringen. Med funksjoner som automatisert rapportering og tilpassbare maler hjelper disse verktøyene deg med å effektivisere analyser og beslutningstaking. Denne veiledningen gjennomgår de beste rapporteringsverktøyene for Instagram i 2026, slik at du kan sammenligne funksjoner, forstå hva som skiller dem fra hverandre og velge den rette løsningen for å videreutvikle markedsføringsstrategien din.
Hvorfor du kan stole på våre programvareanbefalinger
6,700+
Reviews
20
Industry experts
16+
Evaluation factors
14
Years
Teamet vårt har testet og anmeldt programvare siden 2012. Vi er selv markedsføringsledere, så vi vet hvor vanskelig og hvor viktig det er å velge riktig programvare.
I denne guiden har vi vurdert verktøyene gjennom praktisk testing og uavhengig research og gitt dem poeng ut fra våre utvelgelseskriterier.
Anmeldelsene våre bygger på vår egen redaksjonelle vurdering. De er ikke et salgsargument.
Ekspertanmeldere:
 Gui DrusinaCreative Director
- Shriya GhateSenior Marketing Lead
 Amanda JacquesMarketing Ops Leader

Sammenligningstabell for rapporteringsverktøy for Instagram
Tabellen nedenfor sammenligner prisdetaljene for mine beste utvalgte rapporteringsverktøy for Instagram.
| Tool | Best For | Trial Info | Price | ||
|---|---|---|---|---|---|
| 1 | Best with multilingual sentiment analysis | Free trial available | From $199/month (billed annually) | Website | |
| 2 | Best for client-ready report templates | Free demo + 14-day free trial | From $20/client/month (billed annually) | Website | |
| 3 | Best for competitive social media benchmarking | 14-day free trial + free demo available | From $199/month (billed annually) | Website | |
| 4 | Best for unified analytics across networks | Free plan available | From $20/month | Website | |
| 5 | Best for cross-platform data aggregation | Free demo available | From $812/month (billed annually) | Website | |
| 6 | Best for advanced data pipeline integrations | Free plan + free demo available | From $100/month | Website | |
| 7 | Best for in-depth visual performance analytics | 14-day free trial and free plan available | From $33/month (billed annually) | Website | |
| 8 | Best for real-time KPI tracking | Free plan + 14-day free trial + free demo available | From $71/month (billed annually) | Website | |
| 9 | Best for customizable white-label dashboards | 14-day free trial available | From $20/month | Website | |
| 10 | Best for automated multi-channel report scheduling | 14-day free trial + free plan available | From $12.5/account/month (billed annually) | Website |


Anmeldelser av rapporteringsverktøy for Instagram
Nedenfor finner du mine detaljerte sammendrag av rapporteringsverktøyene for Instagram som kom med på kortlisten. Anmeldelsene mine gir en detaljert gjennomgang av funksjonene, integrasjonene og de beste bruksområdene for hver plattform, slik at du kan finne den som passer best for deg.
 Best with multilingual sentiment analysis
- Free trial available
- From $199/month (billed annually)
Visit WebsiteCustomer Rating:4.7/5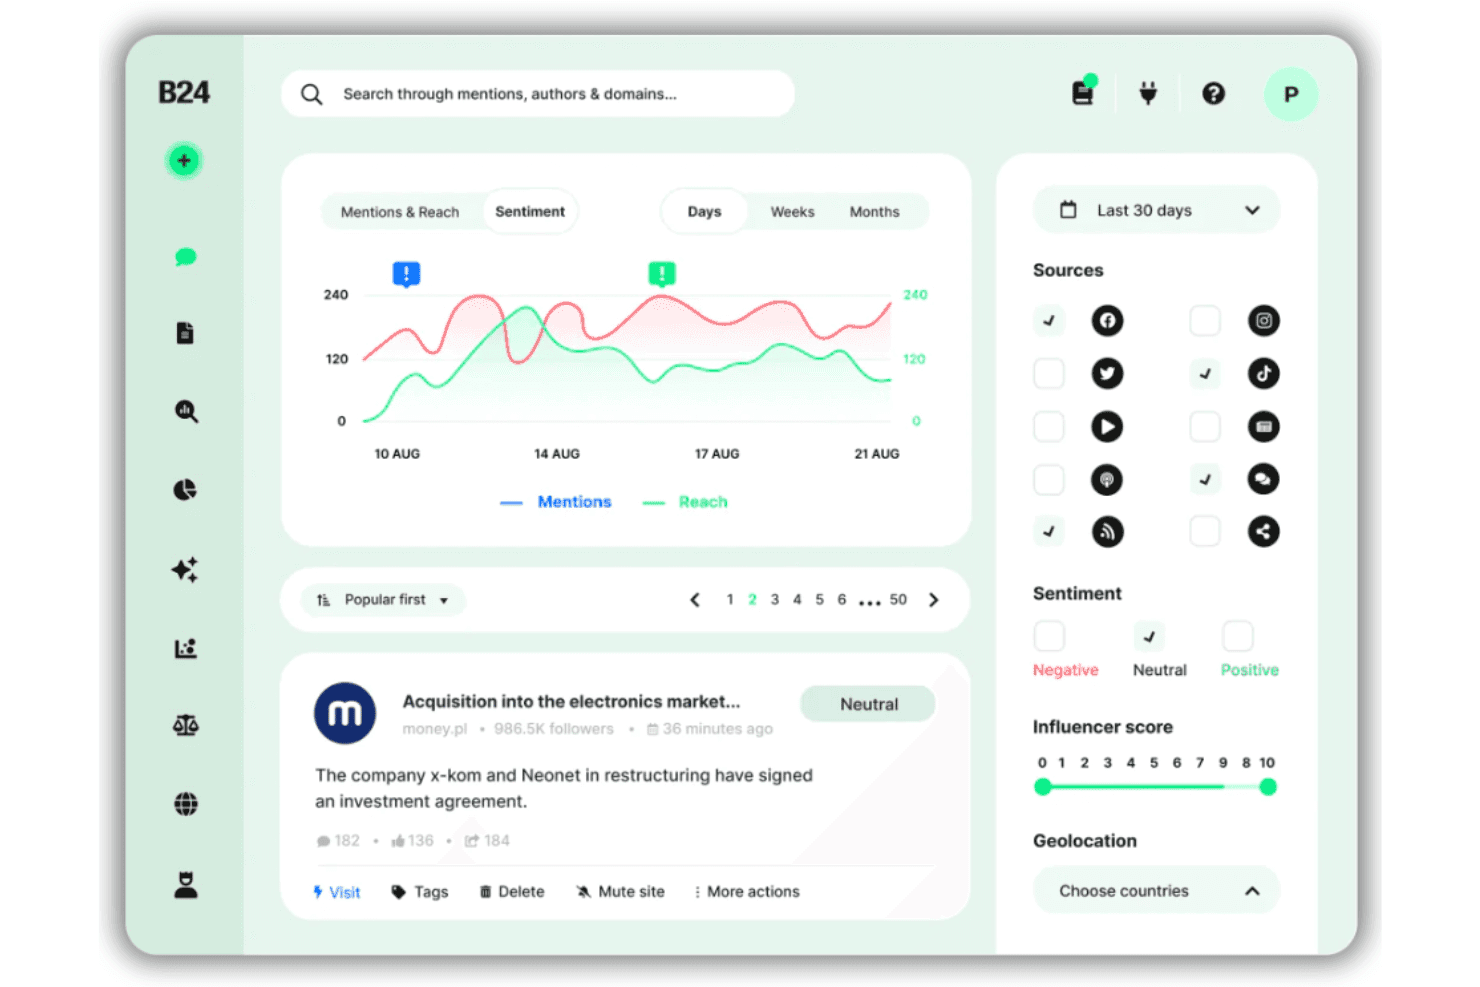
Brand24 offers a sentiment analysis dashboard with mention tracking, reach metrics, source filtering, and influencer scoring across social media platforms. Brand24 is an AI-powered social listening platform that tracks Instagram mentions, hashtag performance, sentiment, and competitor share of voice across 25M+ online sources in real time.
Who Is Brand24 Best For?
Brand24 suits marketing and PR teams at global brands or agencies that need to track Instagram sentiment and mentions across multiple languages and regions.
Why I Picked Brand24
Brand24 earns its spot as one of the best on my shortlist because its sentiment analysis covers 108 languages, which is rare among Instagram reporting tools. I love how AI Events Detection automatically flags spikes in brand mentions, so I can pinpoint the exact Instagram moment that shifted audience sentiment. The AI Insights feature then turns that raw multilingual data into a ready-to-share report without manual interpretation.
Brand24 Key Features
- QuickShare report links: Generate instant, shareable report links with adjustable date ranges for clients or teammates.
- Hashtag tracking: Monitor the reach, volume, and activity of any Instagram hashtag in real time.
- Competitor mention benchmarking: Compare share of voice and sentiment against competing brands across Instagram and other channels.
- Multi-platform source coverage: Collect and analyze brand mentions from Instagram, TikTok, Facebook, YouTube, Reddit, and more in one dashboard.
Brand24 Integrations
Brand24 offers native integrations with Slack and Microsoft Teams. An API is available for custom integrations.
Pros and Cons
Pros:
- Real-time competitor share of voice tracking
- AI detects sudden mention spikes automatically
- Sentiment analysis spans 108 languages
Cons:
- Mention caps limit large agency workflows
- Stories and Reels metrics not fully supported
Learn more about Brand24: Best for client-ready report templates
- Free demo + 14-day free trial
- From $20/client/month (billed annually)
Visit WebsiteCustomer Rating:4.7/5
AgencyAnalytics structures agency performance data. If you manage Instagram analytics for multiple clients, AgencyAnalytics gives you a way to centralize and automate your reporting. The platform is designed for agencies and marketing teams that need to deliver polished, data-rich Instagram reports without manual effort. With its focus on ready-made templates and visual dashboards, it helps you present Instagram performance in a format clients can quickly understand.
Who Is AgencyAnalytics Best For?
AgencyAnalytics is a strong choice for marketing agencies and consultants who need to deliver professional Instagram analytics reports to clients.
Why I Picked AgencyAnalytics
What makes AgencyAnalytics stand out for Instagram reporting is its library of client-ready report templates. These templates let you quickly generate polished Instagram analytics reports without having to build layouts from scratch. I like that you can customize these templates with your agency’s branding and adjust the metrics to match each client’s needs. This approach saves time and ensures that every Instagram report looks professional and is easy for clients to understand.
AgencyAnalytics Key Features
Some other features that make AgencyAnalytics useful for Instagram reporting include:
- Instagram stories analytics: Track reach, impressions, and engagement for Instagram stories in dedicated widgets.
- Automated report scheduling: Set up recurring Instagram analytics reports to be sent to clients on a custom schedule.
- Drag-and-drop dashboard builder: Build custom Instagram dashboards by adding, removing, or rearranging widgets.
- White-label client portal: Give clients direct access to their Instagram analytics through a branded, secure online portal.
AgencyAnalytics Integrations
Integrations include Instagram, Instagram Ads, Facebook, Google Analytics 4, Google Ads, LinkedIn, LinkedIn Ads, TikTok, YouTube, Mailchimp, and more.
Pros and Cons
Pros:
- Multi-account Instagram data management in one place
- White-label reporting supports agency branding needs
- Prebuilt Instagram analytics widgets save setup time
Cons:
- Mobile dashboard editing is not supported
- Instagram story analytics lack advanced breakdowns
Learn more about AgencyAnalytics: Best for competitive social media benchmarking
- 14-day free trial + free demo available
- From $199/month (billed annually)
Visit WebsiteCustomer Rating:4.6/5
Rival IQ visualizes social performance data across channels. If you need to track how your Instagram performance stacks up against competitors, Rival IQ gives you a focused analytics platform. The tool is built for marketers and agencies who want to benchmark Instagram metrics and spot trends across multiple brands. It helps you identify where your content stands out and where you might be falling behind in your industry.
Who Is Rival IQ Best For?
Rival IQ is a strong fit for marketing teams and agencies that need to benchmark Instagram performance against competitors in their industry.
Why I Picked Rival IQ
What sets Rival IQ apart for Instagram reporting is its focus on competitive benchmarking. I picked this tool because it lets you track your Instagram metrics side by side with those of your competitors, so you can see exactly where you lead or lag in your industry. Rival IQ’s customizable dashboards and automated competitor tracking make it easy to monitor engagement rates, follower growth, and content performance across multiple brands. This approach gives you actionable context for your Instagram results, not just raw numbers.
Rival IQ Key Features
Some other Rival IQ features that support Instagram reporting include:
- Hashtag tracking: Monitor the performance and reach of specific hashtags used in your Instagram posts.
- Instagram stories analytics: Access metrics for story views, completion rates, and engagement.
- Historical data exports: Download past Instagram performance data for deeper analysis or presentations.
- Automated alerts: Receive notifications when there are significant changes in your Instagram metrics or competitor activity.
Rival IQ Integrations
Native integrations are not currently listed. However, Rival IQ does offer an API for custom integrations.
Pros and Cons
Pros:
- Historical Instagram data exports are supported
- Automated Instagram performance alerts are available
- Competitor Instagram benchmarking is highly detailed
Cons:
- Instagram ad analytics are limited
- Instagram influencer tracking is not included
Learn more about Rival IQ: Best for unified analytics across networks
- Free plan available
- From $20/month
Visit WebsiteCustomer Rating:4.5/5
Metricool helps teams monitor engagement, impressions, and growth across social channels. If you manage multiple social channels and want a single place to track Instagram alongside other platforms, Metricool is worth a look. The platform appeals to marketers and agencies who need unified analytics and content management for Instagram, Facebook, X, and more. It helps simplify reporting and scheduling for teams juggling several accounts and networks.
Who Is Metricool Best For?
Metricool fits marketing teams and agencies that need unified analytics and scheduling across multiple social media platforms, including Instagram.
Why I Picked Metricool
What drew me to Metricool is how it brings Instagram analytics together with data from other social networks in one dashboard. This unified view makes it much easier to compare Instagram performance alongside Facebook, X, LinkedIn, and more, without switching between tools. I also appreciate that Metricool lets you schedule posts and analyze results for multiple accounts in a single place, which is especially useful for agencies or teams managing several brands. For anyone who needs to track Instagram as part of a broader social media strategy, Metricool’s cross-network analytics are a strong fit.
Metricool Key Features
Some other features that make Metricool useful for Instagram reporting include:
- Hashtag tracking: Track the performance of specific hashtags used in your Instagram posts and campaigns.
- Instagram reels analytics: Access dedicated analytics for Instagram Reels, including reach and engagement metrics.
- Competitor analysis: Monitor and compare Instagram metrics against selected competitors’ accounts.
- Custom report builder: Create and export tailored Instagram reports with selected metrics and branding.
Metricool Integrations
Integrations include Instagram, Facebook, TikTok, YouTube, LinkedIn, Pinterest, Google Business Profile, Shopify, Canva, Google Drive, and more.
Pros and Cons
Pros:
- Custom Instagram report builder with export options
- Instagram reels and hashtag performance tracking
- Unified Instagram and cross-network analytics dashboard
Cons:
- Instagram ad analytics less detailed than organic
- Historical data access is limited
Learn more about Metricool: Best for cross-platform data aggregation
- Free demo available
- From $812/month (billed annually)
Visit WebsiteCustomer Rating:4.5/5
Whatagraph turns marketing data into clear, easy-to-read reports and dashboards. If you need to bring together Instagram data with metrics from other platforms, Whatagraph is built for that kind of cross-channel reporting. Marketing teams and agencies use it to create unified reports that combine Instagram analytics with data from dozens of other sources. This approach helps you see how Instagram fits into your broader marketing performance without switching between multiple dashboards.
Who Is Whatagraph Best For?
Whatagraph suits marketing agencies and in-house teams that need to consolidate Instagram analytics with data from multiple marketing channels.
Why I Picked Whatagraph
I picked Whatagraph because it makes cross-platform data aggregation for Instagram reporting straightforward and flexible. The platform lets you pull Instagram metrics alongside data from other social channels, paid ads, and web analytics into a single, unified report. I like that you can automate these multi-source reports and customize them with widgets, so you always see the metrics that matter most to your team or clients. This approach is especially useful if you need to show Instagram’s impact as part of a bigger marketing picture.
Whatagraph Key Features
Some other features that make Whatagraph useful for Instagram reporting include:
- White-label reporting: Create reports with your own branding, colors, and logos for client-facing presentations.
- Scheduled report delivery: Set up automated email delivery of Instagram reports to stakeholders on a recurring basis.
- Pre-built Instagram templates: Use ready-made templates designed specifically for Instagram analytics to speed up report creation.
- Team collaboration tools: Invite team members to collaborate on report building and data analysis within the platform.
Whatagraph Integrations
Integrations include Facebook, Instagram, LinkedIn, Pinterest, TikTok, YouTube, Google Analytics 4, Google Ads, HubSpot, Shopify, and more.
Pros and Cons
Pros:
- Enables team collaboration on Instagram analytics
- Allows multi-account Instagram reporting
- Combines Instagram with other channel data
Cons:
- Instagram data refresh can be delayed
- Limited control for advanced data modeling
 Best for advanced data pipeline integrations
- Free plan + free demo available
- From $100/month
Visit WebsiteCustomer Rating:4.5/5
Improvado aggregates marketing data to deliver advanced analytics and performance insights. Improvado is a marketing data platform designed for teams that need to centralize and analyze Instagram data alongside other marketing sources. It appeals to data-driven marketers, agencies, and enterprises looking to automate complex data collection and reporting workflows. If you need to connect Instagram insights with a wide range of analytics and business intelligence tools, Improvado helps bridge those gaps.
Who Is Improvado Best For?
Improvado is a strong fit for marketing analytics teams at mid-sized to enterprise companies that need to unify Instagram data with other marketing and sales sources.
Why I Picked Improvado
I chose Improvado because it offers advanced data pipeline integrations that go far beyond basic Instagram analytics exports. For teams that need to blend Instagram data with dozens of other marketing, sales, and analytics sources, Improvado’s automated data connectors and transformation tools are especially valuable. I appreciate how you can map, normalize, and push Instagram metrics directly into your preferred business intelligence or data warehouse environment. This level of flexibility is ideal if your reporting needs require custom data models or cross-channel attribution.
Improvado Key Features
Some other features that make Improvado useful for Instagram reporting include:
- Custom dashboard builder: Create tailored dashboards to visualize Instagram metrics alongside other marketing data.
- Data transformation engine: Apply rules and formulas to Instagram data before it reaches your reporting tools.
- Automated data extraction: Schedule regular pulls of Instagram analytics without manual intervention.
- Role-based access controls: Manage who can view, edit, or share Instagram reports within your organization.
Improvado Integrations
Integrations include Instagram Organic, Facebook Ads, Google Analytics 4, TikTok Ads, LinkedIn Ads, Pinterest Ads, HubSpot, Shopify, Amazon Advertising, YouTube, and more.
Pros and Cons
Pros:
- Offers advanced data transformation for Instagram
- Enables automated Instagram data extraction
- Supports custom Instagram metric mapping
Cons:
- Instagram data syncs may have occasional delays
- Requires setup for Instagram data normalization
Learn more about Improvado: Best for in-depth visual performance analytics
- 14-day free trial and free plan available
- From $33/month (billed annually)
Visit WebsiteCustomer Rating:4.4/5
Iconosquare helps brands track social media engagement and manage conversations in one place. If you need to dig deep into your Instagram visual content performance, Iconosquare offers analytics built for brands and agencies. The platform appeals to marketing teams who want to understand how images, videos, and stories drive engagement and reach. Iconosquare helps you spot trends in your visual strategy and optimize content based on detailed reporting.
Who Is Iconosquare Best For?
Iconosquare is a strong fit for social media managers and agencies that need advanced analytics on Instagram visual content performance.
Why I Picked Iconosquare
What drew me to Iconosquare for Instagram reporting is its focus on visual performance analytics. The platform gives you granular insights into how your images, videos, and stories perform, breaking down metrics like reach, impressions, and engagement for each content type. I appreciate that you can drill into post-level analytics and compare visual formats to see what resonates most with your audience. This level of detail is especially useful for brands and agencies that rely on strong visual storytelling to drive results on Instagram.
Iconosquare Key Features
Some other features that make Iconosquare valuable for Instagram reporting include:
- Competitor tracking: Monitor and compare your Instagram performance against selected competitors to identify strengths and gaps.
- Hashtag analytics: Track the reach and engagement of specific hashtags used in your posts and stories.
- Customizable dashboards: Build dashboards with the metrics and widgets that matter most to your team or clients.
- Automated reporting: Schedule and send recurring Instagram performance reports directly to stakeholders or clients.
Iconosquare Integrations
Integrations include Instagram, Facebook, TikTok, LinkedIn, X (Twitter), Pinterest, Threads, YouTube, Dropbox, OneDrive, Zapier, and more.
Pros and Cons
Pros:
- Instagram stories analytics are built in
- Instagram hashtag tracking is included
- Historical Instagram data exports are supported
Cons:
- Instagram API connection setup can be complex
- Does not support direct posting for all social platforms
Learn more about Iconosquare: Best for real-time KPI tracking
- Free plan + 14-day free trial + free demo available
- From $71/month (billed annually)
Visit WebsiteCustomer Rating:4.5/5
Databox helps teams track performance by aggregating metrics across tools and platforms. Databox gives marketing teams a way to monitor Instagram metrics alongside other business KPIs in real time. The platform is a good fit for agencies and brands that want to centralize social analytics and quickly spot trends across multiple data sources. If you need to keep Instagram performance visible and actionable for your team, Databox offers a flexible dashboard approach.
Who Is Databox Best For?
Databox suits marketing teams and agencies that need to track Instagram and other KPIs in real time across multiple campaigns.
Why I Picked Databox
What stands out about Databox for Instagram reporting is its real-time KPI tracking, which is especially valuable for teams that need up-to-the-minute insights. I picked Databox because it lets you build custom dashboards that pull in Instagram metrics alongside data from other marketing and sales platforms, so you can monitor everything in one place. The platform’s live data visualizations and automated alerts help you catch sudden changes in Instagram engagement or reach as they happen. For anyone who needs to keep a constant pulse on Instagram performance and quickly react to trends, Databox’s real-time approach is a strong fit.
Databox Key Features
Some other features that make Databox useful for Instagram reporting include:
- Pre-built Instagram templates: Choose from ready-made dashboard templates designed specifically for Instagram analytics.
- Scheduled report delivery: Set up automated email delivery of Instagram performance reports to your team or clients.
- Goal tracking for Instagram metrics: Define and monitor progress toward specific Instagram KPIs within your dashboards.
- Mobile app access: View and manage Instagram analytics dashboards from Databox’s dedicated mobile app.
Databox Integrations
Integrations include Instagram Business, Facebook Ads, Google Analytics 4, HubSpot, Shopify, LinkedIn Ads, Mailchimp, Google Sheets, Salesforce, and more.
Pros and Cons
Pros:
- Goal tracking for Instagram KPIs included
- Pre-built Instagram analytics templates available
- Scheduled Instagram report delivery via email
Cons:
- Advanced Instagram sentiment analysis not available
- Data connectors can be unstable
Learn more about Databox: Best for customizable white-label dashboards
- 14-day free trial available
- From $20/month

Reporting Ninja creates customizable marketing and analytics reports from multiple data sources. Reporting Ninja gives marketing teams and agencies a way to create detailed Instagram analytics dashboards tailored to their brand. The platform is designed for professionals who need to present client-ready reports with flexible data visualization options. If you want to combine Instagram insights with other marketing data in a single, customizable view, Reporting Ninja offers a focused solution.
Who Is Reporting Ninja Best For?
Reporting Ninja is a good fit for marketing agencies and consultants who need to deliver branded, customizable Instagram analytics dashboards to clients.
Why I Picked Reporting Ninja
What drew me to Reporting Ninja is its focus on customizable white-label dashboards, which is especially valuable for agencies managing Instagram analytics for multiple clients. The platform lets you fully brand reports with your own logo, colors, and domain, so every Instagram dashboard looks like an extension of your agency. I also appreciate the flexible widget system, which allows you to build dashboards that highlight the exact Instagram metrics your clients care about. This level of customization makes it easy to deliver polished, client-ready Instagram reports that stand out from generic templates.
Reporting Ninja Key Features
Some other features that make Reporting Ninja useful for Instagram reporting include:
- Automated report scheduling: Set up recurring Instagram analytics reports to be sent to clients or team members on a custom schedule.
- Multi-channel data blending: Combine Instagram data with metrics from other marketing platforms in a single dashboard.
- Custom calculated metrics: Create your own Instagram KPIs by applying formulas to existing data fields.
- PDF and web report exports: Export Instagram dashboards as PDFs or share them via live web links for easy client access.
Reporting Ninja Integrations
Integrations include Google Analytics 4, Meta Ads, Instagram Insights, Google Ads, Facebook Insights, LinkedIn Ads, Mailchimp, Microsoft Advertising, YouTube, TikTok Ads, and more.
Pros and Cons
Pros:
- Multi-channel data blending in one dashboard
- Custom calculated metrics for Instagram KPIs
- White-label dashboards support full client branding
Cons:
- Limited Instagram story analytics granularity
- No Instagram post scheduling or publishing
Learn more about Reporting Ninja: 10Best for automated multi-channel report scheduling
Porter
- 14-day free trial + free plan available
- From $12.5/account/month (billed annually)

Porter helps teams track performance across marketing channels with automated reporting. Porter is a reporting platform designed for marketers and agencies who need to centralize Instagram analytics alongside other channels. The tool connects directly to your data sources and brings your metrics into Google Looker Studio for easy visualization. If you want to automate reporting and reduce manual data pulls, Porter offers a focused solution.
Who Is Porter Best For?
Porter is a good fit for marketing teams and agencies that need to automate Instagram and multi-channel reporting within Google Looker Studio.
Why I Picked Porter
I picked Porter because its automated multi-channel report scheduling stands out for teams managing multiple Instagram accounts and other social platforms. The platform lets you set up recurring reports that pull fresh Instagram analytics into Google Looker Studio without manual intervention. I appreciate how you can customize the frequency and content of these reports, making it easy to keep stakeholders updated. This automation is especially useful for agencies or marketers who need to deliver consistent, timely insights across several client accounts.
Porter Key Features
Some other features that make Porter useful for Instagram reporting include:
- Pre-built Instagram templates: Choose from ready-made templates to quickly visualize your Instagram metrics in Google Looker Studio.
- Custom field mapping: Map Instagram data fields to your preferred report structure for more tailored analytics.
- Multi-account connections: Connect and report on multiple Instagram accounts from a single Porter workspace.
- Scheduled email delivery: Automatically send Instagram reports to stakeholders on a set schedule directly from the platform.
Porter Integrations
Integrations include Instagram, Meta Ads, Google Ads, Google Analytics 4, Shopify, HubSpot, LinkedIn Ads, TikTok Ads, Google Sheets, Looker Studio, and more.
Pros and Cons
Pros:
- Supports multiple Instagram accounts per workspace
- Pre-built Instagram analytics templates available
- Automated multi-channel report scheduling options
Cons:
- Lacks advanced Instagram competitor benchmarking
- No sentiment analysis for Instagram comments
Learn more about Porter:
Andre rapporteringsverktøy for Instagram
Her er noen flere alternativer for rapporteringsverktøy for Instagram som ikke kom med på kortlisten, men som likevel er verdt å undersøke:
- 11InsTrackBest for mobile-first analytics access
- 12DashThisBest for quick drag-and-drop dashboard creation
- 13Social StatusBest for granular engagement breakdowns
- 14BufferBest for collaborative post performance tracking
- 15PallyyBest for visual content calendar reporting
How I Evaluate Instagram Reporting Tools
I split Instagram reporting tools into two layers: baseline requirements every tool must meet, and differentiators—like white-labeling and data depth—that determine fit for agencies or in-house teams.
Core Functionality (Table Stakes For This List)
When I'm selecting tools for my list, I rank each one on a scale from 0 (does not offer the functionality) to 5 (excels in this area) for each core functionality listed below. Then, I calculate the tool's total score into a percentage. Each tool needs to achieve a minimum total score of 65% to be considered for inclusion.
- Instagram Metrics Tracking: I check whether a tool pulls data for all content types—Feed, Reels, Stories, Carousels—and goes beyond likes to include saves, shares, and reach.
- Custom Report Building: Each tool should let you pick specific KPIs, adjust date ranges, and add branding so reports match what a client or CMO actually wants to see.
- Automated Report Scheduling: I look for recurring delivery options—weekly PDF to a client inbox or a monthly CSV drop—so reporting doesn't eat into your team's sprint time.
- Audience & Engagement Analytics: A good tool breaks down followers by age, location, and gender, and surfaces engagement patterns like best posting times per audience segment.
- Competitor Benchmarking: I evaluate whether you can add competitor profiles and compare metrics side by side, which is essential for quarterly reviews and pitch decks.
- Hashtag & Content Analysis: The tool should surface which hashtags drive reach and identify top-performing content themes, not just list the tags you've already used.
Once I have a list of tools that meet this criteria, I consider what sets each platform apart.
Differentiating Factors (What Sets Vendors Apart)
Here's how I compare and contrast different vendors:
Standout Features
I pay close attention to whether a tool offers live interactive dashboards—clients and stakeholders who can filter data themselves ask fewer follow-up questions. Multi-platform reporting matters too, especially when your team manages Instagram alongside TikTok or LinkedIn and needs one unified view for monthly reviews. I also evaluate influencer campaign tracking, since measuring creator-level performance and earned media value in the same place you pull organic metrics saves real time during campaign wrap-ups.
Beyond Features
Data accuracy and historical depth are a big deal here. I check whether a tool pulls data through the official Instagram Graph API and how far back it retains metrics, since Instagram's native 90-day window rarely covers a full campaign cycle. Integrations also shape my evaluation—teams that pipe Instagram data into Looker Studio or connect it to HubSpot for attribution need reliable native connectors or API access. For agencies, I look at white-labeling and client management, including branded report URLs, role-based permissions, and multi-account billing under one roof.
Slik velger du et rapporteringsverktøy for Instagram
Det er lett å gå seg vill i lange funksjonslister og kompliserte prisstrukturer. For å hjelpe deg med å holde fokus mens du går gjennom den unike prosessen med å velge programvare, har vi laget en sjekkliste over faktorer du bør ha i mente:
| Faktor | Hva bør du vurdere? |
|---|---|
| FaktorSkalerbarhet | Hva bør du vurdere?Vil verktøyet støtte veksten i kontoen din, flere brukere eller flere Instagram-profiler etter hvert som behovene dine øker? |
| FaktorIntegrasjoner | Hva bør du vurdere?Kan verktøyet kobles direkte til den eksisterende markedsføringsverktøykassen din, for eksempel planleggingsverktøy, CRM-systemer eller analyseplattformer? |
| FaktorTilpasningsmuligheter | Hva bør du vurdere?Kan du tilpasse dashbord, rapporter eller varsler slik at de passer teamets arbeidsflyter og rapporteringsbehov? |
| FaktorBrukervennlighet | Hva bør du vurdere?Hvor raskt kan teammedlemmene lære seg verktøyet og få tilgang til innsikten de trenger, uten ekstra opplæring? |
| FaktorImplementering og oppstart | Hva bør du vurdere?Hvilke ressurser, veiledninger eller hvilken kundestøtte tilbyr leverandøren for å hjelpe deg raskt i gang? |
| FaktorKostnad | Hva bør du vurdere?Er prisnivåene tydelige, og samsvarer de med bruken, teamstørrelsen og rapporteringskravene dine? Vær oppmerksom på skjulte gebyrer. |
| FaktorSikkerhetstiltak | Hva bør du vurdere?Følger verktøyet beste praksis for personvern og kontobeskyttelse, særlig når det håndterer sensitive Instagram-påloggingsopplysninger? |
| FaktorTilgjengelig kundestøtte | Hva bør du vurdere?Hvilke støttekanaler tilbys, og er de tilgjengelige i arbeidstiden din eller i regionen din? |
Hva er et rapporteringsverktøy for Instagram?
Rapporteringsverktøy for Instagram er spesialiserte programvareplattformer som sporer, analyserer og visualiserer data om Instagram-kontoers resultater. Disse verktøyene hjelper markedsføringsteam og ansvarlige for sosiale medier med å overvåke måltall som følgertilvekst, engasjementsrater og innholdsrekkevidde. Ved å tilby oversiktlige dashbord og rapporter som kan eksporteres, gjør rapporteringsverktøyet for Instagram det enklere å evaluere kampanjeresultater, identifisere trender og planlegge fremtidige innholdsstrategier – alt fra ett enkelt, sentralisert grensesnitt.
Funksjoner i rapporteringsverktøy for Instagram
Når du velger et rapporteringsverktøy for Instagram, bør du se etter følgende viktige funksjoner:
- Følgeranalyse: Sporer endringer i antall følgere, identifiserer nye følgere og personer som slutter å følge deg, og fremhever trender i publikumsvekst over tid.
- Engasjementssporing: Måler likerklikk, kommentarer, delinger og lagringer på innlegg og historier for å hjelpe deg med å forstå hvilket innhold som treffer publikum best.
- Rapporter om innholdsresultater: Gir detaljerte oversikter over hvordan individuelle innlegg, historier eller Reels gjør det, inkludert rekkevidde, visninger og engasjementsrater.
- Demografi for målgruppen: Analyserer følgerdata som alder, kjønn, sted og aktive tidspunkter for å danne grunnlag for målretting og innholdsplanlegging.
- Hashtaganalyse: Overvåker hvilke emneknagger som skaper mest engasjement og rekkevidde, slik at du kan forbedre emneknaggstrategien din og oppnå bedre synlighet.
- Administrasjon av flere kontoer: Lar deg spore og rapportere om flere Instagram-kontoer fra ett enkelt dashbord, noe som gjør det enklere for byråer eller store team.
- Dashbord som kan tilpasses: Lar deg tilpasse analysevisninger og rapporter slik at de fokuserer på måltallene og tidsperiodene som er viktigst for teamet ditt.
- Rapporter som kan eksporteres: Gjør det mulig å laste ned eller dele analysedata i formater som PDF eller CSV for presentasjoner, samarbeid eller arkivering.
- Dataoppdateringer i sanntid: Gir oppdaterte måltall og varsler, slik at du raskt kan reagere på endringer i resultater eller publikumsatferd.
- Sammenligning med konkurrenter: Sammenligner kontoens resultater med konkurrentenes for å identifisere styrker, svakheter og nye muligheter.
Fordeler med rapporteringsverktøy for Instagram
Implementering av et rapporteringsverktøy for Instagram gir flere fordeler for teamet og virksomheten din. Her er noen av fordelene du kan se frem til:
- Datadrevet beslutningstaking: Tilgang til oversiktlige analysedashbord og rapporter hjelper teamet ditt med å ta informerte valg om innhold og strategi.
- Bedre kampanjeresultater: Sporing av engasjement og innholdsresultater i sanntid gjør det mulig å raskt identifisere hva som fungerer, og justere kampanjer underveis.
- Effektiv administrasjon av flere kontoer: Sentraliserte dashbord og rapporteringsfunksjoner sparer tid for team som administrerer flere Instagram-kontoer samtidig.
- Bedre forståelse av målgruppen: Analyse av demografi og atferd viser hvem følgerne dine er, og når de er mest aktive, noe som legger til rette for bedre målretting.
- Strømlinjeformede rapporteringsprosesser: Rapporter som kan eksporteres og tilpasses, gjør det enklere å dele resultater med interessenter og dokumentere fremgang over tid.
- Konkurranseinnsikt: Verktøy for sammenligning hjelper deg med å sammenligne resultatene dine med konkurrentenes, slik at du kan avdekke nye muligheter og forbedringsområder.
- Raskere respons på trender: Dataoppdateringer og varsler i sanntid gjør det mulig å reagere raskt på økninger eller nedganger i engasjement, slik at du beskytter merkevarens omdømme.
Kostnader og priser for rapporteringsverktøy for Instagram
Valg av rapporteringsverktøy for Instagram krever en forståelse av de ulike prismodellene og abonnementene som er tilgjengelige. Kostnadene varierer basert på funksjoner, teamstørrelse, tillegg og mer. Tabellen nedenfor oppsummerer vanlige abonnementer, gjennomsnittsprisene deres og typiske funksjoner som er inkludert i løsninger for rapporteringsverktøy for Instagram:
Sammenligningstabell for abonnementer for rapporteringsverktøy for Instagram
| Abonnementstype | Gjennomsnittspris | Vanlige funksjoner |
|---|---|---|
| AbonnementstypeGratisabonnement | Gjennomsnittspris$0 | Vanlige funksjonerGrunnleggende analyse, begrenset kontosporing, begrenset datahistorikk og enkle engasjementsmåltall. |
| AbonnementstypePersonlig abonnement | Gjennomsnittspris$5-$25/user/month | Vanlige funksjonerFullt analysedashbord, støtte for én konto, rapporter som kan lastes ned, og grunnleggende publikumsinnsikt. |
| AbonnementstypeForretningsabonnement | Gjennomsnittspris$30-$80/user/month | Vanlige funksjonerAdministrasjon av flere kontoer, avansert rapportering, verktøy for teamsamarbeid og hashtaganalyse. |
| AbonnementstypeVirksomhetsabonnement | Gjennomsnittspris$100-$300+/month | Vanlige funksjonerTilpassede integrasjoner, dedikert kundestøtte, sammenligning med konkurrenter, ubegrenset antall kontoer og API-tilgang. |
Vanlige spørsmål om rapporteringsverktøy for Instagram
Her er noen svar på vanlige spørsmål om rapporteringsverktøy for Instagram:
Kan rapporteringsverktøy for Instagram spore Instagram Stories og Reels?
Ja, de fleste rapporteringsverktøy for Instagram sporer resultatmålinger for Stories og Reels, inkludert visninger, svar og engasjement. Analyseomfanget kan imidlertid variere fra verktøy til verktøy, så sjekk om løsningen du foretrekker, dekker de spesifikke målingene du trenger.
Krever rapporteringsverktøyet for Instagram administratortilgang til Instagram-kontoen min?
Ja, de fleste verktøy krever administratortilgang eller autorisert tilgang til Instagram-kontoen din for å samle inn data. Dette er nødvendig for å hente analyseinformasjon direkte fra Instagrams API og sikre nøyaktig og oppdatert rapportering.
Hvor ofte oppdateres dataene i rapporteringsverktøyet for Instagram?
Hvor ofte dataene oppdateres, avhenger av verktøyet, men de fleste oppdaterer målingene i sanntid eller minst daglig. Noen verktøy tilbyr umiddelbare varsler ved betydelige endringer, mens andre oppdaterer dataene etter en fast tidsplan.
Kan jeg eksportere rapporter fra rapporteringsverktøyet for Instagram?
Ja, nesten alle rapporteringsverktøy for Instagram lar deg eksportere rapporter i formater som PDF eller CSV. Dette gjør det enkelt å dele innsikt med interessenter eller arkivere resultatdata for fremtidig bruk.
Finnes det et rapporteringsverktøy for Instagram som støtter flere kontoer?
Ja, mange rapporteringsverktøy for Instagram støtter administrasjon av flere kontoer, slik at du kan følge med på analyser for flere Instagram-profiler fra ett enkelt kontrollpanel. Dette er spesielt nyttig for byråer eller team som administrerer flere merkevarer.