

Recensione di Google Analytics 2026: Pro, Contro, Funzionalità e Prezzi



Google Analytics is a marketing software for teams that need to track website traffic, audience behavior, and campaign performance across digital channels. I'd consider it if you want native integration with Google Ads and Search Console built in from day one—without the licensing costs and implementation overhead that come with enterprise tools like Adobe Analytics.
Google Analytics Evaluation Summary
- From $50,000/year (billed annually)
- Free plan available
Perché fidarsi dei nostri consigli sui software
Il nostro team testa e recensisce software dal 2012. In quanto leader del marketing noi stessi, sappiamo quanto sia difficile — e importante — scegliere il software giusto.
Per questa guida, abbiamo valutato gli strumenti attraverso test pratici e ricerche indipendenti, assegnando un punteggio agli strumenti in base ai nostri criteri di selezione.
Le nostre recensioni riflettono il nostro giudizio editoriale umano, non un discorso di vendita.
Revisori esperti:
Google Analytics Overview
If you’re judging Google Analytics as marketing software, I think its free tier, flexible reporting, and deep integrations set it apart for teams that want granular data and custom dashboards. The interface can feel overwhelming at first, and onboarding takes time, but the documentation and community support help bridge the gap.
I’d suggest it’s best for marketers who need to compare multi-channel performance or segment audiences in detail. While some features require technical setup, the ability to connect with ad platforms and automate reporting makes it a top pick for data-driven environments.
pros
-
Free tier offers advanced analytics for most users
-
Deep audience segmentation and funnel analysis tools
-
Free tier offers advanced analytics for most users
cons
-
Data sampling can limit accuracy for large datasets
-
Privacy and consent management require extra configuration
-
Real-time reporting is limited compared to some competitors
-

Eloqua
Visit WebsiteThis rating combines scores from multiple user review sites to reflect overall customer sentiment about the product.4.3 -
Optimizely
Visit WebsiteThis rating combines scores from multiple user review sites to reflect overall customer sentiment about the product.4.2 -
Uberflip
Visit WebsiteThis rating combines scores from multiple user review sites to reflect overall customer sentiment about the product.4.3




Come Testiamo e Valutiamo gli Strumenti
Abbiamo passato anni a costruire, perfezionare e migliorare il nostro sistema di test e valutazione del software. Il nostro metodo è progettato per cogliere le sfumature nella selezione del software e ciò che rende uno strumento efficace, concentrandoci sugli aspetti critici del processo decisionale. Qui sotto puoi vedere esattamente come funziona il nostro sistema di test e valutazione su sette criteri. Questo ci permette di offrire una valutazione imparziale del software basata su funzionalità principali, funzioni distintive, facilità d’uso, onboarding, supporto clienti, integrazioni, recensioni dei clienti e rapporto qualità-prezzo.
Funzionalità principali (25% del punteggio finale)
Il punto di partenza della nostra valutazione è sempre la funzionalità principale dello strumento. Include le caratteristiche e le funzioni basilari che un utente si aspetterebbe di trovare? Alcune di queste funzionalità sono bloccate nei piani premium? Ci aspettiamo che ogni strumento soddisfi almeno le capacità di base dei suoi concorrenti.
Funzionalità distintive (25% del punteggio finale)
Successivamente, valutiamo le funzionalità uniche che vanno oltre la normale funzionalità principale, quelle poco comuni negli strumenti simili. Un punteggio alto riflette caratteristiche specializzate o uniche che rendono il prodotto più veloce, efficiente o offrono un valore aggiunto all’utente. Valutiamo anche quanto sia semplice integrare il software con altri strumenti abitualmente usati in una tech stack, per espandere le funzionalità e l’utilità del prodotto. Sono valutate positivamente soluzioni con molte integrazioni native, connessioni di terze parti e API per creare integrazioni personalizzate.
Facilità d’uso (10% del punteggio finale)
Consideriamo la rapidità e semplicità con cui si possono eseguire le attività principali tramite lo strumento. I software con punteggio più alto sono ben progettati, intuitivi, dispongono di app mobili, offrono template e semplificano compiti complessi.
Onboarding (10% del punteggio finale)
Sappiamo quanto sia importante l’adozione rapida in azienda, quindi valutiamo la facilità di apprendimento e utilizzo di uno strumento con formazione minima. Analizziamo quanto velocemente un utente senza esperienza può iniziare a usare il software. Le soluzioni migliori richiedono poco o nessun supporto.
Supporto clienti (10% del punteggio finale)
Analizziamo la rapidità e facilità nel trovare aiuto tramite telefono, chat dal vivo o knowledge base. Gli strumenti che offrono supporto in tempo reale ottengono il punteggio migliore: i chatbot invece i peggiori.
Recensioni dei clienti (10% del punteggio finale)
Oltre ai nostri test, consideriamo il net promoter score di attuali ed ex clienti. Valutiamo la probabilità che, potendo scegliere, l’utente decida di utilizzare ancora quello strumento per le funzionalità principali. Un software con un punteggio alto corrisponde ad un alto net promoter score tra clienti attuali o passati.
Rapporto qualità-prezzo (10% del punteggio finale)
Infine, tenendo conto di tutti gli altri criteri, confrontiamo il prezzo medio dei piani base rispetto alle funzionalità principali e agli altri fattori di valutazione. I software che offrono di più, a meno, ottengono i punteggi più alti.
Core Features
Real-Time Reporting
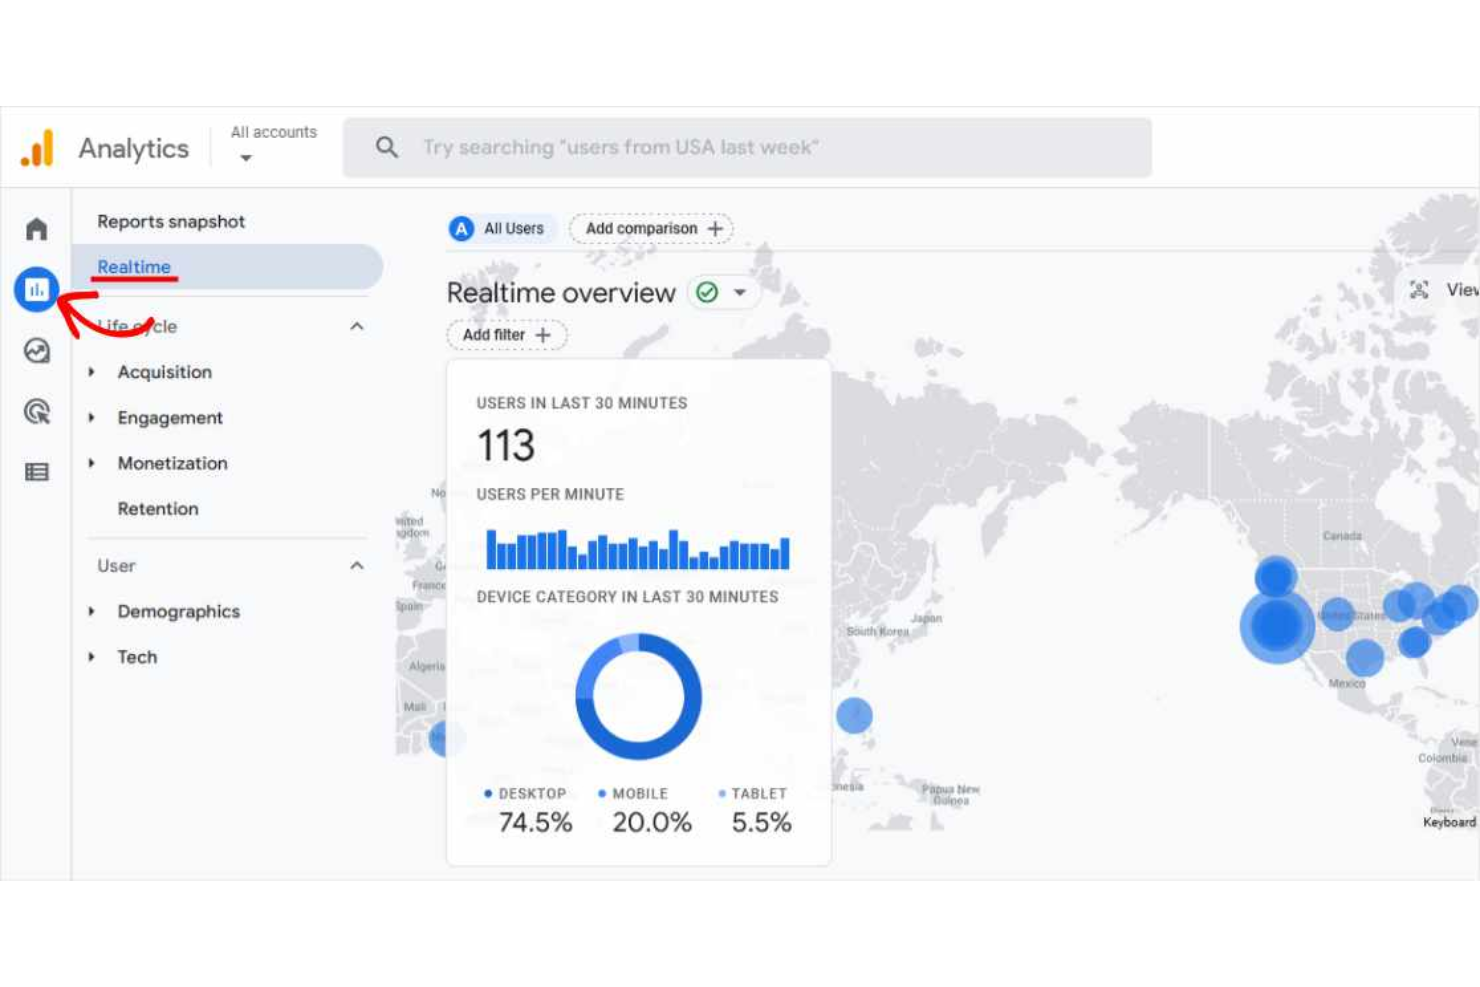
See live user activity, traffic sources, and top-performing pages as they happen. This helps you monitor campaign launches and sudden traffic spikes instantly.
Audience Segmentation
Group users by demographics, behavior, or custom criteria for targeted analysis. You can compare how different segments interact with your site or campaigns.
Conversion Tracking
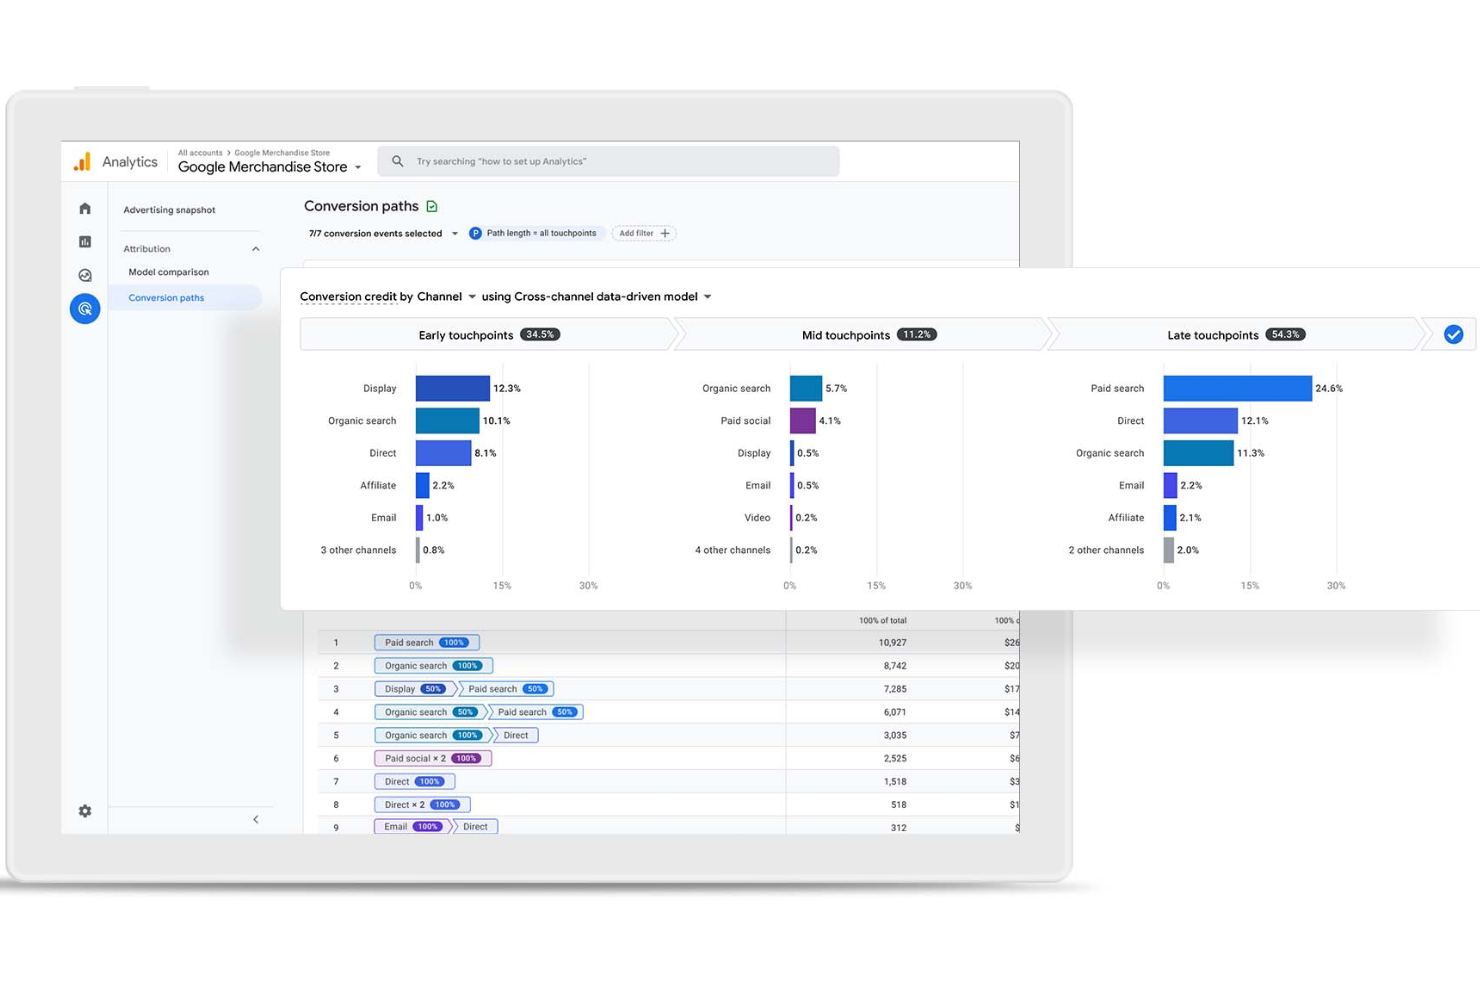
Set up goals and events to measure sign-ups, purchases, or downloads. Track the full customer journey from first visit to conversion.
Multi-Channel Attribution
Analyze how different marketing channels contribute to conversions. Attribute value across paid, organic, referral, and direct sources.
Custom Dashboards
Build personalized dashboards with the metrics and visualizations you care about most. Share these dashboards with your team for focused reporting.
Funnel Analysis
Visualize user drop-off at each stage of your sales or signup process. Identify bottlenecks and optimize steps to improve conversion rates.
Ease of Use
Google Analytics offers powerful tools, but the interface can feel overwhelming for new users, especially when setting up custom reports or advanced tracking. Many users mention that navigating menus and finding specific metrics takes practice. However, once you’re familiar with the layout, the depth of data and customization options make it a strong choice for marketers who want detailed insights and control over their analytics environment.
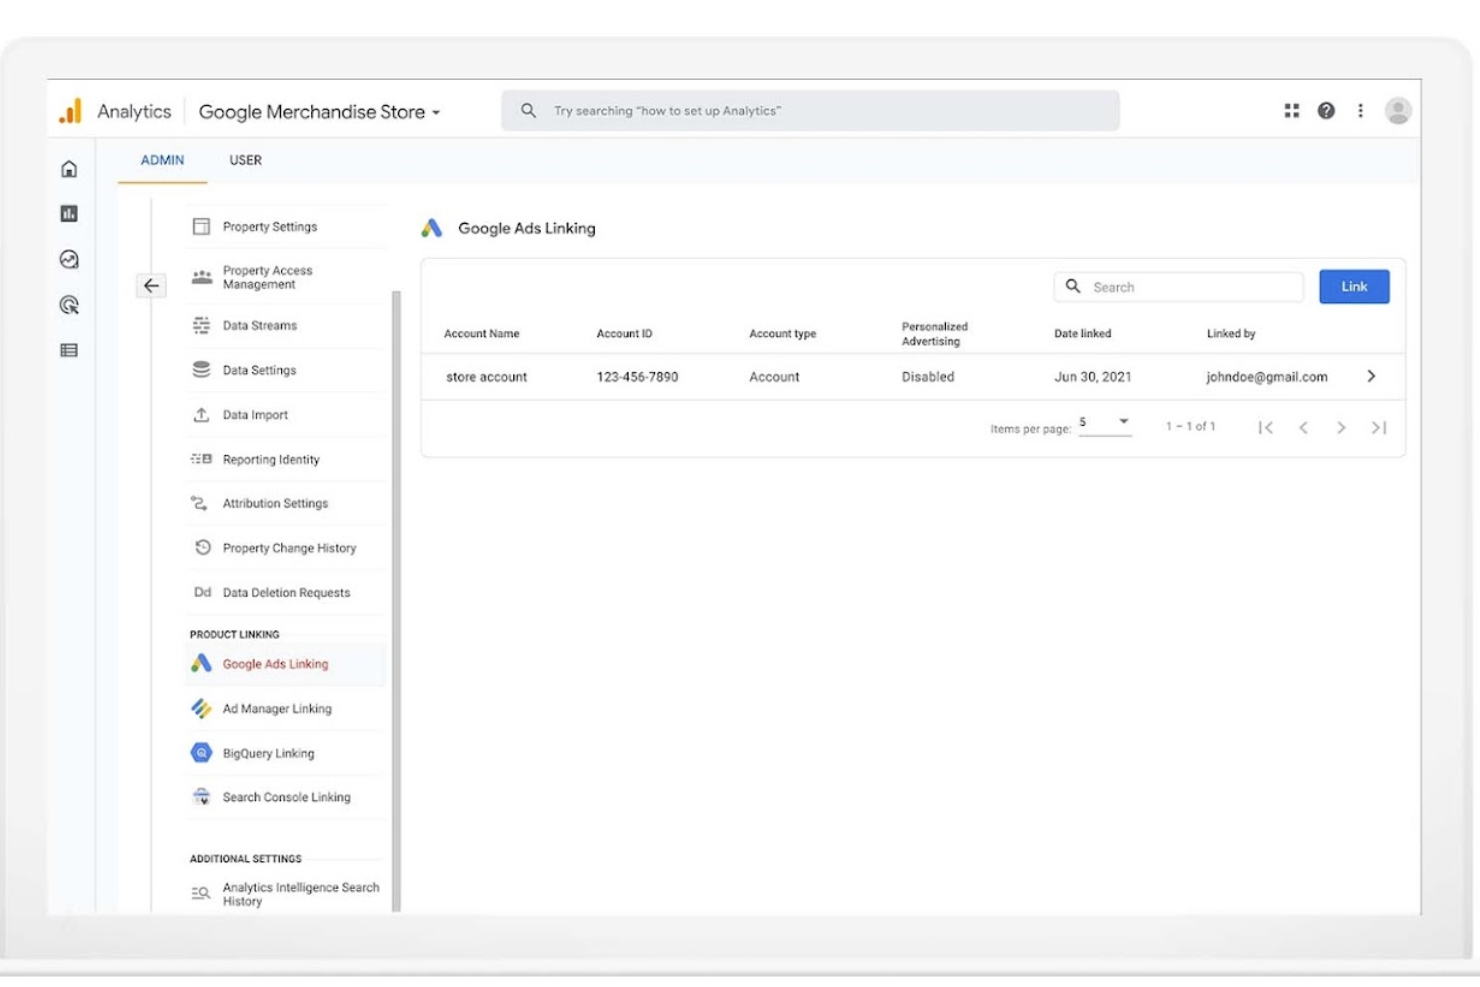
Integrations
Google Analytics integrates with Google Ads, Search Ads 360, Display & Video 360, Google Cloud, Google Search Console, Google Tag Manager, Google Optimize, Google Data Studio, Firebase, and BigQuery, among others.
Google Analytics also offers a robust API and connects with third-party integration tools.

Google Analytics Specs
- A/B Testing
- AI Integration
- Analytics
- API
- Big Data
- Campaign Management
- Conversion Tracking
- Custom Reports
- Dashboard
- Data Export
- Data Import
- Data Visualization
- External Integrations
- Feedback Management
- Keyword Tracking
- Landing Pages
- Link Tracking
- Multi-User
- Notifications
- Process Reporting
- Referral Tracking
- Sentiment Analysis
- SEO
- Workflow Management


