

Uno strumento di reportistica per Instagram è uno strumento di analisi che raccoglie, analizza e visualizza i dati dei tuoi account sui social media per aiutarti a monitorare le prestazioni e misurare i risultati. Se stai cercando il miglior strumento di reportistica per Instagram, probabilmente hai bisogno di dimostrare il ROI, monitorare l'impatto delle campagne e condividere report mensili con il tuo team o i tuoi clienti. Molte piattaforme offrono pannelli di controllo tutto-in-uno con funzionalità basate sull'intelligenza artificiale che mettono in evidenza le metriche chiave e forniscono informazioni utili per migliorare le tue attività di marketing. Grazie a funzionalità come la reportistica automatizzata e i modelli personalizzabili, questi strumenti ti aiutano a semplificare l'analisi e il processo decisionale. Questa guida analizza i migliori strumenti di reportistica per Instagram del 2026, così puoi confrontarne le funzionalità, capire cosa distingue ciascuno di essi e scegliere la soluzione giusta per portare avanti la tua strategia di marketing.
Perché fidarsi dei nostri consigli sui software
6,700+
Reviews
20
Industry experts
16+
Evaluation factors
14
Years
Il nostro team testa e recensisce software dal 2012. In quanto leader del marketing noi stessi, sappiamo quanto sia difficile — e importante — scegliere il software giusto.
Per questa guida, abbiamo valutato gli strumenti attraverso test pratici e ricerche indipendenti, assegnando un punteggio agli strumenti in base ai nostri criteri di selezione.
Le nostre recensioni riflettono il nostro giudizio editoriale umano, non un discorso di vendita.
Revisori esperti:
 Gui DrusinaDirettore creativo
- Shriya GhateSenior Marketing Lead
 Amanda JacquesResponsabile Marketing Ops

Tabella comparativa degli strumenti di reportistica per Instagram
La tabella seguente confronta i dettagli dei prezzi delle mie migliori selezioni di strumenti di reportistica per Instagram.
| Tool | Best For | Trial Info | Price | ||
|---|---|---|---|---|---|
| 1 | Il migliore per l’analisi multilingue del sentiment | Prova gratuita di 14 giorni | Da $199/mese (fatturazione annuale) | Website | |
| 2 | Ideale per modelli di report pronti per il cliente | Prova gratuita di 14 giorni + demo gratuita | Da $20/cliente/mese (fatturazione annuale) | Website | |
| 3 | Ideale per il benchmarking competitivo sui social media | Prova gratuita di 14 giorni + demo gratuita | Da $199/mese (fatturazione annuale) | Website | |
| 4 | Ideale per analisi unificate su più reti | Piano gratuito disponibile | Da $20/mese | Website | |
| 5 | Ideale per l'aggregazione di dati cross-canale | Piano gratuito disponibile | Da $229/mese (fatturazione annuale) | Website | |
| 6 | Ideale per integrazioni avanzate di pipeline dati | Demo gratuita disponibile | Prezzi su richiesta | Website | |
| 7 | Ideale per analisi approfondite delle prestazioni visive | Prova gratuita di 14 giorni e piano gratuito disponibili | A partire da $33/mese (fatturazione annuale) | Website | |
| 8 | Ideale per il monitoraggio dei KPI in tempo reale | Piano gratuito + prova gratuita + demo gratuita disponibili | Da $64/mese (fatturazione annuale) | Website | |
| 9 | Ideale per dashboard white-label personalizzabili | Prova gratuita di 14 giorni disponibile | Da $20/mese | Website | |
| 10 | Ideale per la pianificazione automatica di report multi-canale | Prova gratuita di 14 giorni + piano gratuito disponibile | Da $12.5/account/mese (fatturato annualmente) | Website |


Recensioni degli strumenti di reportistica per Instagram
Di seguito trovi i miei riepiloghi dettagliati degli strumenti di reportistica per Instagram inclusi nel mio elenco. Le mie recensioni offrono un’analisi approfondita delle funzionalità, delle integrazioni e dei casi d’uso migliori di ciascuna piattaforma, per aiutarti a trovare quella più adatta alle tue esigenze.
 Il migliore per l’analisi multilingue del sentiment
- Prova gratuita di 14 giorni
- Da $199/mese (fatturazione annuale)
Visit WebsiteCustomer Rating:4.7/5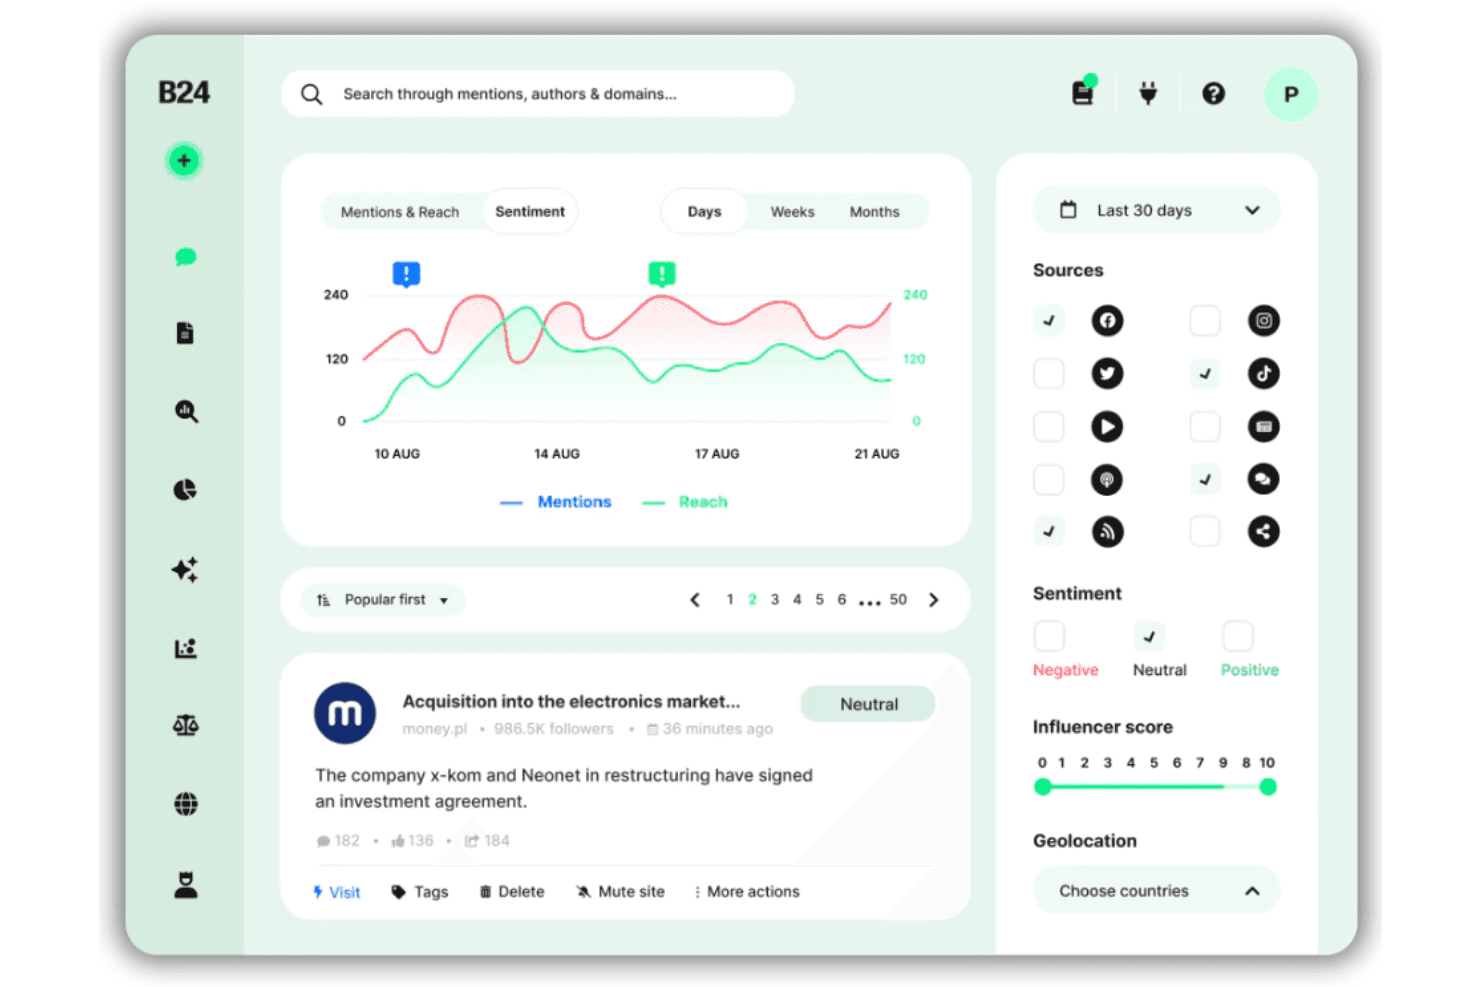
Brand24 offre una dashboard di analisi del sentiment con monitoraggio delle menzioni, metriche di copertura, filtri per fonte e punteggio influencer su diverse piattaforme social. Brand24 è una piattaforma di social listening alimentata da intelligenza artificiale che traccia le menzioni su Instagram, le performance degli hashtag, il sentiment e la quota di voce dei concorrenti su oltre 25 milioni di fonti online in tempo reale.
Per Chi è Ideale Brand24?
Brand24 è adatto a team di marketing e PR di grandi marchi o agenzie che hanno bisogno di monitorare le menzioni e il sentiment su Instagram in più lingue e regioni.
Perché Ho Scelto Brand24
Brand24 si guadagna il posto tra i migliori della mia lista perché la sua analisi del sentiment copre 108 lingue, una rarità tra gli strumenti di reporting per Instagram. Mi piace come la funzione AI Events Detection segnala automaticamente i picchi nelle menzioni del brand, così posso individuare il momento esatto su Instagram che ha cambiato il sentiment del pubblico. La funzione AI Insights trasforma poi quei dati grezzi multilingue in un report pronto da condividere senza bisogno di interpretazione manuale.
Caratteristiche Principali di Brand24
- Link ai report QuickShare: Genera istantaneamente link ai report condivisibili con intervalli di date personalizzabili per clienti o colleghi.
- Monitoraggio degli hashtag: Monitora in tempo reale la portata, il volume e l’attività di qualsiasi hashtag di Instagram.
- Benchmarking delle menzioni dei concorrenti: Confronta la quota di voce e il sentimento rispetto ai marchi concorrenti su Instagram e altri canali.
- Copertura multi-piattaforma delle fonti: Raccogli e analizza le menzioni del brand da Instagram, TikTok, Facebook, YouTube, Reddit e altro ancora in un’unica dashboard.
Integrazioni di Brand24
Brand24 offre integrazioni native con Slack e Microsoft Teams. È disponibile un’API per integrazioni personalizzate.
Pros and Cons
Pros:
- L’analisi del sentiment copre 108 lingue
- L’IA rileva automaticamente i picchi improvvisi di menzioni
- Monitoraggio in tempo reale della quota di voce dei concorrenti
Cons:
- Le metriche di Stories e Reels non sono completamente supportate
- I limiti sulle menzioni possono ostacolare il flusso di lavoro di grandi agenzie
Learn more about Brand24: Ideale per modelli di report pronti per il cliente
- Prova gratuita di 14 giorni + demo gratuita
- Da $20/cliente/mese (fatturazione annuale)
Visit WebsiteCustomer Rating:4.7/5
AgencyAnalytics struttura i dati sulle prestazioni dell’agenzia. Se gestisci le analisi di Instagram per più clienti, AgencyAnalytics ti offre un modo per centralizzare e automatizzare la creazione dei report. La piattaforma è progettata per agenzie e team di marketing che devono fornire report Instagram curati e ricchi di dati senza sforzo manuale. Con il suo focus su modelli pronti all'uso e dashboard visive, ti aiuta a presentare le prestazioni di Instagram in un formato di facile comprensione per i clienti.
Per chi è ideale AgencyAnalytics?
AgencyAnalytics è una scelta valida per agenzie di marketing e consulenti che devono fornire ai clienti report professionali sulle analisi di Instagram.
Perché ho scelto AgencyAnalytics
Ciò che distingue AgencyAnalytics per i report Instagram è la sua libreria di modelli di report pronti per i clienti. Questi modelli consentono di generare rapidamente report curati sulle analytics di Instagram senza dover creare i layout da zero. Mi piace il fatto che sia possibile personalizzare questi modelli con il branding dell'agenzia e adeguare le metriche alle esigenze di ogni cliente. Questo approccio fa risparmiare tempo e garantisce che ciascun report Instagram abbia un aspetto professionale e sia semplice da comprendere per i clienti.
Funzionalità principali di AgencyAnalytics
Altre funzionalità utili di AgencyAnalytics per i report Instagram includono:
- Analisi delle storie Instagram: monitora copertura, impression e engagement per le storie Instagram tramite widget dedicati.
- Pianificazione automatica dei report: configura l'invio ricorrente dei report di analytics Instagram ai clienti su una cadenza personalizzata.
- Dashboard personalizzabile drag-and-drop: crea dashboard Instagram su misura aggiungendo, rimuovendo o riorganizzando i widget.
- Portale clienti con white-label: dai ai clienti l'accesso diretto alle loro analytics Instagram tramite un portale online sicuro e personalizzato con il tuo marchio.
Integrazioni di AgencyAnalytics
Le integrazioni includono Instagram, Instagram Ads, Facebook, Google Analytics 4, Google Ads, LinkedIn, LinkedIn Ads, TikTok, YouTube, Mailchimp e altro ancora.
Pros and Cons
Pros:
- I widget predefiniti di analytics Instagram fanno risparmiare tempo nell'impostazione
- I report white-label supportano le esigenze di branding dell'agenzia
- Gestione dei dati Instagram di più account in un unico posto
Cons:
- Le analytics sulle storie Instagram mancano di approfondimenti avanzati
- La modifica delle dashboard da mobile non è supportata
Learn more about AgencyAnalytics: Ideale per il benchmarking competitivo sui social media
- Prova gratuita di 14 giorni + demo gratuita
- Da $199/mese (fatturazione annuale)
Visit WebsiteCustomer Rating:4.6/5
Rival IQ visualizza i dati delle performance social attraverso i canali. Se hai bisogno di monitorare come si posizionano le tue prestazioni su Instagram rispetto ai concorrenti, Rival IQ ti offre una piattaforma di analisi mirata. Lo strumento è pensato per marketer e agenzie che vogliono effettuare benchmark sui principali indicatori di Instagram e individuare i trend tra più brand. Ti aiuta a identificare dove i tuoi contenuti si distinguono e dove invece potresti essere in ritardo rispetto al settore.
A chi è più adatto Rival IQ?
Rival IQ è particolarmente indicato per team marketing e agenzie che vogliono confrontare le performance Instagram con quelle dei competitor nel loro settore.
Perché ho scelto Rival IQ
Ciò che distingue Rival IQ nella reportistica Instagram è il suo focus sul benchmarking competitivo. Ho scelto questo strumento perché ti permette di confrontare le metriche di Instagram fianco a fianco con quelle dei tuoi concorrenti, così da vedere esattamente dove sei in vantaggio o svantaggio nel tuo settore. Le dashboard personalizzabili e il monitoraggio automatizzato dei competitor rendono semplice osservare tassi di coinvolgimento, crescita dei follower e performance dei contenuti su più brand. Questo approccio ti offre un contesto utile e concreto sui tuoi risultati Instagram, non solo dati grezzi.
Funzionalità principali di Rival IQ
Altre funzionalità di Rival IQ che supportano la reportistica Instagram includono:
- Monitoraggio hashtag: Monitora la performance e la portata di hashtag specifici utilizzati nei tuoi post su Instagram.
- Analisi delle storie Instagram: Accedi a metriche su visualizzazioni delle storie, tassi di completamento e interazione.
- Esportazione dati storici: Scarica dati sulle performance passate di Instagram per analisi più approfondite o presentazioni.
- Avvisi automatici: Ricevi notifiche quando ci sono cambiamenti significativi nelle metriche Instagram o nell'attività dei concorrenti.
Integrazioni Rival IQ
Le integrazioni native al momento non sono elencate. Tuttavia, Rival IQ offre un'API per integrazioni personalizzate.
Pros and Cons
Pros:
- Benchmarking Instagram dei competitor molto dettagliato
- Disponibili avvisi automatici sulle performance Instagram
- Supporta l'esportazione di dati storici Instagram
Cons:
- Monitoraggio degli influencer su Instagram non incluso
- Analisi delle inserzioni Instagram limitata
Learn more about Rival IQ: Ideale per analisi unificate su più reti
- Piano gratuito disponibile
- Da $20/mese
Visit WebsiteCustomer Rating:4.5/5
Metricool aiuta i team a monitorare coinvolgimento, impression e crescita su diversi canali social. Se gestisci diversi canali social e desideri un unico luogo dove monitorare Instagram insieme ad altre piattaforme, Metricool merita attenzione. La piattaforma è pensata per marketer e agenzie che necessitano di analisi unificate e gestione dei contenuti per Instagram, Facebook, X e altro ancora. Aiuta a semplificare reportistica e programmazione per team che gestiscono più account e reti sociali.
Per Chi è Meglio Metricool?
Metricool si adatta ai team di marketing e alle agenzie che necessitano di analisi e pianificazione unificate su più piattaforme social, incluso Instagram.
Perché Ho Scelto Metricool
Quello che mi ha colpito di Metricool è il modo in cui riunisce le analisi di Instagram con i dati degli altri social network in un'unica dashboard. Questa visione unificata rende molto più semplice confrontare le prestazioni di Instagram insieme a Facebook, X, LinkedIn e altro ancora, senza dover passare tra strumenti diversi. Apprezzo anche che Metricool permetta di programmare i post e analizzare i risultati per più account in un solo luogo, particolarmente utile per agenzie o team che gestiscono diversi brand. Per chiunque abbia bisogno di monitorare Instagram nell'ambito di una strategia social più ampia, le analisi trasversali di Metricool sono una soluzione ideale.
Funzionalità Chiave di Metricool
Altre funzionalità che rendono Metricool utile per la reportistica di Instagram includono:
- Tracciamento degli hashtag: Monitora le prestazioni di hashtag specifici utilizzati nei tuoi post e nelle campagne Instagram.
- Analisi dei reels di Instagram: Accedi ad analisi dedicate per Instagram Reels, inclusi dati su copertura e coinvolgimento.
- Analisi della concorrenza: Monitora e confronta le metriche Instagram rispetto agli account dei concorrenti selezionati.
- Generatore di report personalizzati: Crea ed esporta report Instagram su misura scegliendo metriche e personalizzazioni grafiche.
Integrazioni di Metricool
Le integrazioni includono Instagram, Facebook, TikTok, YouTube, LinkedIn, Pinterest, Google Business Profile, Shopify, Canva, Google Drive e altro ancora.
Pros and Cons
Pros:
- Dashboard unificata di analisi Instagram e cross-network
- Monitoraggio delle prestazioni di reels e hashtag di Instagram
- Generatore di report Instagram personalizzato con opzioni di esportazione
Cons:
- L'accesso ai dati storici è limitato
- Analisi delle inserzioni Instagram meno dettagliata rispetto all'organico
Learn more about Metricool: Ideale per l'aggregazione di dati cross-canale
- Piano gratuito disponibile
- Da $229/mese (fatturazione annuale)
Visit WebsiteCustomer Rating:4.5/5
Whatagraph trasforma i dati di marketing in report e dashboard chiari e di facile lettura. Se hai bisogno di unire i dati di Instagram con le metriche di altre piattaforme, Whatagraph è progettato proprio per questo tipo di reportistica cross-canale. I team di marketing e le agenzie lo utilizzano per creare report unificati che combinano le analisi di Instagram con i dati provenienti da decine di altre fonti. Questo approccio ti aiuta a vedere come Instagram si inserisce nelle tue performance di marketing complessive senza dover passare da una dashboard all'altra.
A chi è più indicato Whatagraph?
Whatagraph è adatto alle agenzie di marketing e ai team interni che hanno bisogno di consolidare l'analisi di Instagram con dati provenienti da più canali di marketing.
Perché ho scelto Whatagraph
Ho scelto Whatagraph perché semplifica e rende flessibile l'aggregazione dei dati cross-canale per la reportistica di Instagram. La piattaforma consente di inserire le metriche di Instagram accanto ai dati di altri canali social, annunci a pagamento e analisi web all'interno di un unico report unificato. Mi piace la possibilità di automatizzare questi report multi-fonte e personalizzarli con widget, così puoi sempre visualizzare le metriche che contano di più per il tuo team o per i clienti. Questo approccio è particolarmente utile se devi mostrare l'impatto di Instagram come parte di una strategia di marketing più ampia.
Funzionalità principali di Whatagraph
Altre funzionalità che rendono Whatagraph utile per la reportistica di Instagram includono:
- Report white-label: Crea report con il tuo marchio, colori e loghi per presentazioni verso i clienti.
- Consegna programmata dei report: Imposta l'invio automatico via email dei report di Instagram agli stakeholder su base ricorrente.
- Modelli Instagram predefiniti: Utilizza modelli già pronti pensati specificamente per l'analisi di Instagram, per velocizzare la creazione dei report.
- Strumenti di collaborazione per il team: Invita i membri del team a collaborare nella creazione dei report e nell'analisi dei dati direttamente sulla piattaforma.
Integrazioni Whatagraph
Le integrazioni includono Facebook, Instagram, LinkedIn, Pinterest, TikTok, YouTube, Google Analytics 4, Google Ads, HubSpot, Shopify e molto altro.
Pros and Cons
Pros:
- Combina Instagram con i dati di altri canali
- Consente la reportistica su più account Instagram
- Permette la collaborazione del team sulle analisi di Instagram
Cons:
- Controllo limitato per modeling avanzato dei dati
- L'aggiornamento dei dati Instagram può subire ritardi
 Ideale per integrazioni avanzate di pipeline dati
- Demo gratuita disponibile
- Prezzi su richiesta
Visit WebsiteCustomer Rating:4.5/5
Improvado aggrega i dati di marketing per fornire analisi avanzate e insight sulle performance. Improvado è una piattaforma di gestione dei dati di marketing progettata per i team che hanno bisogno di centralizzare e analizzare i dati Instagram insieme ad altre fonti di marketing. Si rivolge a marketer orientati ai dati, agenzie e aziende che desiderano automatizzare i flussi complessi di raccolta e reportistica dei dati. Se hai necessità di connettere gli insight di Instagram con una vasta gamma di strumenti di analisi e business intelligence, Improvado aiuta a colmare queste lacune.
A chi è più adatto Improvado?
Improvado è particolarmente indicato per i team di analisi marketing di aziende di medie e grandi dimensioni che devono unificare i dati Instagram con altre fonti di marketing e vendita.
Perché ho scelto Improvado
Ho scelto Improvado perché offre integrazioni avanzate delle pipeline dati che vanno ben oltre le semplici esportazioni di analytics Instagram. Per i team che hanno bisogno di integrare i dati di Instagram con decine di altre fonti di marketing, vendita e analisi, i connettori automatizzati di Improvado e gli strumenti di trasformazione dei dati risultano particolarmente preziosi. Apprezzo la possibilità di mappare, normalizzare e inviare direttamente le metriche Instagram nel proprio ambiente di business intelligence o data warehouse preferito. Questo livello di flessibilità è ideale se le esigenze di reportistica richiedono modelli di dati personalizzati o attribuzione cross-canale.
Funzionalità principali di Improvado
Altre funzionalità che rendono Improvado utile per la reportistica Instagram includono:
- Costruttore di dashboard personalizzate: Crea dashboard su misura per visualizzare le metriche Instagram insieme ad altri dati di marketing.
- Motore di trasformazione dati: Applica regole e formule ai dati Instagram prima che raggiungano i tuoi strumenti di reportistica.
- Estrazione automatica dei dati: Pianifica prelievi regolari delle analytics Instagram senza intervento manuale.
- Controlli di accesso basati sui ruoli: Gestisci chi può visualizzare, modificare o condividere i report Instagram all'interno della tua organizzazione.
Integrazioni di Improvado
Le integrazioni includono Instagram Organic, Facebook Ads, Google Analytics 4, TikTok Ads, LinkedIn Ads, Pinterest Ads, HubSpot, Shopify, Amazon Advertising, YouTube e altro ancora.
Pros and Cons
Pros:
- Supporta la mappatura personalizzata delle metriche Instagram
- Consente l'estrazione automatizzata dei dati Instagram
- Offre trasformazione avanzata dei dati per Instagram
Cons:
- È necessario configurare la normalizzazione dei dati Instagram
- La sincronizzazione dei dati Instagram può subire occasionalmente dei ritardi
Learn more about Improvado: Ideale per analisi approfondite delle prestazioni visive
- Prova gratuita di 14 giorni e piano gratuito disponibili
- A partire da $33/mese (fatturazione annuale)
Visit WebsiteCustomer Rating:4.4/5
Iconosquare aiuta i brand a monitorare il coinvolgimento sui social media e a gestire le conversazioni in un unico posto. Se hai bisogno di analizzare in profondità le prestazioni dei tuoi contenuti visivi su Instagram, Iconosquare offre analisi pensate per brand e agenzie. La piattaforma è ideale per i team di marketing che desiderano comprendere come immagini, video e storie generano coinvolgimento e copertura. Iconosquare ti aiuta a individuare tendenze nella tua strategia visiva e a ottimizzare i contenuti grazie a report dettagliati.
A Chi È Rivolto Iconosquare?
Iconosquare è particolarmente adatto a responsabili dei social media e agenzie che necessitano di analisi avanzate sulle prestazioni dei contenuti visivi su Instagram.
Perché Ho Scelto Iconosquare
Ciò che mi ha attratto di Iconosquare per l’analisi di Instagram è il suo focus sulle analisi delle prestazioni visive. La piattaforma offre approfondimenti dettagliati su come performano immagini, video e storie, suddividendo metriche come copertura, impression e coinvolgimento per ogni tipologia di contenuto. Apprezzo il fatto che sia possibile approfondire le analisi a livello di singolo post e confrontare i formati visivi per capire cosa risuona di più con il pubblico. Questo livello di dettaglio è particolarmente utile per brand e agenzie che puntano su un forte storytelling visivo per ottenere risultati su Instagram.
Funzionalità Principali di Iconosquare
Altre funzionalità che rendono Iconosquare prezioso per l’analisi di Instagram includono:
- Monitoraggio dei competitor: Monitora e confronta le prestazioni del tuo account Instagram con quelle dei competitor selezionati per individuare punti di forza e aree di miglioramento.
- Analisi degli hashtag: Analizza la copertura e l’engagement degli hashtag specifici utilizzati nei tuoi post e storie.
- Dashboard personalizzabili: Crea dashboard con le metriche e i widget più rilevanti per il tuo team o i tuoi clienti.
- Report automatizzati: Pianifica e invia report ricorrenti sulle prestazioni di Instagram direttamente ai responsabili o ai clienti.
Integrazioni di Iconosquare
Le integrazioni includono Instagram, Facebook, TikTok, LinkedIn, X (Twitter), Pinterest, Threads, YouTube, Dropbox, OneDrive, Zapier e altre ancora.
Pros and Cons
Pros:
- Sono supportate esportazioni dei dati storici di Instagram
- Il monitoraggio degli hashtag su Instagram è incluso
- Le analisi delle storie di Instagram sono integrate
Cons:
- Non supporta la pubblicazione diretta per tutte le piattaforme social
- La configurazione della connessione API di Instagram può essere complessa
Learn more about Iconosquare: Ideale per il monitoraggio dei KPI in tempo reale
- Piano gratuito + prova gratuita + demo gratuita disponibili
- Da $64/mese (fatturazione annuale)
Visit WebsiteCustomer Rating:4.5/5
Databox aiuta i team a monitorare le prestazioni aggregando le metriche tra strumenti e piattaforme. Databox offre ai team di marketing un modo per monitorare le metriche di Instagram insieme ad altri KPI aziendali in tempo reale. La piattaforma è ideale per agenzie e brand che desiderano centralizzare l’analisi dei social e individuare rapidamente tendenze da più fonti di dati. Se hai bisogno di mantenere le prestazioni di Instagram sempre visibili e facilmente azionabili per il tuo team, Databox propone una soluzione di dashboard flessibile.
Per chi è ideale Databox?
Databox è adatto a team di marketing e agenzie che devono monitorare Instagram e altri KPI in tempo reale su più campagne.
Perché ho scelto Databox
Ciò che distingue Databox per il reporting su Instagram è il monitoraggio dei KPI in tempo reale, particolarmente prezioso per i team che necessitano di insight aggiornati minuto per minuto. Ho scelto Databox perché permette di creare dashboard personalizzate che aggregano le metriche di Instagram insieme ai dati di altre piattaforme di marketing e vendita, così da poter monitorare tutto in un solo posto. Le visualizzazioni dati in tempo reale e gli avvisi automatici della piattaforma aiutano a cogliere cambiamenti improvvisi nel coinvolgimento o nell’audience di Instagram mentre si verificano. Per chi ha bisogno di mantenere costantemente sotto controllo le prestazioni su Instagram e reagire rapidamente alle tendenze, l’approccio in tempo reale di Databox è la scelta giusta.
Caratteristiche principali di Databox
Altre funzionalità che rendono Databox utile per i report su Instagram includono:
- Template Instagram predefiniti: Scegli tra dashboard già pronte create appositamente per l’analisi di Instagram.
- Report pianificati: Configura l’invio automatico via email dei report sulle prestazioni di Instagram al tuo team o ai clienti.
- Monitoraggio obiettivi per le metriche Instagram: Definisci e controlla i progressi verso specifici KPI di Instagram direttamente nelle tue dashboard.
- Accesso tramite app mobile: Visualizza e gestisci le dashboard di analisi Instagram direttamente dall’app mobile dedicata di Databox.
Integrazioni Databox
Le integrazioni includono Instagram Business, Facebook Ads, Google Analytics 4, HubSpot, Shopify, LinkedIn Ads, Mailchimp, Google Sheets, Salesforce e molte altre.
Pros and Cons
Pros:
- Report programmati su Instagram via email
- Template di analisi Instagram predefiniti disponibili
- Monitoraggio degli obiettivi per i KPI di Instagram incluso
Cons:
- I connettori dati possono essere instabili
- Analisi avanzata del sentiment di Instagram non disponibile
Learn more about Databox: Ideale per dashboard white-label personalizzabili
- Prova gratuita di 14 giorni disponibile
- Da $20/mese

Reporting Ninja crea report di marketing e analisi personalizzabili da fonti dati multiple. Reporting Ninja offre ai team di marketing e alle agenzie la possibilità di creare dashboard analitiche Instagram dettagliate, personalizzate secondo il proprio marchio. La piattaforma è progettata per i professionisti che devono presentare report pronti per i clienti con opzioni flessibili di visualizzazione dei dati. Se desideri combinare le statistiche di Instagram con altri dati di marketing in un'unica visualizzazione personalizzabile, Reporting Ninja propone una soluzione mirata.
A Chi è Destinato Reporting Ninja?
Reporting Ninja è indicato per agenzie di marketing e consulenti che devono consegnare dashboard analitiche Instagram personalizzate e brandizzate ai loro clienti.
Perché Ho Scelto Reporting Ninja
Ciò che mi ha colpito di Reporting Ninja è il suo focus sui dashboard white-label personalizzabili, una caratteristica particolarmente preziosa per le agenzie che gestiscono le analytics Instagram di più clienti. La piattaforma consente di personalizzare completamente i report con il proprio logo, colori e dominio, così ogni dashboard Instagram appare come un'estensione dell'agenzia stessa. Apprezzo anche il sistema flessibile di widget, che permette di creare dashboard in grado di evidenziare esattamente le metriche Instagram di interesse per ogni cliente. Questo livello di personalizzazione consente di offrire report Instagram curati e pronti per i clienti che spiccano rispetto ai template generici.
Funzionalità Principali di Reporting Ninja
Altre funzionalità che rendono Reporting Ninja utile per la reportistica su Instagram includono:
- Pianificazione automatica dei report: Imposta report ricorrenti di analytics Instagram da inviare a clienti o membri del team secondo una programmazione personalizzata.
- Integrazione dati multi-canale: Combina dati Instagram con metriche di altre piattaforme di marketing in un'unica dashboard.
- Metriche personalizzate calcolate: Crea i tuoi KPI Instagram applicando formule ai campi dati esistenti.
- Esportazione report in PDF e web: Esporta le dashboard Instagram in formato PDF o condividile tramite link web live per un facile accesso da parte dei clienti.
Integrazioni di Reporting Ninja
Le integrazioni includono Google Analytics 4, Meta Ads, Instagram Insights, Google Ads, Facebook Insights, LinkedIn Ads, Mailchimp, Microsoft Advertising, YouTube, TikTok Ads e altri ancora.
Pros and Cons
Pros:
- Dashboard white-label con pieno supporto al branding del cliente
- Metriche calcolate personalizzate per KPI Instagram
- Integrazione dati multi-canale in un'unica dashboard
Cons:
- Nessuna funzione di pianificazione o pubblicazione dei post Instagram
- Granularità limitata dell'analisi delle storie Instagram
Learn more about Reporting Ninja: 10Ideale per la pianificazione automatica di report multi-canale
Porter
- Prova gratuita di 14 giorni + piano gratuito disponibile
- Da $12.5/account/mese (fatturato annualmente)

Porter aiuta i team a monitorare le performance dei canali di marketing con reportistica automatizzata. Porter è una piattaforma di reportistica progettata per marketer e agenzie che devono centralizzare le analisi di Instagram insieme ad altri canali. Lo strumento si collega direttamente alle tue fonti di dati e porta le metriche in Google Looker Studio per una visualizzazione semplice. Se vuoi automatizzare la creazione di report e ridurre l’estrazione manuale dei dati, Porter offre una soluzione mirata.
Per chi è ideale Porter?
Porter è adatto a team di marketing e agenzie che devono automatizzare la reportistica di Instagram e multi-canale all’interno di Google Looker Studio.
Perché ho scelto Porter
Ho scelto Porter perché la sua pianificazione automatica dei report multi-canale si distingue per i team che gestiscono più account Instagram e altre piattaforme social. La piattaforma consente di impostare report ricorrenti che importano nuove analisi di Instagram in Google Looker Studio senza intervento manuale. Apprezzo la possibilità di personalizzare la frequenza e il contenuto di questi report, facilitando l’aggiornamento costante degli stakeholder. Questa automazione è particolarmente utile per agenzie o marketer che devono fornire informazioni coerenti e tempestive su più account clienti.
Funzionalità principali di Porter
Altre funzionalità che rendono Porter utile per la reportistica di Instagram includono:
- Template predefiniti per Instagram: Scegli tra modelli già pronti per visualizzare rapidamente le metriche di Instagram in Google Looker Studio.
- Mappatura campi personalizzata: Associa i campi dati di Instagram alla struttura preferita del tuo report per analisi più su misura.
- Connessioni multi-account: Collega e genera report per più account Instagram da un unico workspace Porter.
- Invio programmato via email: Invia automaticamente report Instagram agli stakeholder secondo una pianificazione direttamente dalla piattaforma.
Integrazioni di Porter
Le integrazioni includono Instagram, Meta Ads, Google Ads, Google Analytics 4, Shopify, HubSpot, LinkedIn Ads, TikTok Ads, Google Sheets, Looker Studio e altro ancora.
Pros and Cons
Pros:
- Opzioni di pianificazione automatica dei report multi-canale
- Template di analisi Instagram predefiniti disponibili
- Supporta più account Instagram per workspace
Cons:
- Nessuna analisi del sentiment dei commenti su Instagram
- Manca il benchmarking avanzato dei competitor su Instagram
Learn more about Porter:
Altri strumenti di reportistica per Instagram
Ecco alcune altre opzioni di strumenti di reportistica per Instagram che non sono state incluse nel mio elenco, ma che vale comunque la pena prendere in considerazione:
- 11InsTrackIdeale per l’accesso alle analytics in modalità mobile-first
- 12DashThisIdeale per la creazione rapida di dashboard drag-and-drop
- 13Social StatusIdeale per suddivisioni granulari dell'engagement
- 14PallyyIdeale per la creazione di report visivi sul calendario dei contenuti
Come Valuto gli Strumenti di Reporting per Instagram
Suddivido gli strumenti di reporting per Instagram in due livelli: i requisiti di base che ogni strumento deve soddisfare, e i fattori differenzianti—come il white-labeling e la profondità dei dati—che determinano l'idoneità per agenzie o team interni.
Funzionalità di Base (Requisiti Minimi per Questa Lista)
Quando seleziono gli strumenti per la mia lista, valuto ciascuno su una scala da 0 (non offre la funzionalità) a 5 (eccelle in quest'area) per ogni funzionalità di base elencata sotto. Poi, calcolo il punteggio totale dello strumento in percentuale. Ogni strumento deve ottenere un punteggio totale minimo del 65% per essere considerato per l'inclusione.
- Monitoraggio delle Metriche di Instagram: Controllo se lo strumento recupera dati per tutti i tipi di contenuti—Feed, Reels, Storie, Carousel—e va oltre i like includendo anche salvataggi, condivisioni e copertura.
- Creazione di Report Personalizzati: Ogni strumento dovrebbe permettere di scegliere KPI specifici, modificare gli intervalli di date e aggiungere branding in modo che i report rispecchino ciò che un cliente o CMO davvero desidera vedere.
- Pianificazione Automatica dei Report: Cerco opzioni di invio ricorrente—ad esempio PDF settimanale nella casella di posta del cliente o CSV mensile—così il reporting non sottrae tempo prezioso agli sprint del tuo team.
- Analisi del Pubblico e del Coinvolgimento: Un buon strumento suddivide i follower per età, località e genere, ed evidenzia i modelli di engagement come i momenti migliori per pubblicare per ciascun segmento del pubblico.
- Benchmarking dei Competitor: Valuto se puoi aggiungere profili dei competitor e confrontare le metriche fianco a fianco, fondamentale per le revisioni trimestrali e i pitch deck.
- Analisi degli Hashtag e dei Contenuti: Lo strumento dovrebbe rivelare quali hashtag aumentano la copertura e identificare i temi di contenuto con le migliori performance, non solo elencare i tag già utilizzati.
Una volta ottenuta una lista di strumenti che soddisfano questi criteri, considero cosa distingue ciascuna piattaforma.
Fattori Differenzianti (Cosa Distingue i Fornitori)
Ecco come confronto diversi fornitori:
Funzionalità Distintive
Pongo molta attenzione a se uno strumento offre dashboard interattive live—clienti e stakeholder che possono filtrare i dati da soli fanno meno domande di approfondimento. Anche il reporting multi-piattaforma è importante, soprattutto quando il tuo team gestisce Instagram insieme a TikTok o LinkedIn e necessita di una visione unificata per le revisioni mensili. Valuto inoltre il tracciamento delle campagne con influencer, perché misurare le performance dei creator e il valore dei media guadagnati nello stesso luogo in cui recuperi le metriche organiche fa davvero risparmiare tempo negli wrap-up delle campagne.
Oltre le Funzionalità
La precisione e la profondità storica dei dati sono aspetti fondamentali qui. Controllo se uno strumento recupera i dati tramite l'Instagram Graph API ufficiale e fino a che punto mantiene lo storico, dato che la finestra nativa di 90 giorni di Instagram raramente copre un intero ciclo di campagna. Anche le integrazioni sono parte integrante della mia valutazione—i team che portano i dati di Instagram su Looker Studio o li collegano a HubSpot per l’attribuzione necessitano di connettori nativi affidabili o accesso API. Per le agenzie, valuto il white-labeling e la gestione dei clienti, inclusi URL dei report personalizzati, permessi basati sui ruoli e fatturazione multi-account sotto un unico tetto.
Come scegliere uno strumento di reportistica per Instagram
È facile perdersi in lunghi elenchi di funzionalità e strutture di prezzo complesse. Per aiutarti a rimanere concentrato mentre affronti il tuo specifico processo di selezione del software, ecco una lista di fattori da tenere a mente:
| Fattore | Cosa considerare |
|---|---|
| FattoreScalabilità | Cosa considerareLo strumento supporterà la crescita del tuo account, l'aggiunta di utenti o più profili Instagram con l'espandersi delle tue esigenze? |
| FattoreIntegrazioni | Cosa considerareLo strumento si connette nativamente al tuo attuale ecosistema di marketing, ad esempio a strumenti di programmazione, CRM o piattaforme di analisi? |
| FattorePersonalizzazione | Cosa considerarePuoi adattare pannelli di controllo, report o notifiche ai flussi di lavoro e alle esigenze di reportistica del tuo team? |
| FattoreSemplicità d'uso | Cosa considerareQuanto velocemente i membri del team possono imparare a usare lo strumento e accedere alle informazioni di cui hanno bisogno senza una formazione aggiuntiva? |
| FattoreImplementazione e avviamento | Cosa considerareQuali risorse, guide o servizi di supporto fornisce il fornitore per aiutarti a iniziare rapidamente? |
| FattoreCosto | Cosa considerareI livelli di prezzo sono chiari e in linea con il tuo utilizzo, le dimensioni del team e i requisiti di reportistica? Fai attenzione ai costi nascosti. |
| FattoreMisure di sicurezza | Cosa considerareLo strumento segue le migliori pratiche per la privacy dei dati e la protezione degli account, soprattutto quando gestisce credenziali Instagram sensibili? |
| FattoreDisponibilità dell'assistenza | Cosa considerareQuali canali di assistenza sono disponibili e sono accessibili durante il tuo orario lavorativo o nella tua regione? |
Che cos'è uno strumento di reportistica per Instagram?
Gli strumenti di reportistica per Instagram sono piattaforme software specializzate che monitorano, analizzano e visualizzano i dati sulle prestazioni degli account Instagram. Questi strumenti aiutano i team di marketing e i responsabili dei social media a monitorare metriche come la crescita dei follower, i tassi di coinvolgimento e la portata dei contenuti. Grazie a dashboard chiare e report esportabili, lo strumento di reportistica per Instagram semplifica la valutazione dell'efficacia delle campagne, l'identificazione delle tendenze e la definizione delle future strategie dei contenuti, tutto da un'unica interfaccia centralizzata.
Funzionalità dello strumento di reportistica per Instagram
Quando scegli uno strumento di reportistica per Instagram, presta attenzione alle seguenti funzionalità chiave:
- Analisi dei follower: monitora le variazioni nel numero di follower, identifica i nuovi follower e quelli che non seguono più l'account ed evidenzia le tendenze di crescita del pubblico nel tempo.
- Monitoraggio del coinvolgimento: misura i Mi piace, i commenti, le condivisioni e i salvataggi nei post e nelle storie per aiutarti a capire quali contenuti suscitano maggiore interesse nel tuo pubblico.
- Report sulle prestazioni dei contenuti: fornisce analisi dettagliate delle prestazioni dei singoli post, delle storie o dei Reel, inclusi portata, impression e tassi di coinvolgimento.
- Dati demografici del pubblico: analizza dati sui follower come età, genere, posizione e orari di attività per orientare il targeting e la pianificazione dei contenuti.
- Analisi degli hashtag: monitora quali hashtag generano il maggiore coinvolgimento e la maggiore portata, aiutandoti a perfezionare la strategia degli hashtag per ottenere una visibilità migliore.
- Gestione di più account: consente di monitorare e creare report per più account Instagram da un'unica dashboard, rendendo più semplice il lavoro per agenzie o team numerosi.
- Dashboard personalizzabili: permettono di adattare le visualizzazioni analitiche e i report per concentrarsi sulle metriche e sugli intervalli temporali più importanti per il tuo team.
- Report esportabili: consentono di scaricare o condividere i dati analitici in formati come PDF o CSV per presentazioni, collaborazione o archiviazione.
- Aggiornamenti dei dati in tempo reale: forniscono metriche e avvisi aggiornati, così puoi reagire rapidamente ai cambiamenti nelle prestazioni o nel comportamento del pubblico.
- Confronto con la concorrenza: confronta le prestazioni del tuo account con quelle dei concorrenti per identificare punti di forza, debolezze e nuove opportunità.
Vantaggi dello strumento di reportistica per Instagram
L'implementazione di uno strumento di reportistica per Instagram offre diversi vantaggi al tuo team e alla tua azienda. Ecco alcuni dei risultati che puoi aspettarti:
- Processo decisionale basato sui dati: l'accesso a dashboard e report analitici chiari aiuta il tuo team a prendere decisioni consapevoli sui contenuti e sulla strategia.
- Migliori prestazioni delle campagne: il monitoraggio in tempo reale del coinvolgimento e delle prestazioni dei contenuti consente di identificare rapidamente ciò che funziona e di adattare le campagne in corso d'opera.
- Gestione efficiente di più account: le dashboard centralizzate e le funzionalità di reportistica fanno risparmiare tempo ai team che gestiscono contemporaneamente diversi account Instagram.
- Migliore comprensione del pubblico: le analisi demografiche e comportamentali rivelano chi sono i tuoi follower e quando sono più attivi, favorendo un targeting più efficace.
- Flussi di lavoro per la reportistica semplificati: i report esportabili e personalizzabili semplificano la condivisione dei risultati con gli stakeholder e la documentazione dei progressi nel tempo.
- Informazioni sulla concorrenza: gli strumenti di confronto ti aiutano a comparare le tue prestazioni con quelle dei concorrenti, facendo emergere nuove opportunità e aree di miglioramento.
- Risposta più rapida alle tendenze: gli aggiornamenti dei dati e le notifiche in tempo reale consentono di reagire rapidamente agli aumenti o alle diminuzioni del coinvolgimento, proteggendo la reputazione del tuo marchio.
Costi e prezzi dello strumento di reportistica per Instagram
La scelta di uno strumento di reportistica per Instagram richiede la comprensione dei vari modelli di prezzo e dei piani disponibili. I costi variano in base alle funzionalità, alle dimensioni del team, agli extra e ad altri fattori. La tabella seguente riassume i piani più comuni, i relativi prezzi medi e le funzionalità generalmente incluse nelle soluzioni di reportistica per Instagram:
Tabella comparativa dei piani per lo strumento di reportistica per Instagram
| Tipo di piano | Prezzo medio | Funzionalità comuni |
|---|---|---|
| Tipo di pianoPiano gratuito | Prezzo medio$0 | Funzionalità comuniAnalisi di base, monitoraggio limitato degli account, cronologia dei dati limitata e metriche di coinvolgimento semplici. |
| Tipo di pianoPiano personale | Prezzo medio$5-$25/utente/mese | Funzionalità comuniDashboard analitica completa, supporto per un singolo account, report scaricabili e informazioni di base sul pubblico. |
| Tipo di pianoPiano aziendale | Prezzo medio$30-$80/utente/mese | Funzionalità comuniGestione di più account, reportistica avanzata, strumenti di collaborazione per i team e analisi degli hashtag. |
| Tipo di pianoPiano per grandi aziende | Prezzo medio$100-$300+/mese | Funzionalità comuniIntegrazioni personalizzate, assistenza dedicata, confronto con la concorrenza, account illimitati e accesso API. |
Domande frequenti sullo strumento di reportistica di Instagram
Ecco alcune risposte alle domande comuni sullo strumento di reportistica di Instagram:
Lo strumento di reportistica di Instagram può monitorare le Storie e i Reel di Instagram?
Sì, la maggior parte degli strumenti di reportistica di Instagram monitora le metriche delle Storie e dei Reel, comprese visualizzazioni, risposte e coinvolgimento. Tuttavia, il livello di dettaglio delle analisi può variare in base allo strumento, quindi verifica che la soluzione preferita includa le metriche specifiche di cui hai bisogno.
Lo strumento di reportistica di Instagram richiede l'accesso amministratore al mio account Instagram?
Sì, la maggior parte degli strumenti richiede l’accesso amministratore o autorizzato al tuo account Instagram per raccogliere i dati. Ciò è necessario per recuperare le analisi direttamente dall’API di Instagram e garantire report accurati e aggiornati.
Con quale frequenza vengono aggiornati i dati nello strumento di reportistica di Instagram?
La frequenza di aggiornamento dei dati dipende dallo strumento, ma la maggior parte aggiorna le metriche in tempo reale o almeno quotidianamente. Alcuni strumenti offrono notifiche istantanee per cambiamenti significativi, mentre altri aggiornano i dati secondo una pianificazione prestabilita.
Posso esportare i report dallo strumento di reportistica di Instagram?
Sì, quasi tutti gli strumenti di reportistica di Instagram consentono di esportare i report in formati come PDF o CSV. Ciò semplifica la condivisione degli insight con gli stakeholder o l’archiviazione dei dati sulle prestazioni per consultazioni future.
Esiste uno strumento di reportistica di Instagram che supporta più account?
Sì, molti strumenti di reportistica di Instagram supportano la gestione di più account, consentendo di monitorare le analisi di diversi profili Instagram da un’unica dashboard. È particolarmente utile per le agenzie o i team che gestiscono più marchi.