

Avis Looker Studio 2026 : Avantages, inconvénients, fonctionnalités et tarifs
Looker Studio se distingue grâce à son intégration fluide avec Google et sa visualisation de données flexible, permettant aux équipes de transformer leurs données en tableaux de bord et rapports interactifs et lisibles.

Nous évaluons les outils de manière indépendante, et les commissions aident à financer nos tests. Consultez notre politique de transparence, notre méthodologie ou suggérez un outil.
Looker Studio is a marketing intelligence software built around data visualization and dashboard reporting, designed for teams that need to pull marketing data into a single, shareable view. I'd consider it most seriously if your stack is Google-heavy—it connects natively with GA4, Google Ads, and Search Console out of the box. It's also free, which puts it in a different category than Tableau for teams that need flexible, custom reporting without a licensing cost attached to every seat.
Looker Studio Evaluation Summary
4.4/5
- From $9/user/project/month
- Free plan available
Pourquoi faire confiance à nos recommandations de logiciels
6,700+
Reviews
20
Industry experts
16+
Evaluation factors
14
Years
Notre équipe teste et évalue des logiciels depuis 2012. En tant que leaders marketing nous-mêmes, nous savons à quel point il est difficile — et important — de choisir le bon logiciel.
Pour ce guide, nous avons évalué les outils grâce à des tests pratiques et une recherche indépendante, en notant les outils selon nos critères de sélection.
Nos avis reflètent notre jugement éditorial humain, et non un argumentaire de vente.
Réviseurs experts:
 Gui DrusinaDirecteur de la création
- Shriya GhateSenior Marketing Lead
 Amanda JacquesResponsable Marketing Ops

Looker Studio Overview
If you’re judging Looker Studio against other marketing intelligence software, I think its Google ecosystem integration, free pricing tier, and easy onboarding make it a top pick for teams already using Google Workspace. The drag-and-drop interface and wide range of connectors help you quickly build dashboards, but advanced users may find its analytics depth limited compared to more specialized tools.
In my experience, it’s best for marketing teams that need fast, collaborative reporting and don’t require heavy-duty data modeling or complex automation. For example, campaign performance dashboards and cross-channel reporting are where Looker Studio shines.
Pros
- Looker Studio offers intuitive data visualization tools that are easy for your team to use.
- It provides real-time data updates, keeping your work current and accurate.
- The platform supports collaboration, making it simple for your team to work together on data projects.
Cons
- Some users find the learning curve a bit steep, which might slow your team's initial adoption.
- The customization options for visualizations are limited, which might not meet all your needs.
- Advanced users may find the depth of features lacking for highly specialized tasks.
Is Looker Studio Right For Your Needs?
Who Would be a Good Fit for Looker Studio?
Looker Studio is ideal for marketing teams, finance departments, and tech startups that need to turn data into actionable insights quickly. Its real-time data updates and collaborative features help your team stay informed and aligned. If you’re in an industry where data-driven decisions are key, like e-commerce or SaaS, Looker Studio’s intuitive visualizations and straightforward interface make it a solid choice for your team.
- Marketing TeamsLooker Studio helps your team visualize campaign performance data, making it easier to track KPIs and adjust strategies in real-time.
- Finance DepartmentsIts real-time data updates let your team monitor financial trends and make informed budgeting decisions.
- Tech StartupsThe platform supports rapid iteration and data-driven decision-making crucial for your fast-paced environment.
- E-commerce BusinessesLooker Studio’s visualizations help you track sales trends and customer behavior, enhancing your strategic planning.
- Product ManagersYou can leverage data insights to guide product development and align with user needs.
- Business AnalystsThe intuitive interface and visualization tools make it easier for you to analyze data and convey insights to stakeholders.
Who Would be a Bad Fit for Looker Studio?
Looker Studio might not suit large corporations with highly specialized data needs or industries requiring deep customization, like aerospace or pharmaceuticals. If your team needs complex, tailored visualizations or advanced analytics beyond the standard offerings, you might find Looker Studio’s customization options too limited. Additionally, if your organization lacks the resources for initial training, the learning curve could be a barrier.
- Aerospace CompaniesThe need for highly specialized and custom data visualizations might not be met by Looker Studio’s standard features.
- Pharmaceutical ResearchAdvanced analytics and customization required for clinical data might be beyond Looker Studio’s capabilities.
- Large EnterprisesComplex data environments and specific needs for customization might not be fully supported.
- Data ScientistsThe platform’s visualizations may not meet the depth of analysis and customization you require.
- Custom Analytics TeamsIf your work requires building highly tailored analytics solutions, Looker Studio’s limitations could be a hindrance.
- Government AgenciesThe need for highly secure, customized, and complex data handling might not align with Looker Studio’s offerings.
Comment nous testons et évaluons les outils
Nous avons passé des années à construire, affiner et améliorer notre système de test et de notation des logiciels. Notre grille d’évaluation est conçue pour prendre en compte toutes les nuances du choix logiciel et ce qui rend un outil efficace, en mettant l’accent sur les aspects critiques du processus de décision. Ci-dessous, vous pouvez découvrir précisément comment nos tests et notations fonctionnent selon sept critères. Cela nous permet d’offrir une évaluation impartiale des logiciels en fonction de la fonctionnalité principale, des fonctionnalités différenciantes, de la facilité d’utilisation, de l’onboarding, du support client, des intégrations, des avis clients et du rapport qualité-prix.
Fonctionnalité principale (25% de la note finale)
Le point de départ de notre évaluation est toujours la fonctionnalité principale de l’outil. Dispose-t-il des fonctions de base attendues ? Certaines de ces fonctionnalités sont-elles bloquées dans des offres tarifaires supérieures ? Nous attendons d’un outil qu’il soit à la hauteur des capacités fondamentales de ses concurrents.
Fonctionnalités différenciantes (25% de la note finale)
Ensuite, nous évaluons les fonctionnalités spéciales qui vont au-delà de ce que l’on trouve habituellement chez ce type d’outils. Un score élevé indique des fonctionnalités uniques ou spécialisées qui rendent le produit plus rapide, plus efficace, ou offrent une valeur ajoutée à l’utilisateur. Nous évaluons également la facilité d’intégration avec d’autres outils couramment utilisés pour élargir les possibilités et l’utilité du logiciel. Les outils offrant de nombreuses intégrations natives, des connexions tierces et un accès API pour bâtir des intégrations personnalisées obtiennent les meilleures notes.
Facilité d’utilisation (10% de la note finale)
Nous considérons la rapidité et la facilité d’exécution des tâches principales via l’outil. Les logiciels les mieux notés sont bien conçus, intuitifs à utiliser, proposent des applications mobiles, des modèles prêts à l’emploi, et simplifient des tâches parfois complexes.
Onboarding (10% de la note finale)
Nous savons combien l’adoption rapide par l’équipe est cruciale pour une nouvelle plateforme. Nous évaluons donc la facilité avec laquelle il est possible d’apprendre et d’utiliser un outil sans formation poussée. On mesure aussi la vitesse à laquelle un membre de l’équipe peut être opérationnel, sans expérience préalable. Les solutions bien notées requièrent peu ou pas d’assistance.
Support client (10% de la note finale)
Nous examinons la rapidité et la facilité avec lesquelles on peut obtenir de l’aide par téléphone, chat en direct ou base de connaissances. Les outils et sociétés offrant un support en temps réel sont favorisés ; les chatbots sont pénalisés.
Avis clients (10% de la note finale)
Au-delà de nos propres tests et évaluations, nous prenons en compte le score de recommandation nette des clients actuels et passés. Nous étudions leur propension, si l’occasion se présente, à réutiliser l’outil pour sa fonctionnalité principale. Un score élevé reflète donc un bon taux de recommandation.
Rapport qualité-prix (10% de la note finale)
Enfin, après avoir pris en compte tous les autres critères, nous confrontons le prix moyen des offres de base aux fonctionnalités principales et prenons en compte la valeur apportée par les autres éléments d’évaluation. Les logiciels qui offrent plus pour moins obtiennent une note supérieure.
Core Features
Customizable Dashboards
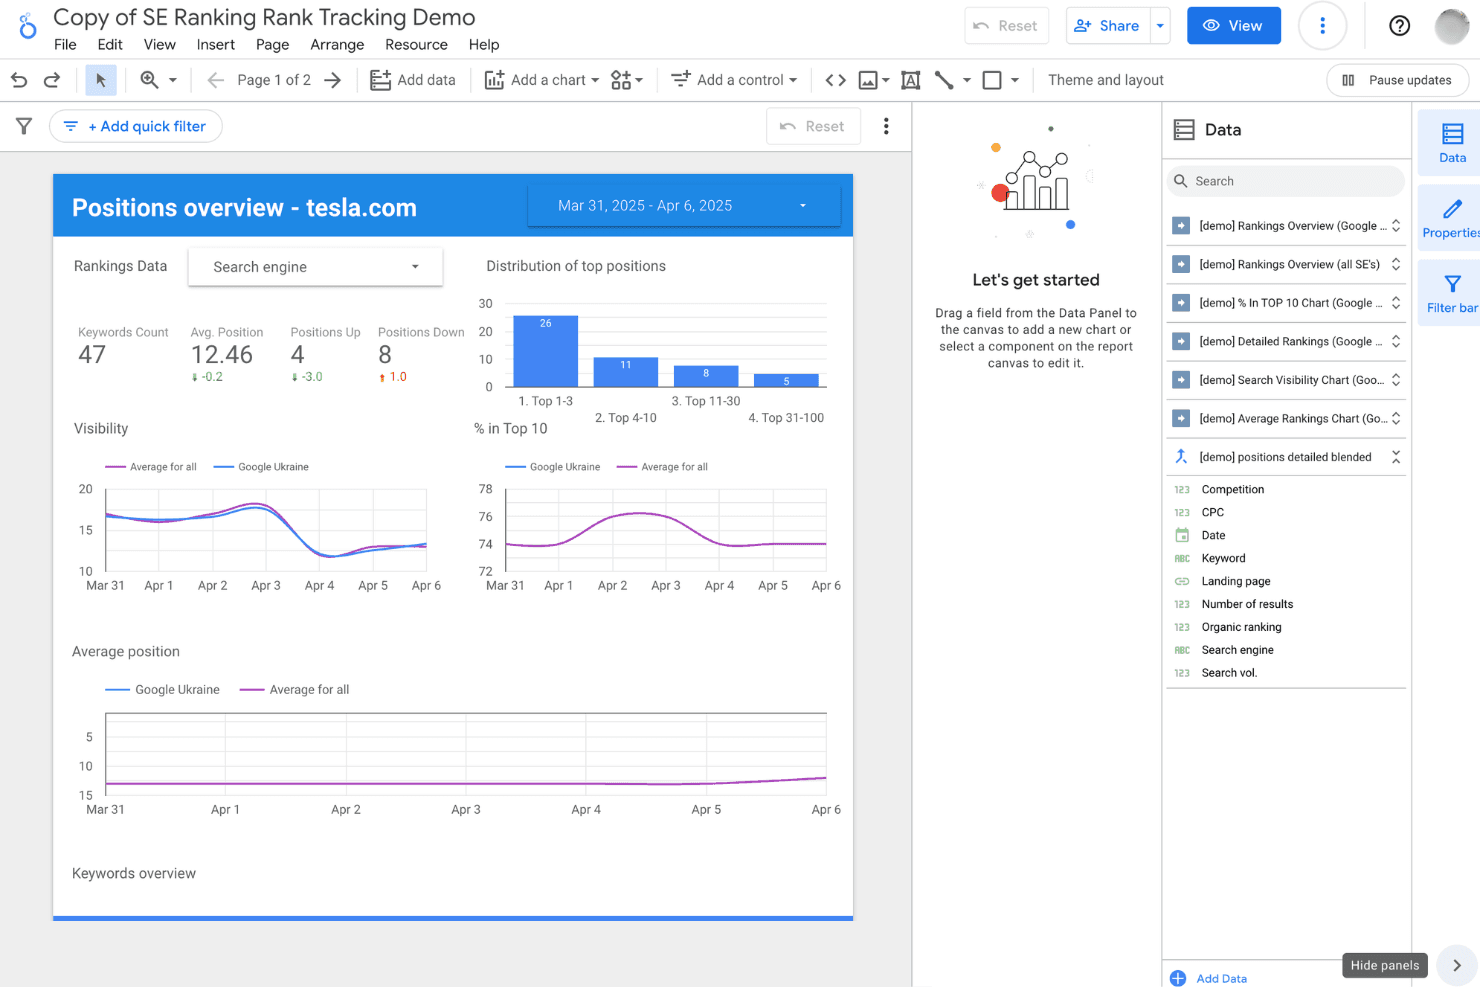
Build interactive dashboards with drag-and-drop widgets and charts. Users can tailor layouts to highlight KPIs and campaign metrics.
Data Blending
Combine data from multiple sources into a single report. This helps you compare performance across channels in one view.
Real-Time Collaboration
Share reports and dashboards with teammates for live editing. Multiple users can comment and update insights simultaneously.
Scheduled Report Delivery
Automate report distribution to stakeholders via email on a set schedule. This keeps teams and clients updated without manual effort.
Calculated Fields
Create custom metrics and formulas directly within reports. This lets you track unique business goals without exporting data.
Visualization Library
Access a wide range of charts, tables, and graphs for data storytelling. Choose from bar charts, geo maps, scorecards, and more to fit your reporting needs.
Ease of Use
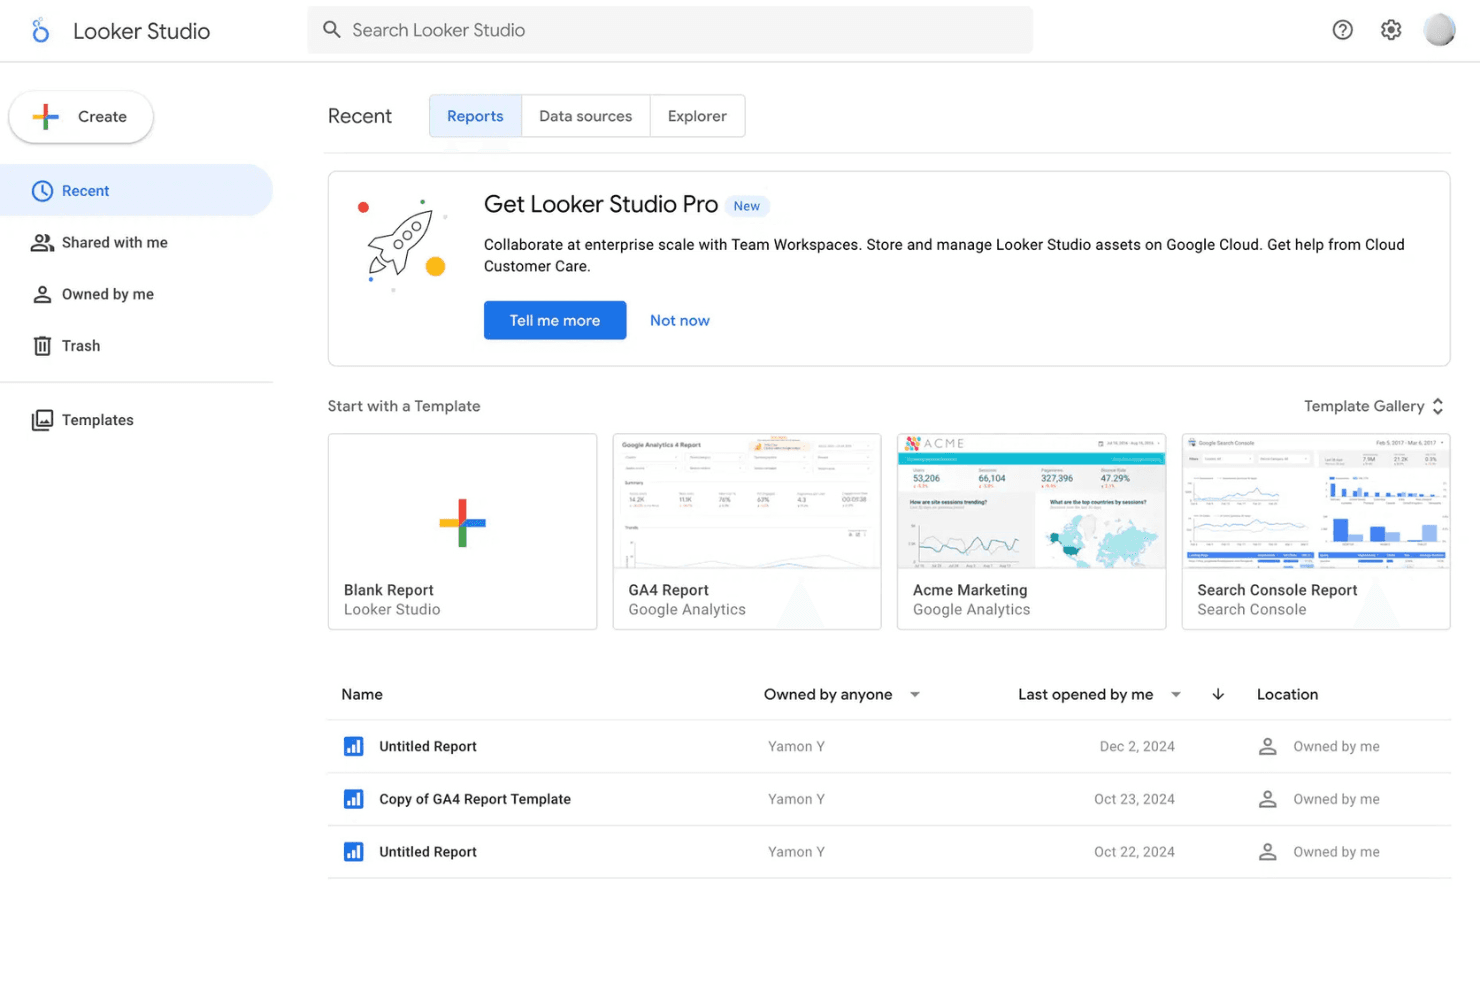
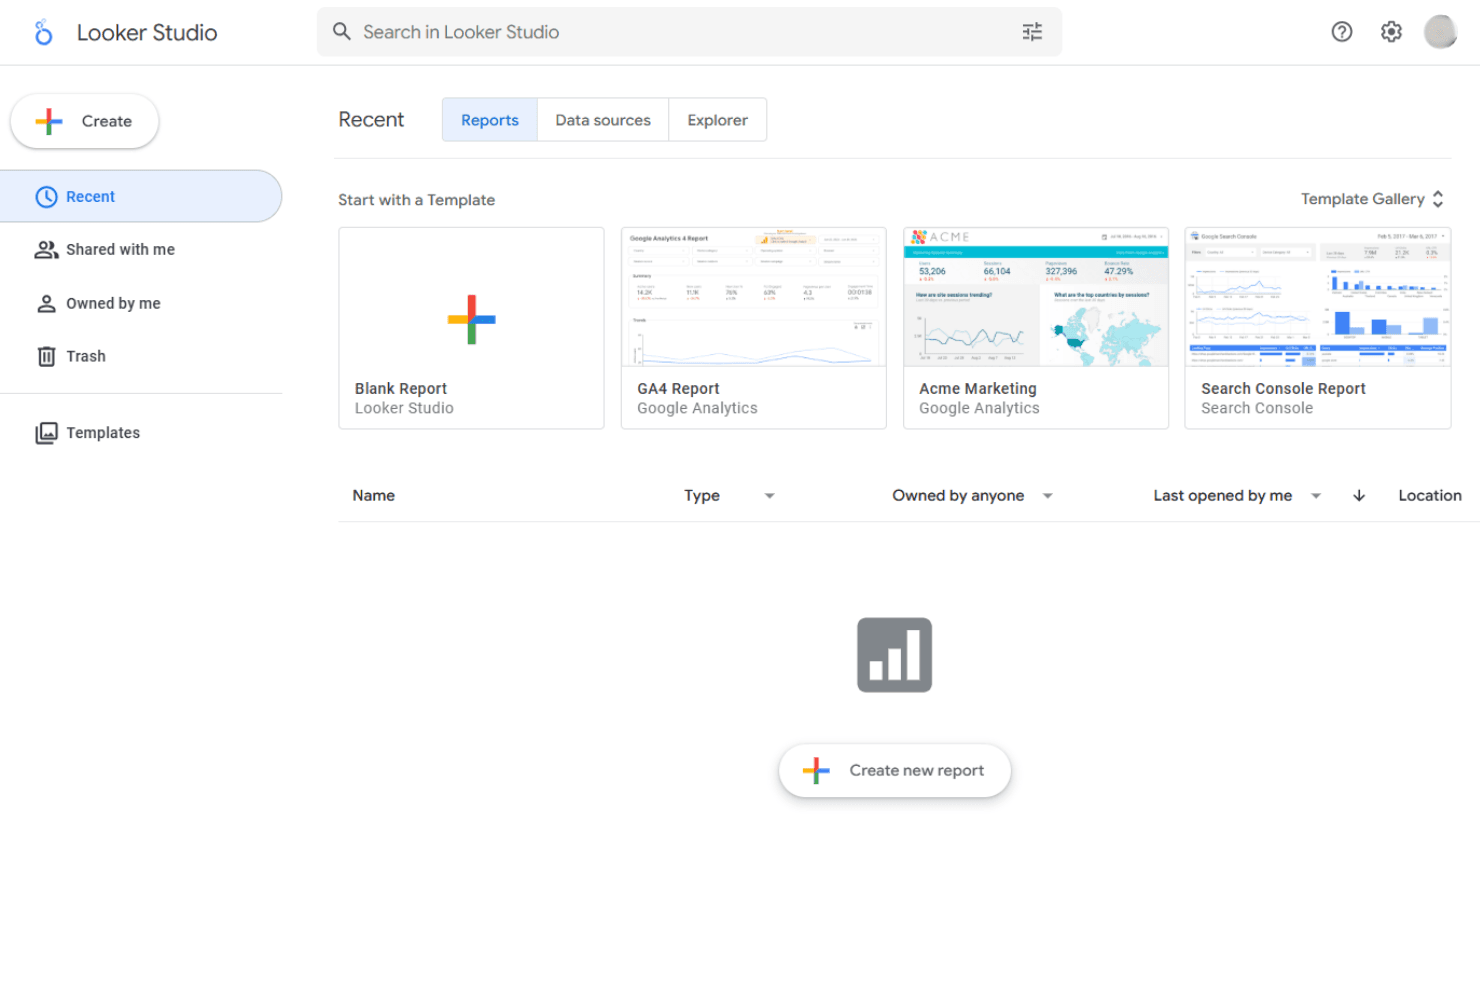
Looker Studio is one of the most approachable marketing intelligence tools for non-technical users, thanks to its drag-and-drop dashboard builder and familiar Google interface. Most users can create and share reports quickly without coding or IT help. The onboarding process is straightforward, and the platform’s real-time collaboration feels intuitive. However, some users mention that managing very large datasets or highly customized reports can get clunky, especially as dashboards grow in complexity.
Integrations
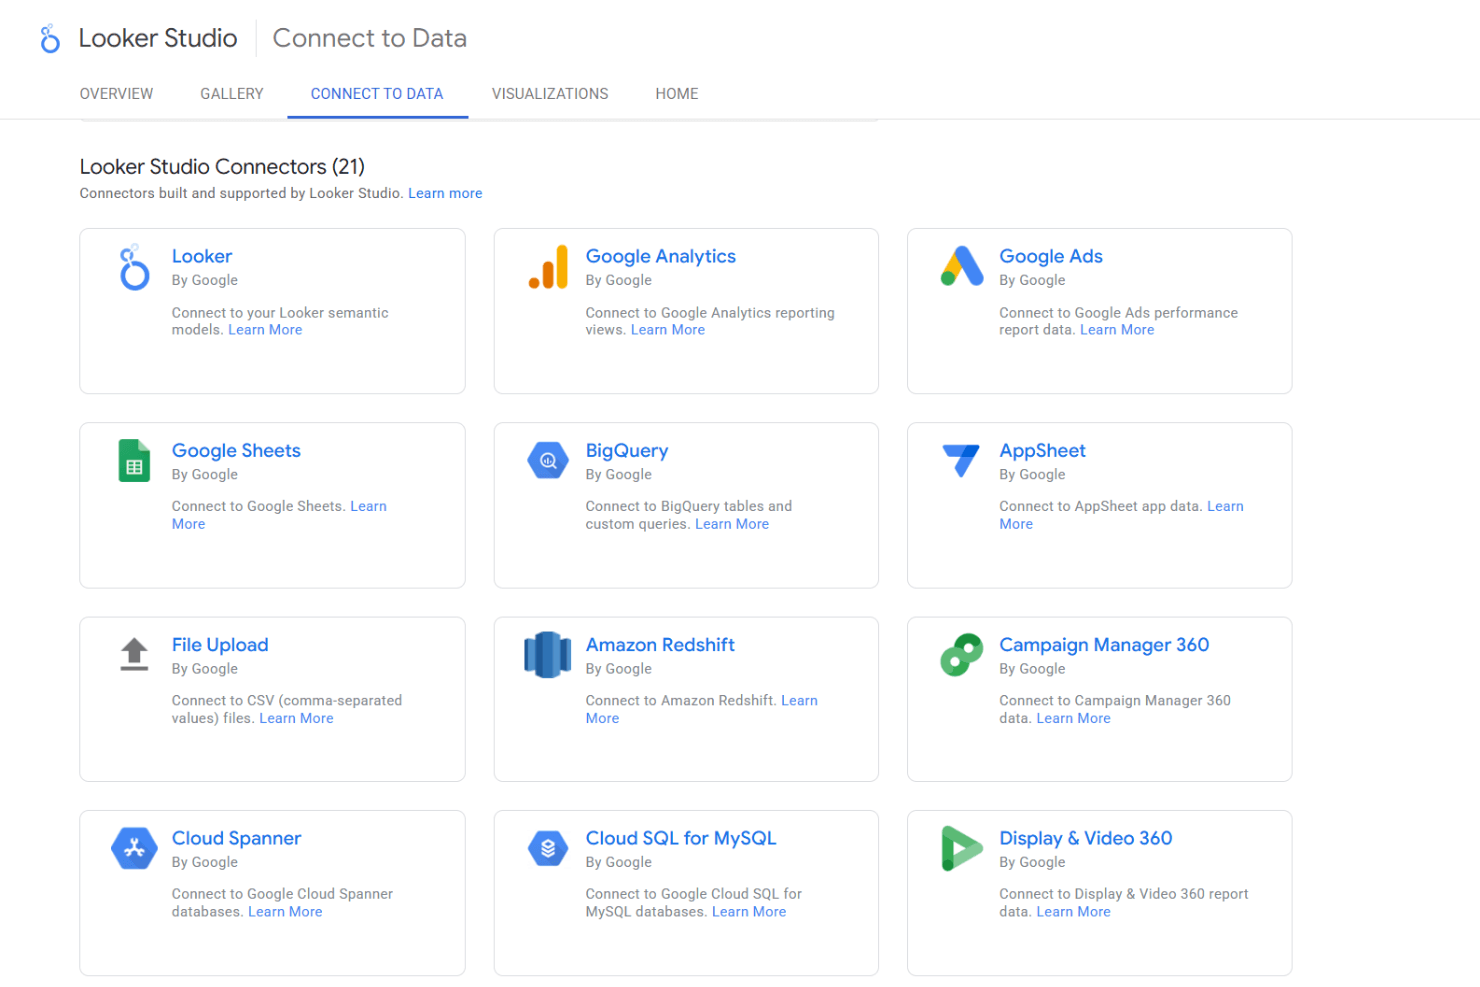
Looker Studio integrates with Google Analytics, Google Ads, Google Sheets, BigQuery, YouTube Analytics, Google Search Console, Campaign Manager, Display & Video 360, Google Ad Manager, and Cloud SQL, among others.
Looker Studio also supports community connectors, offers an API, and can connect with third-party integration tools for even broader data access.
Looker Studio Specs
- A/B Testing: No
- Analytics: Yes
- API: Yes
- Audience Targeting: No
- Automated Conversion: No
- Batch Permissions & Access: No
- Behavioral Tracking: No
- Brand Management: No
- Campaign Management: No
- Contact Management: No
- Contact Sharing: No
- Conversion Tracking: No
- CRM Integration: Yes
- Customer Management: No
- Dashboards: Yes
- Data Export: Yes
- Data Import: Yes
- Email Integration: Yes
- External Integrations: Yes
- Keyword Tracking: No
- Landing Pages: No
- Lead Management: No
- Lead Scoring: No
- Link Tracking: No
- Marketing Automation: No
- Multi-User: Yes
- Notifications: Yes
- Password & Access Management: Yes
- Social-Media Integration: No


