

Avis DashThis 2026 : Avantages, Inconvénients, Fonctionnalités et Tarifs
DashThis se démarque par la création de tableaux de bord conviviaux, facilitant pour les agences la conception et le partage de rapports marketing clairs et épurés.

Nous évaluons les outils de manière indépendante, et les commissions aident à financer nos tests. Consultez notre politique de transparence, notre méthodologie ou suggérez un outil.
DashThis is a marketing intelligence software built for marketers who need to pull data from multiple channels into clean, shareable dashboards without a lot of manual setup. It's a strong fit if your team is spending too much time compiling reports across platforms like Google Ads, Meta, and HubSpot. I'd consider it over Google Looker Studio if you want pre-built templates and a faster path to polished, client-ready reports—Looker Studio gives you more customization, but DashThis gets you to a working dashboard much quicker.
DashThis Evaluation Summary
4.8/5
- From $44/month (billed annually)
- 14-day free trial + free demo available
Pourquoi faire confiance à nos recommandations de logiciels
6,700+
Reviews
20
Industry experts
16+
Evaluation factors
14
Years
Notre équipe teste et évalue des logiciels depuis 2012. En tant que leaders marketing nous-mêmes, nous savons à quel point il est difficile — et important — de choisir le bon logiciel.
Pour ce guide, nous avons évalué les outils grâce à des tests pratiques et une recherche indépendante, en notant les outils selon nos critères de sélection.
Nos avis reflètent notre jugement éditorial humain, et non un argumentaire de vente.
Réviseurs experts:
 Gui DrusinaDirecteur de la création
- Shriya GhateSenior Marketing Lead
 Amanda JacquesResponsable Marketing Ops

DashThis Overview
If you’re judging DashThis against other marketing intelligence software, I think its clean interface, fast onboarding, and wide range of integrations make it a top pick for agencies and teams who want quick, visual dashboards. Pricing is straightforward, and support is responsive. While it doesn’t offer deep data modeling or advanced analytics, it outperforms with ease of use and automated reporting.
If you’re selecting a tool for client reporting or multi-channel campaign tracking, DashThis is a strong contender - especially if you value simplicity over granular customization.
Pros
- Customer support is fast and highly rated by users
- AI Insights highlight trends and issues in dashboards
- Automates multi-channel marketing reporting with ready-made templates
Cons
- Pricing can be high for agencies with many clients
- Limited options for custom calculated metrics
- Lacks advanced data modeling and transformation features
Is DashThis Right For Your Needs?
Who Would be a Good Fit for DashThis?
DashThis is a strong choice for marketing teams, agencies, and departments that need to automate multi-channel reporting and deliver clear, visual dashboards to clients or stakeholders. Its ready-made templates, AI-powered insights, and responsive support make it ideal for environments where speed, simplicity, and presentation matter more than deep analytics or custom data modeling. If your team values fast onboarding and needs to consolidate data from multiple marketing platforms, DashThis is likely to fit your workflow.
- E-commerce BrandsDashThis connects to major ad and analytics platforms for sales tracking.
- Freelance MarketersAffordable plans and simple setup suit solo consultants.
- In-House Marketing DepartmentsEasy sharing and scheduled reports keep stakeholders informed.
- Franchise NetworksCentralized dashboards help track performance across multiple locations.
- Small Marketing TeamsTeams can quickly consolidate campaign data without technical setup.
- Digital Marketing AgenciesDashThis simplifies client reporting with automated dashboards and white-label options.
Who Would be a Bad Fit for DashThis?
DashThis isn’t the best choice for organizations that need advanced analytics, deep data transformation, or highly customized reporting. If your business relies on complex data modeling, granular metric calculations, or requires integration with niche data sources, you’ll likely find DashThis limiting. It’s also less suited for large enterprises with strict data governance or highly technical BI requirements.
- Large Retail ChainsDashThis may not scale for complex, multi-region reporting needs.
- Manufacturing CompaniesFew integrations with ERP or supply chain data sources.
- Product Analytics TeamsMissing features for cohort analysis and product usage tracking.
- Healthcare OrganizationsDoes not offer HIPAA-compliant data handling or healthcare integrations.
- Financial Services FirmsLimited support for custom financial metrics and compliance reporting.
- Enterprise Data TeamsDashThis lacks advanced data modeling and transformation capabilities.
Comment nous testons et évaluons les outils
Nous avons passé des années à construire, affiner et améliorer notre système de test et de notation des logiciels. Notre grille d’évaluation est conçue pour prendre en compte toutes les nuances du choix logiciel et ce qui rend un outil efficace, en mettant l’accent sur les aspects critiques du processus de décision. Ci-dessous, vous pouvez découvrir précisément comment nos tests et notations fonctionnent selon sept critères. Cela nous permet d’offrir une évaluation impartiale des logiciels en fonction de la fonctionnalité principale, des fonctionnalités différenciantes, de la facilité d’utilisation, de l’onboarding, du support client, des intégrations, des avis clients et du rapport qualité-prix.
Fonctionnalité principale (25% de la note finale)
Le point de départ de notre évaluation est toujours la fonctionnalité principale de l’outil. Dispose-t-il des fonctions de base attendues ? Certaines de ces fonctionnalités sont-elles bloquées dans des offres tarifaires supérieures ? Nous attendons d’un outil qu’il soit à la hauteur des capacités fondamentales de ses concurrents.
Fonctionnalités différenciantes (25% de la note finale)
Ensuite, nous évaluons les fonctionnalités spéciales qui vont au-delà de ce que l’on trouve habituellement chez ce type d’outils. Un score élevé indique des fonctionnalités uniques ou spécialisées qui rendent le produit plus rapide, plus efficace, ou offrent une valeur ajoutée à l’utilisateur. Nous évaluons également la facilité d’intégration avec d’autres outils couramment utilisés pour élargir les possibilités et l’utilité du logiciel. Les outils offrant de nombreuses intégrations natives, des connexions tierces et un accès API pour bâtir des intégrations personnalisées obtiennent les meilleures notes.
Facilité d’utilisation (10% de la note finale)
Nous considérons la rapidité et la facilité d’exécution des tâches principales via l’outil. Les logiciels les mieux notés sont bien conçus, intuitifs à utiliser, proposent des applications mobiles, des modèles prêts à l’emploi, et simplifient des tâches parfois complexes.
Onboarding (10% de la note finale)
Nous savons combien l’adoption rapide par l’équipe est cruciale pour une nouvelle plateforme. Nous évaluons donc la facilité avec laquelle il est possible d’apprendre et d’utiliser un outil sans formation poussée. On mesure aussi la vitesse à laquelle un membre de l’équipe peut être opérationnel, sans expérience préalable. Les solutions bien notées requièrent peu ou pas d’assistance.
Support client (10% de la note finale)
Nous examinons la rapidité et la facilité avec lesquelles on peut obtenir de l’aide par téléphone, chat en direct ou base de connaissances. Les outils et sociétés offrant un support en temps réel sont favorisés ; les chatbots sont pénalisés.
Avis clients (10% de la note finale)
Au-delà de nos propres tests et évaluations, nous prenons en compte le score de recommandation nette des clients actuels et passés. Nous étudions leur propension, si l’occasion se présente, à réutiliser l’outil pour sa fonctionnalité principale. Un score élevé reflète donc un bon taux de recommandation.
Rapport qualité-prix (10% de la note finale)
Enfin, après avoir pris en compte tous les autres critères, nous confrontons le prix moyen des offres de base aux fonctionnalités principales et prenons en compte la valeur apportée par les autres éléments d’évaluation. Les logiciels qui offrent plus pour moins obtiennent une note supérieure.
Core Features
Automated Reporting
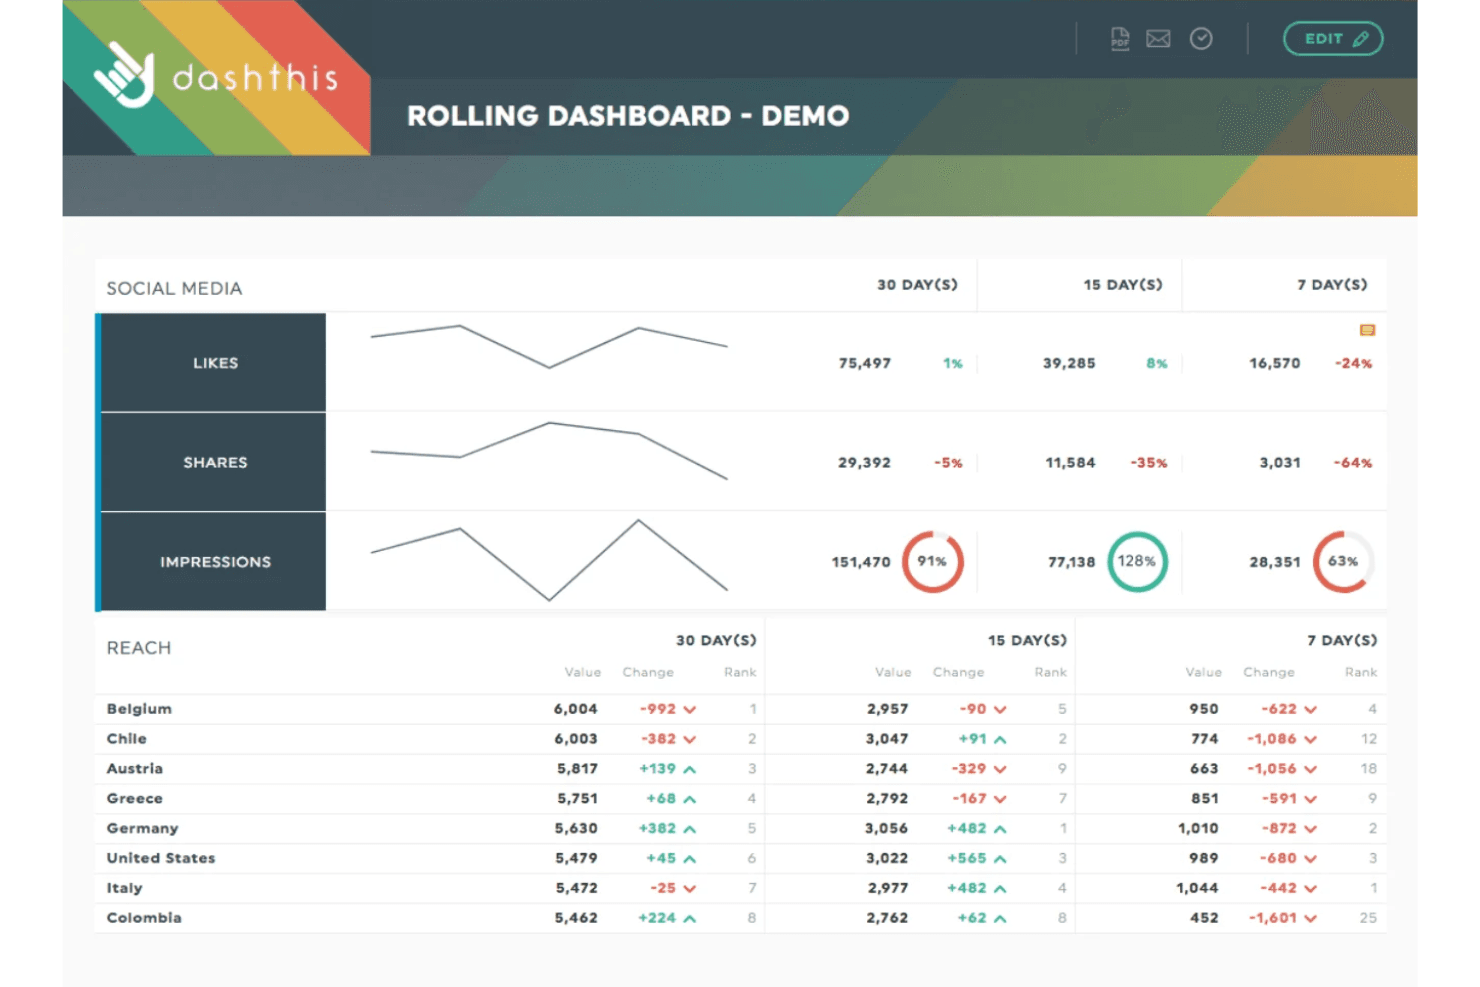
Schedule dashboards to update and send automatically, saving time on manual reporting. Users can set daily, weekly, or monthly delivery to clients or stakeholders.
Preset Dashboard Templates
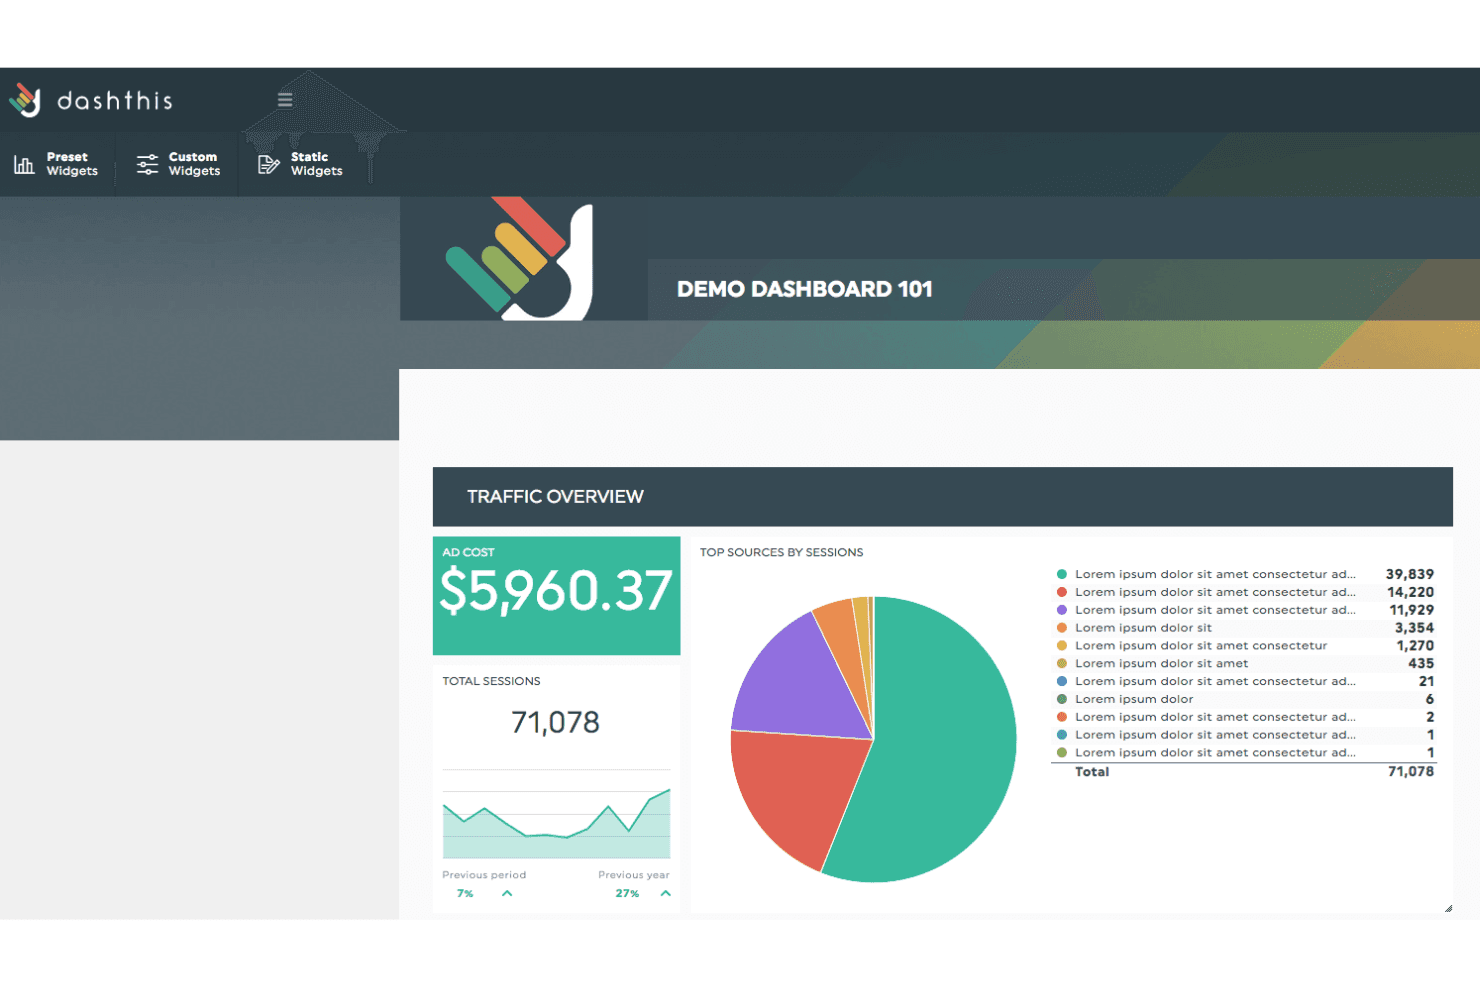
Choose from industry-specific templates for PPC, SEO, social, and more. Templates help users launch new dashboards in minutes with pre-built layouts.
AI Insights
DashThis highlights key trends, anomalies, and performance changes directly in your dashboards. This helps users quickly spot issues or wins without digging through data.
White-Labeling
Customize dashboards with your own branding, logos, and colors. This is especially useful for agencies delivering reports to clients.
Data Widget Library
Drag-and-drop widgets let you visualize data as charts, tables, or KPIs. Users can mix and match widgets to tailor dashboards to their needs.
Scheduled PDF Exports
Export dashboards as PDFs and schedule them for automatic delivery. This feature ensures stakeholders always have the latest reports on hand.
Ease of Use
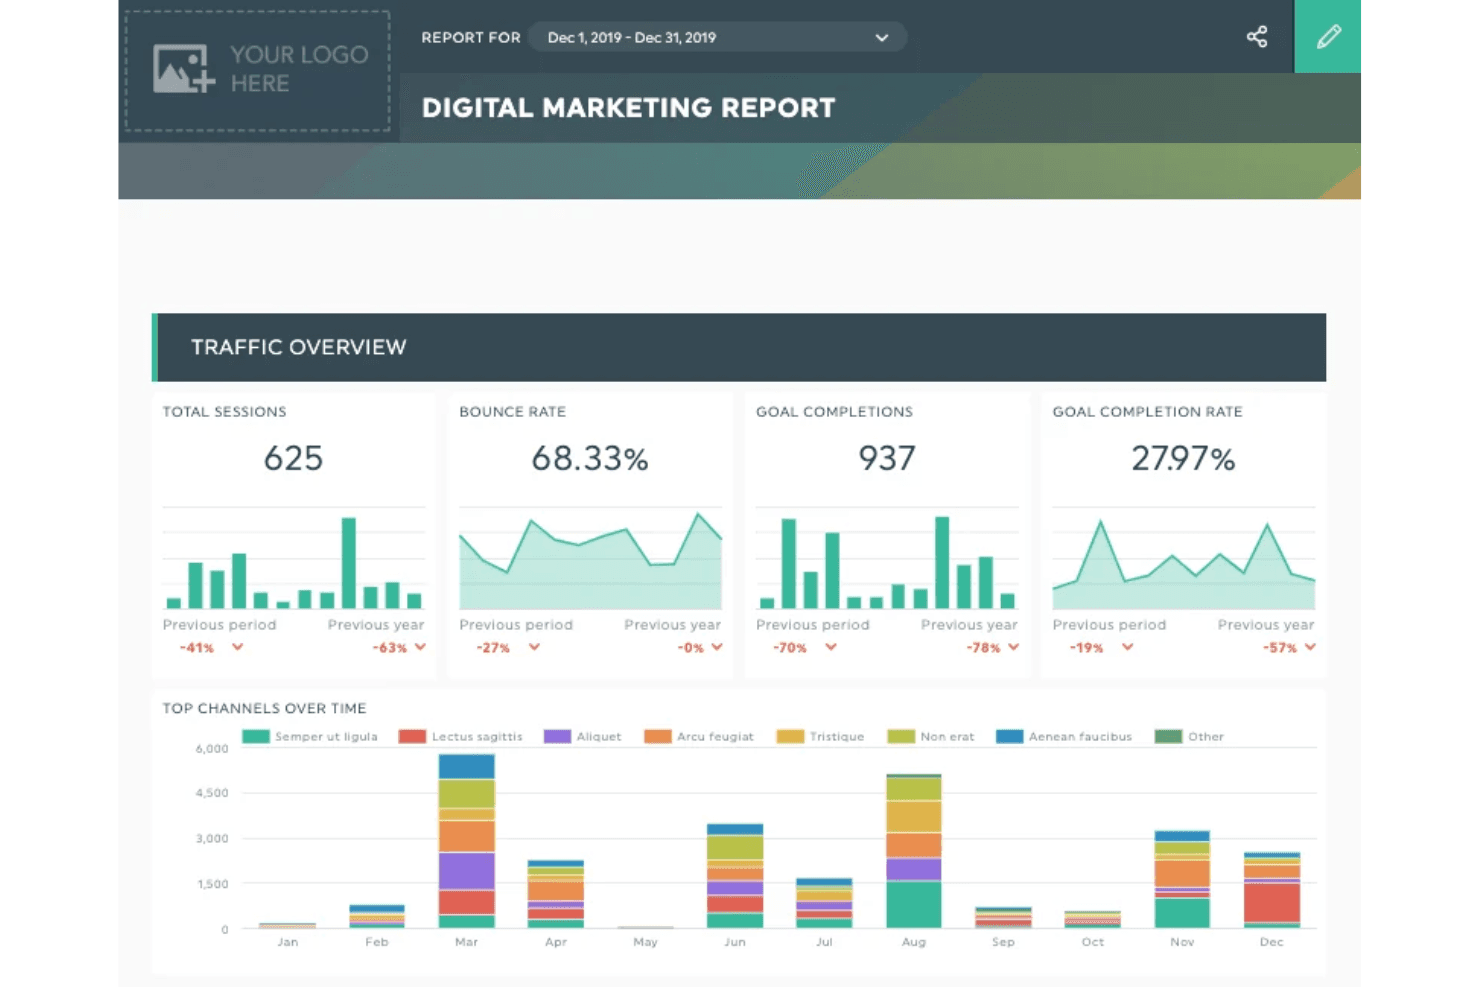
DashThis is one of the most user-friendly marketing intelligence tools I’ve tried. Users consistently mention how quickly they can set up dashboards and automate reports without technical help.
The drag-and-drop interface, clear navigation, and ready-made templates make it easy for non-technical users to get started. Even agencies juggling dozens of clients say DashThis keeps reporting simple and organized, which is a big advantage over more complex, data-heavy platforms.
Integrations
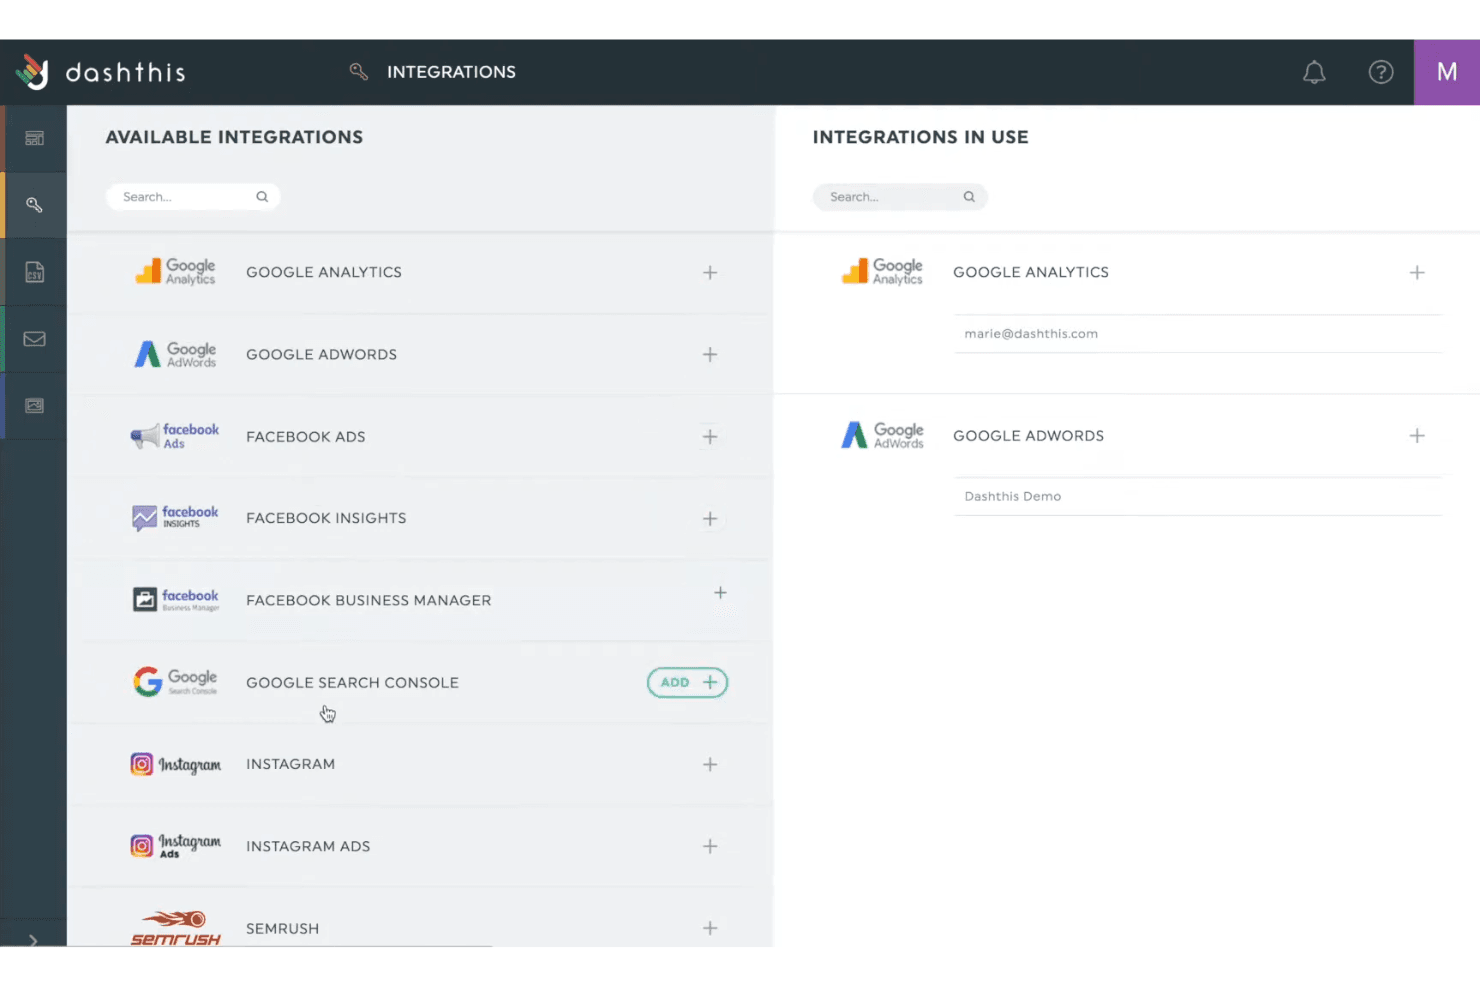
DashThis integrates with Google Analytics, Facebook Ads, Google Ads, LinkedIn Ads, Instagram Insights, Twitter Ads, YouTube, Mailchimp, HubSpot, and Shopify, among others.
DashThis also offers an API for custom data sources but does not connect with third-party integration tools like Zapier.
DashThis Specs
- AI Integration: Yes
- Analytics: Yes
- API: Yes
- Calendar Management: Yes
- Comparative Reporting: Yes
- Custom Reports: Yes
- Dashboard: Yes
- Data Export: Yes
- Data Import: Yes
- Data Visualization: Yes
- External Integrations: Yes
- Forecasting: Yes
- Multi-User: Yes
- Notifications: Yes
- Process Reporting: Yes
- Scenario Planning: Yes
- Scheduling: Yes
- SEO: Yes
- Workflow Management: Yes


