Marketing Measurement: Unlocking Marketing Attribution


There's a famous quote I like to refer to whenever I talk about marketing measurement: Half the money I spend on advertising is wasted; the trouble is I don't know which half."
Most marketers have a hard time justifying the impact of their work on the business's bottom line. And it doesn't matter what marketing measurement tools we use.
It's why we keep inventing new terms and words like 'demand creation' and 'dark social' because we want to avoid taking responsibility or ownership of numbers. Yes, I said it!
It doesn't mean it's impossible to measure marketing success, or it shouldn't be measured.
Marketers need to think more like finance and less like marketers to 'have a seat' at the table (meaning executive table). Let's define marketing measurement, its meaning, and why it matters.
So, What is Marketing Measurement?
Simply put, it is about measuring the long-term and short-term effects of marketing on the business. I like to break it down into time horizons because that is how marketing works.
Some activities drive short-term results (sales, leads, SQLs), and others drive long-term results (recall, awareness, market share - though the best way to get more awareness, recall, and market share might be to … sell more stuff to more people).
Why is this important?
So you know where to spend your next dollar. If you are making a quarterly or annual plan, own a revenue or opportunity-generated quota, or need to defend the budget for your next ABM campaign, you need to know with a high degree of certainty where you will get what results.
You must model your funnel to understand what channels bring in what numbers.
How prospects convert down funnel and past performance is sometimes the best predictor of future results - so place some educated bets and wild card bets.
Said another way - marketing measurement helps you answer the question, "If you had 100M, where would you spend it'? (maybe the answer is a Superbowl ad).
How Do You MEASURE Marketing?
Short Answer: With Models
But let’s first talk about something often overlooked and essential to understanding this topic better - incrementality.
Let's start with a simple pizza shop analogy that someone used to explain this to me.
Imagine you own a pizza shop, and you have $5 coupons. You hire 2 people to distribute these flyers and incentivize them with a bonus based on how many customers show up to buy pizza with a coupon in hand.
Person A goes down the street and hands out flyers to as many people walking around. Meanwhile, person B stands at the pizza shop door and hands flyers to people coming in to buy pizzas.
Which person 'drove more coupons'?
Person B - a customer walking in to buy pizza anyway will more likely take the coupon for $5 off. But they would have purchased pizza regardless of whether they had the coupon (they had already walked in the door).
However, Person A drove more people who would not have bought a pizza without the $5 coupon.
Person A drove more 'new customers' or incremental sales, while person B drove fewer incremental sales.
So even though person B would get the prize for the most coupons handed out and pizza sold - 90% of those people would have bought the pizza anyway.
Why am I talking about pizza? Because incrementality is a hard concept to solve in marketing. How many of our sales driven by marketing were incremental vs. what they would have bought anyway (without attending that trade show or registering for that webinar, etc.)? We will get into this a little below.
Were you expecting something on marketing attribution tools? LOL.
Alright, to continue from the important concept of incrementality in marketing, let's delve into the different methods used for marketing measurement. These methods aim to quantify the impact of marketing activities, helping businesses allocate their budgets more effectively.
Understanding these will enable you to approach marketing with a more analytical and financially prudent mindset.
Marketing Mix Modelling (MMM)
Marketing Mix Modelling (MMM) is a statistical analysis technique that evaluates historical data to determine the impact of various marketing tactics on sales and then forecasts the impact of future sets of tactics.
It considers multiple variables, including economic conditions, competition, marketing spending, etc.
MMM provides insights into the effectiveness of each marketing channel over long time horizons and helps understand how different marketing mix components contribute to sales. It's useful for allocating budgets across high-level marketing channels and long-term strategic planning.
For MMM, you need a large dataset to try how different statistical models explain and fit the data and which one has the highest confidence (i.e., explains the data and the fluctuations the best. AKA, it’s a less risky bet).
For better models, it's ideal to use higher resolution data, e.g., daily data, which would be a better fit than monthly data since there's more data.
The advantage of MMM is that it goes beyond just online channels and can show the impact of that 100K billboard campaign on the bottom line.
The problem with MMM is that, like with most B2B businesses, there needs to be more data. For example, a company that sells to an enterprise that only does three deals every year.
MMM is also better suited for more annual/quarterly analysis and less so for optimizing marketing on a weekly/monthly basis.
Examples of MMM in action
At 42 Agency, we leverage marketing mix models for our customers and do some advanced analysis to determine insights beyond first-touch / last-touch attribution.
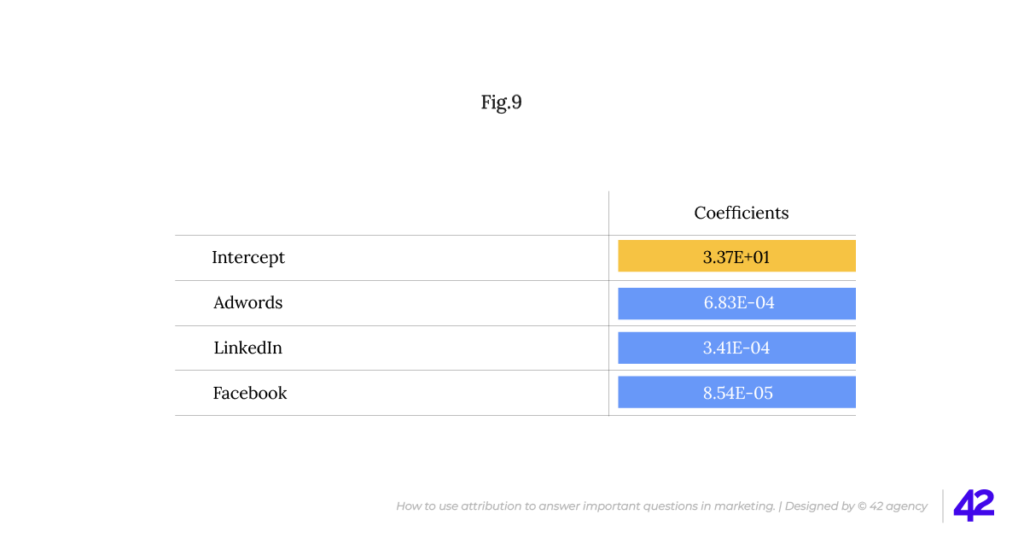
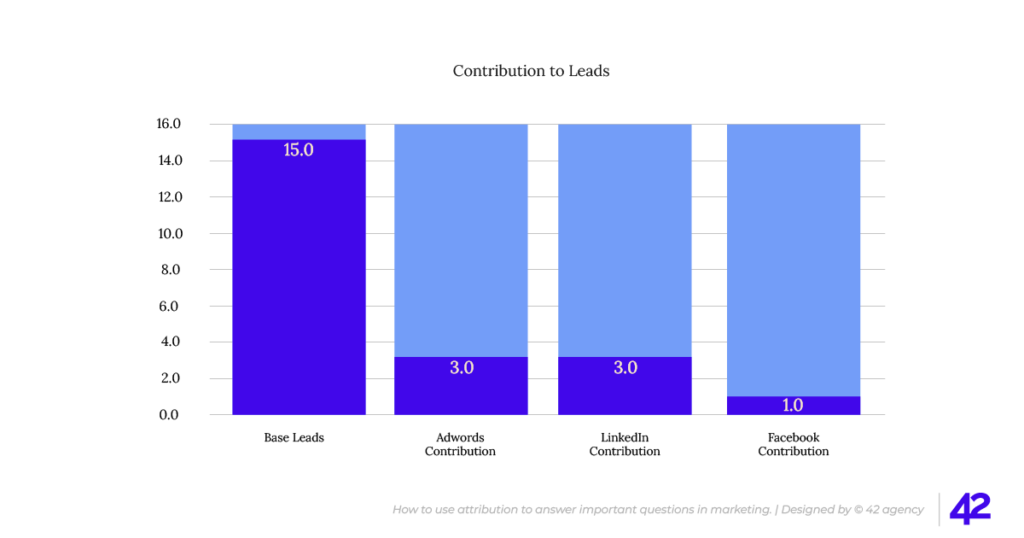
One of our customers, who spends around $1M monthly in media, spent a significant amount of their budget on Meta Brand Awareness Ads and LinkedIn Reach Ads. We performed an analysis to answer a few questions:
- Was Meta & Linkedin Driving MQL/SQLs? (The answer was yes)
- Was spending on Reach and Awareness ads positively impacting the SQL / MQLs? (The answer was not as high as we thought. In some cases, it had a negative effect, i.e., we were likely generating fewer MQLs by spending on Reach / Brand Awareness)
- What is the ad stock of different channels, i.e., how long do people remember the ad after seeing it? (FB has the highest AdStock, Adwords the lowest)
- What is our point of diminishing returns? i.e., for each additional $$ we spend on different channels - what's the expected conversion and cost/conversion? (Spending beyond a certain point was bringing in fewer conversions at a relatively higher CPA)
Correlation does not imply causation but makes for an interesting story.
With another customer, we invested heavily in YouTube video ads.
YouTube has a very low CVR (click-through conversion rate) because 80% of YouTube ads appear on TVs. But they are excellent at telling a brand story that direct response ads like Google Ads or Meta cannot.
While we could not directly tie YouTube spending to conversions via CVR, there was an evident correlation between YouTube ads flights and conversions from direct/organic. This correlation meant our ads drove prospects to sign up via other channels.

Multi-Touch Attribution (MTA)
Multi-Touch Attribution (MTA) models assign credit to each touchpoint a customer encounters on their journey to conversion. Unlike MMM, which looks at the marketing mix at a macro level, MTA operates at a micro level, analyzing the effectiveness of specific digital marketing efforts—like those of your B2B email marketing, ads, or SEO / organic — on a conversion.
MTA helps marketers understand which touchpoints are most effective at driving conversions, allowing for more granular marketing spend optimization.
For example, MTA allows us to allocate more spending to LinkedIn Ads next month because the last 30-day report showed it had a higher conversion to opp than Google ads.
Whereas MMM can pick up enough uptick in performance without direct click-based data - MTA needs clicks & tracking (browser or server side) to tie together touch points and build a customer journey.
The main issue with MTA is that it relies heavily on UTM tracking, clicks, and cookies, which are increasingly being phased out.
Important to note - MTA does not rely on 3rd party cookies (which are more so used in advertising) but first-party (1P). But, even with 1P cookies, browsers like Safari delete them after seven days. In a world where prospects are more cross-device, browsers block scripts and strip UTM links.
In other words, MTA tracking becomes more complex, and its accuracy is blurry.
If you use a cookie banner to opt-in visitors but the visitor chooses not to, you won't be able to track any referral data or other data about how they came to your site.
In your analytics, it will show as a 'direct visit.' Only 31% of visitors opt-in for cookies, so nearly 70% of your visits will show as 'direct.'
I can go on for days, but let’s get back on track and dive into some MTA models and usage.
Common Multi-touch Attribution (MTA) Models
Here are the most common MTA models I have come across in my time as a B2B marketer. And how to use them.
1. The First Touch Model
The First Touch Model attributes 100% of the conversion credit to the first touchpoint in the customer journey.
This model operates on the principle that the initial interaction is the most critical, as it introduces the customer to the brand or product, setting the stage for all subsequent engagement.
Application: This model is helpful for evaluating the effectiveness of top-of-funnel activities, such as brand awareness campaigns. It helps us understand how we get on people's radars (i.e., awareness)
How to use it: In HubSpot, this is called Original Source in its out-of-the-box data model. HubSpot / Analytics tools will cookie the first time someone visits your site and connect it to a lead when they convert.
Typically, if you're using UTMs, this is the UTM of the first time someone visited your website (not just filled out a form). You can track this in Google Analytics (UA) under Model Comparison > First click. GA4 has removed these options.
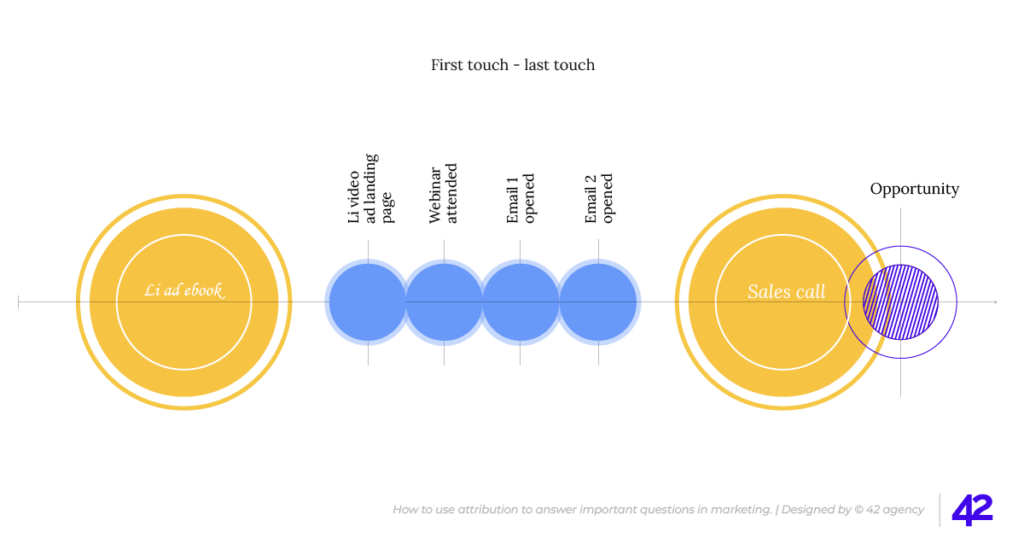
2. The Last Touch Model
Conversely, the Last Touch Model assigns all the credit for the conversion to the last touchpoint before the conversion occurs. This model assumes that the final interaction is the most important since it is the closest to conversion.
Application: Ideal for assessing the impact of bottom-of-funnel activities, such as retargeting or search ads. It highlights which channels and messages are most effective in driving the last-mile conversion.
But this favors high-intent channels like Google Ads vs. TOFU channels like LinkedIn, Meta, or Content. Even though customers might discover you from a Meta Ad on Instagram, Google Ads will take 100% of the credit if you only use a last-touch model, leading you to the false conclusion that Meta Ads simply don't work.
How to use it: This is what the Latest Source in HubSpot is, or if you use UTMs - the UTM captured on the form (on form submission). While this can be a more extended essay, the Latest Source in HubSpot is a close approximation of the prospect's last touch before they converted. Google Analytics (UA & GA4) supports last-touch modeling in their model comparison tool (last click).
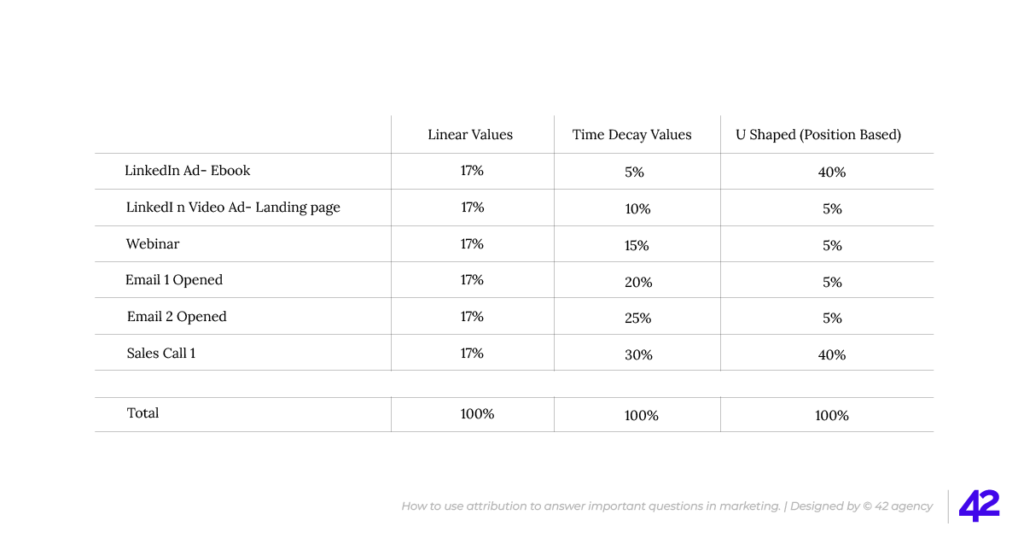
3. The Linear Model
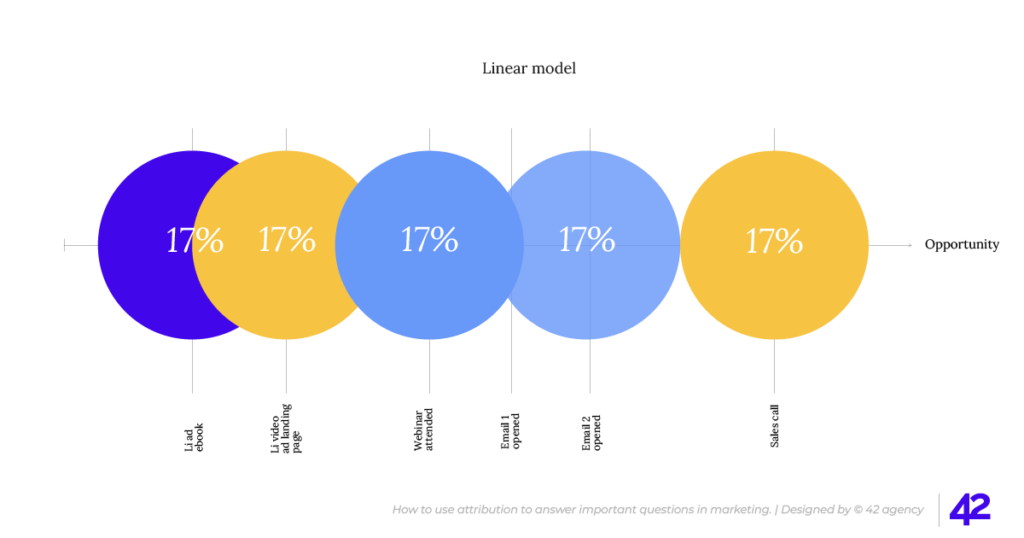
The Linear Model distributes credit equally across all touchpoints in the customer journey.
This model assumes that each interaction contributes equally to the final decision, from the first engagement to the conversion event. It is easy to implement but may need to be more balanced with the impact of more influential touchpoints.
Application: Best used when you want a simple approach that acknowledges every touchpoint without prioritizing any specific interaction. It's suitable for businesses with a flat, linear customer journey.
How to use it: Lots of 3rd party attribution tools support linear models. It was available as an option in GA UA, but GA4 does not support this. Using HubSpot Pro / Enterprise? You can also build linear attribution reports with it's Attribution Reporting.
4. The U-Shape (Position-Based) Model
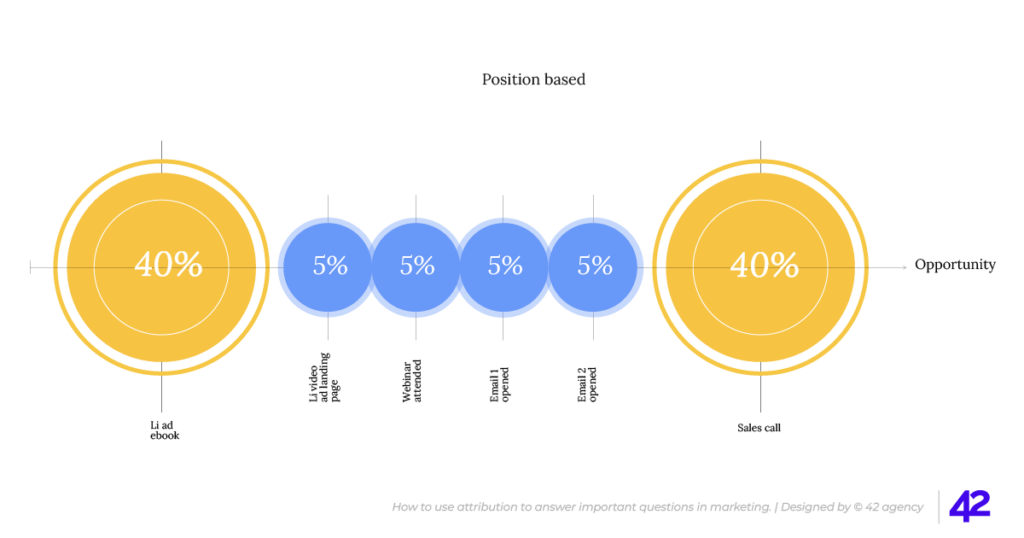
The U-shape or the Position-Based Model assigns more credit to the first and last touchpoints, typically around 40% each, while distributing the remaining 20% among the middle interactions. This model recognizes that first & last touches have a higher priority.
Application: Useful for marketing strategies emphasizing the significance of first impressions and closing interactions, such as in industries with shorter sales cycles or when launching new products.
How to use it: Lots of 3rd party attribution tools support U models. In the now-sunsetted Universal Analytics, it was available as an option. But GA4 does not support this.
If you use HubSpot Pro / Enterprise, you can also build U-attribution reports with the Attribution Reporting function.
5. The W-Shape Model
Expanding on the U-shape, the W-Shape Model incorporates three critical phases of the customer journey:
- The first touch (introduction)
- Lead creation (mid-journey engagement)
- And the opportunity creation (decision).
Each pivotal touchpoint receives a significant portion of the credit (usually around 30% each), with the remaining 10% distributed among other interactions.
Application: Ideal for businesses with longer sales cycles that involve multiple stages of engagement, such as B2B companies, where initial contact, lead qualification, and final negotiations are all crucial stages.
How to use it: Use 3rd party attribution to model this and understand the three key milestones in a prospect journey (i.e., lead/SQL/Closed Won) to identify what drives TOFU/Conversion and Closed Won.
6. The Data-Driven (Algorithmic) Model
The Data-Driven Model uses algorithms and machine learning to analyze all touchpoints and assigns credit based on the actual observed impact of each interaction.
Unlike rule-based models, this approach dynamically adjusts to reflect the varying influence of each touchpoint across different scenarios and customer segments.
Application: Best for organizations with access to large datasets and the analytical capability to process complex models. It provides the most personalized and accurate attribution but requires significant resources.
How to use it: Popularized by Google Ads. I don't think many B2B companies have large enough sets of data for this to be meaningful.
7. The Time Decay Model
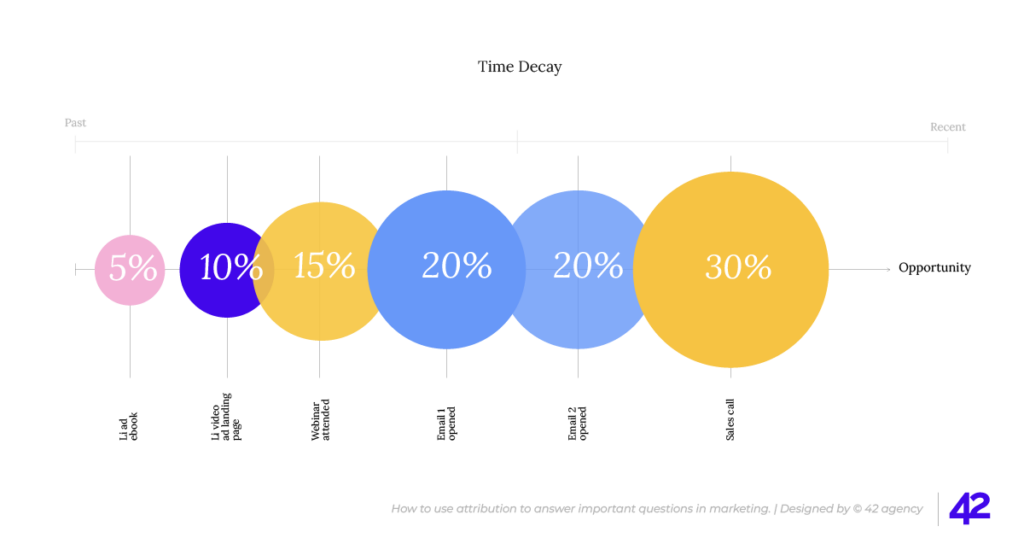
The Time Decay Model attributes more credit to touchpoints closer in time to the conversion, based on the assumption that later interactions are more influential in the decision-making process.
The credit diminishes for older touchpoints exponentially or linearly.
Application: Suitable for campaigns focusing on driving quick conversions, where the recency of the interaction is believed to have a more substantial impact on the customer's decision.
How to use it: Use this model with HubSpot Attribution or 3rd party tools to understand deal velocity by channel.
Some Extra Notes on Understanding Multi-Attribution Models
Looking beyond the models, what matters is that we understand MTA as a way to gain insight into the channels that drive TOFU awareness vs just BOFU conversions.
In our work with B2B brands, it's common to see Google Ads driving 80% of conversions on a last-touch model (which is commonly used). But upon some modelling, it becomes evident that paid social, SEO, content, YouTube, etc, are driving TOFU awareness translating into Google Ads and last mile conversions.
A prospect might hear about a brand on a YouTube or Meta / LinkedIn ad and not convert, but there's a high enough frequency that the same prospect Googles a category or brand keyword, clicks a Google Ad link, and converts.
Last Touch would give 100% of the credit to Google Ads, First Touch to YouTube or Meta, but the truth is - they both worked together to get the conversion.
But wait. Don't forget about incrementality.
MTA is fantastic, and it tells us what actions/interactions the prospect had that eventually resulted in them converting.
However, it does not answer the question: Would this person have bought anything anyway?
One of our customers was heavily indexed on Google Ads (typical for a B2B business), but 70% of their search budget was allocated to branded search (i.e., someone was searching for their brand name).
We (42 Agency) had a hypothesis that 90% of those converting via branded search would have converted either way on the organic SERP.
We slowly cut down the branded search budget and re-invested it in category / use case keywords and other channels. While conversions from Google Search decreased, conversions from organic search increased significantly, validating our hypothesis that branded search was not incremental.
Before you take to the streets to kill all branded search campaigns, they have their utility - especially if you are in a crowded market (e.g., CRM, PM tools, ATS, etc).
It helps you ‘defend’ your brand against competitors and take extra real estate on a page.
Speaking of branded search - many marketers shy away from measuring brands, but that's a mistake. Brands should and can be measured; they need to exist under a unified measurement framework for marketing.
But how exactly do you do that?
How Do You Measure Brand?
Ironically, the most common way B2B folks measure brand is 'direct traffic,' which is slightly misleading.
At best, direct traffic does not represent someone who is brand-aware. Contrary to popular belief, direct traffic is just any source of traffic (encrypted or otherwise) where web analytics cannot pick up a referral.
It is not someone typing your website into the address bar.
A better proxy might be branded search queries (accessed via Google / Bing Search Console), but even then, it’s not the most precise way to measure brand. Prospects who are aware are not necessarily going to your website.
So, what is the golden way to measure a brand? Surveys, Geo, and Holdout testing.
Recall and Aided/Unaided Surveys
Traditionally used by big media agencies and FMCG and CPG brands, surveys (both aided and unaided) are a great way to measure brand marketing campaigns.
In unaided recall, participants are asked to recall brands, products, or ads without prompts, testing spontaneous brand recall.
Aided recall, on the other hand, provides prompts or cues to help participants remember.
These surveys can gauge the impact of marketing activities on brand awareness and recall over time. You might have noticed them pop up on your YouTube or social feeds:
- 'Which of these brands would you consider buying next time you are looking for X?'
- 'Which one of these brand ads do you recall seeing in the last seven days?'.
As your brand gets more share in the market, your aided and unaided awareness should increase.
Paid Social / Search platforms also offer these as part of their measurement suite. LinkedIn recently introduced brand lift studies measuring recall from a group of people who saw your ad on Linkedin and a group of people who did not.
Facebook introduced something similar. Previously, these were only available to big advertisers on the platform, but now both are available to self-service advertisers.
Geo and Holdout Testing
How do you measure an OOH campaign like billboards? When we did it for ourselves and our customers, we looked at a lift in traffic from the city where we did the billboard campaign or brand mentions.
The principle behind this is Holdout Testing (and when done on a geo level, geo testing).
Holdout Testing, or control group testing, involves withholding certain marketing activities from a target audience segment to compare their behavior against those who did experience the marketing activity.
This method directly measures incrementality by showing what would happen without certain marketing efforts. For example, if NYC is running a billboard campaign but a comparable city (for argument's sake, Toronto) does not have billboards. There is a comparable difference in key metrics for the two cities.
Note on OOH - buying one billboard for two weeks won't make a big impact -
Lesson: We rented a mobile billboard for Hubspot's annual conference in Boston for two days. While it got some social media buzz & it made for a fantastic story - we did not get the spike of traffic we wanted. But we got attention for doing something perceived as ‘expensive’ (OOH) & different.
From Measuring to Acting
Here’s the fundamental idea of this piece: you can and should measure your marketing and brand efforts. Don’t let anyone tell you otherwise.
Even when you do that, you must build an experimental system that allows you to quickly iterate and incrementally push better ideas based on what you learn from what you are measuring.
Doing this is a whole other essay. But, beyond the tactics, it requires a mindset of clarity, intentionally building a marketing function that moves both fast and slow, and understanding what to measure weekly and what to measure quarterly (or yearly). You also need the right marketing analytics software.
Stay tuned for more. While you wait, you should also sign up for our newsletter curated for marketing leaders and get the latest trends, insights, and tactics delivered in your inbox.


