20 Email Engagement Metrics You Should Be Tracking Monthly


Why take your email engagement metrics seriously? Because approximately 4.5 billion email users exist in 2024; and experts project this number to rise to 4.8 billion by 2027 (Statista, 2024).
This widespread use of email in and outside work environments makes email an excellent business channel. Email marketing enables businesses to conduct better customer outreach, allowing them to:
- Build and enhance customer relationships.
- Target and nurture leads with personalized messaging.
- Increase brand awareness.
- Grow revenue.
Before we explore the 21 email engagement metrics marketing teams must monitor to maintain a healthy email program, let’s talk tablestakes.
What are Email Engagement Metrics?
Email engagement metrics help gauge how your customers interact with your email marketing campaigns. By tracking engagement metrics, you collect real insights on customer behavior, which you can use to optimize for better results in future email campaigns.
The Importance of Email Engagement Metrics
Now that we have the definition of email marketing metrics out of the way, let’s explore why you should track them diligently.
The Rise and Rise of Privacy Laws
As new technologies emerge, countries constantly respond with new privacy laws where appropriate. Not just countries, though. Email service providers (ESPs) must also change their requirements in line with these laws to protect their users.
For example, in February 2024, Gmail and Yahoo rolled out new regulations for senders who send at least 5,000 emails daily. Both companies are asking bulk email senders to:
- Use DKIM, SPF, and DMARC security protocols to authenticate their emails.
- Ensure unsubscribes happen within two days.
- Keep spam complaint rate under 0.3 percent.
- Allow recipients a one-click to unsubscribe.
Engagement metrics help you stay compliant with these regulations. Take spam complaints, for example. The more insights you have into subscriber engagements, the better you refine your email content to resonate with your target audience. Relevant content reduces the chances of subscribers reporting your email campaign as spam.
The Rise of Generative AI
Over the past few years, generative AI has become more mainstream. Many industries, including marketing, are adopting it for various use cases.
“I think generative AI is already impacting the ability to create content for A/B testing,” says Ed Gray, Delivery Team Manager & Marketing Practice Lead at Arkus, Inc. I expect to see it go beyond generating first-draft copy and become a strategic tool for high-level campaign planning based on accumulated performance and industry data.”
As Ed Gray implies, GenAI gets its predictive and generative powers from data. It’s as good as the data and prompts you feed it, so tracking and collecting engagement data is vital. This data makes it possible to integrate GenAI into your email marketing workflow and use the insights from your historical data to generate great subject lines, email bodies, graphics, and even videos.
The Constant Changes in Consumer Behaviour and Receptiveness to Email
Customer behaviors towards email are constantly shifting. There was a time when some of the go-to email tactics involved:
- Using the recipient’s name as the only form of personalization.
- Using overly gimmicky or spammy email subject lines to peak interest.
- Using too many emojis or gifs.
- Using generic response emails for all subscribers.
- Hiding the unsubscribe link.
But these tactics no longer work. That’s because the human brain tends to pick up on these patterns over time and become less welcoming of them. The best way to stay agile and adaptable is by tracking how your email subscribers engage with your campaign. This provides invaluable insights into what you should change to improve email campaign performance.
20 Must-Track Email Engagement Metrics
Engagement metrics help you assess how people interact with your email campaign. But you have to know which metrics to track and the ones to pay more attention to, depending on your business goals. Here are 20 key metrics you should be monitoring using your email marketing software:

1. Open Rates
Email open rate measures the percentage of people who opened your email out of the total number of email recipients. To calculate the open rate, subtract bounced emails from sent emails and divide by unique open.
Most industries have a benchmark for open rates, but generally, an open rate between 17 to 28 percent is good. If your email campaign falls below that benchmark, these email marketing tips can help you improve your open rate:
- If you have too many inactive subscribers, your open rate is bound to be low. If a subscriber hasn’t engaged with your emails in the past three to six months, try reactivating them with an email campaign. If they still don’t engage, remove them from your list.
- Use your company’s name or a real person’s in your sender’s name to improve credibility.
- Timing can determine whether the recipient opens your email. Run tests to determine the best time for your recipients to receive emails.
- Your subject line and preheader text impact your open rate the most. Get creative, but always keep it simple and within the character limit. A good subject line should pique the recipient’s interest enough for them to want to open your email.
However, open rates can be faulty. Unless the user turns images on, some ESPs keep it turned off. So, open rates can fail to register when your tracking link is attached to an image.
2. Unique Open Rates
The unique open rate measures the number of unique opens your email has accrued. For example, if you have 500 opens from 50 people, you have 50 unique opens. You can calculate the unique open rate by dividing the number of emails delivered by the number of unique opens.
Following the same tips I shared for open rates can improve the unique open rate of your email campaigns.
Another distinct way to improve your unique open rate is by using the Brand Indicator for Message Identification (BIMI). BIMI involves displaying your logo in the circle before your brand name and subject line, adding some credibility to your emails. Here’s an example:
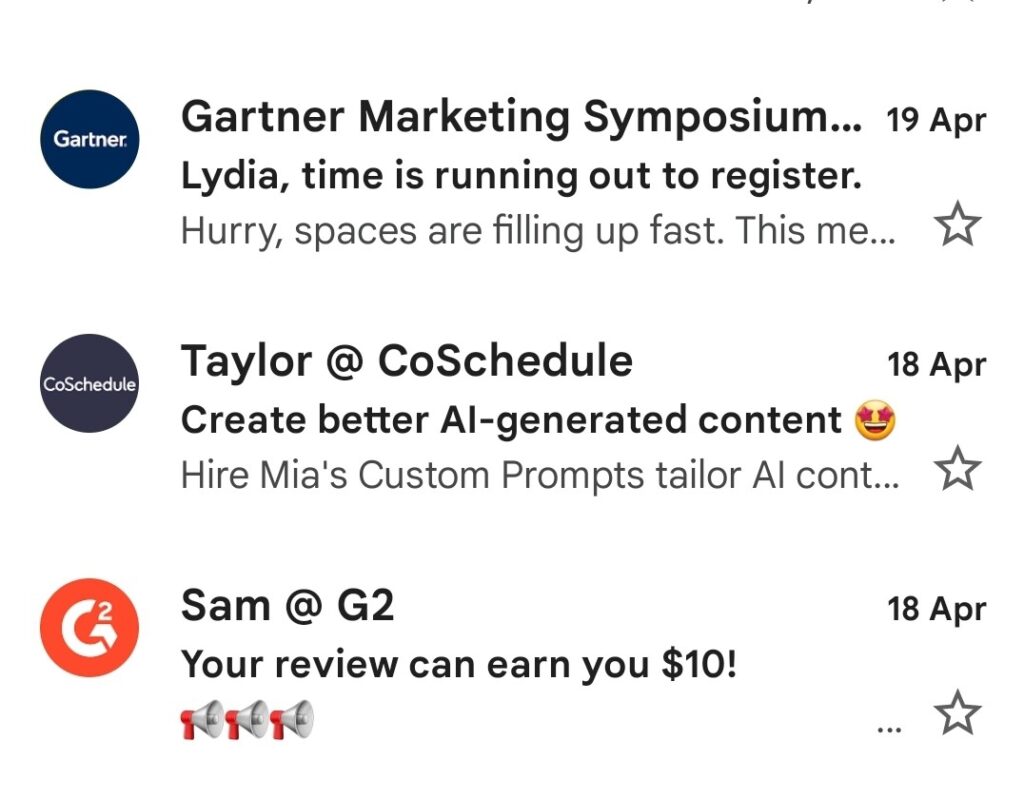
Many reports simply show you the number of opens, so you have to dig in sometimes to see how many people uniquely opened your email campaign.
3. Unsubscribe Rate
The unsubscribe rate measures the number of people who opt to stop receiving emails from you after an email marketing campaign. You can measure your unsubscribe rate by:
(Number of recipients unsubscribed from email list / Total number of emails delivered) × 100
Opinions on a good or bad unsubscribed rate vary across industries, but a good rule of thumb is to keep it at or below 0.26 percent. If it exceeds 2 percent, you should find ways to stem the tide. Here are a few tips to help you reduce the number of unsubscribes:
- Email fatigue, caused by the frequency of your emails, can prompt subscribers to unsubscribe from your email list. Ensure that you give subscribers the option to manage the number of emails they want to receive.
- A high unsubscribe rate could mean that recipients no longer see your emails as valuable to them. You need to dig into your data to learn more about your subscribers so you can make your emails to them more relevant and worthwhile.
- Many subscribers view emails via their mobile devices. Optimize for a better user experience across devices so your email layout and content stay responsive and easy to read.
- Send offers whenever possible. Nothing improves the value of your emails in subscribers' eyes, like gifts, coupons, and discounts.
Nevertheless, expect a comparatively high unsubscribe rate if you’re running a welcome series. Most people who signed up for a discount or exclusive offer tend to unsubscribe.
4. Email Bounce Rate
The bounce rate calculates the percentage of emails that didn’t reach the intended recipient’s inbox and bounced back to the sender. There are two types of email bounces:
- Soft Bounce: Soft bounce results from temporary issues such as too large messages, a full inbox, or server downtime.
- Hard Bounce: Hard bounces happen for more permanent reasons, ranging from nonexistent domains and email addresses to blocked delivery by email servers.
You can calculate the bounce rate with this formula:
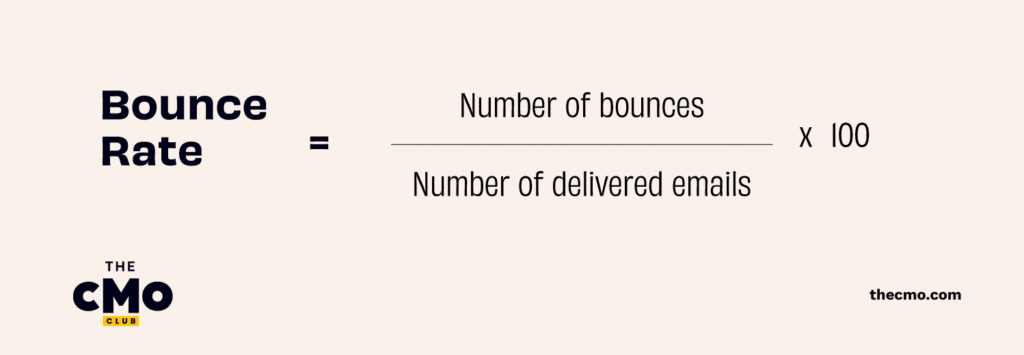
If your calculations reveal a bounce rate significantly higher than 2 percent, take these measures to stop more of your emails from bouncing back:
- A lot of email addresses exist as spam traps. When you send messages to such emails, you get blacklisted, which affects your email deliverability. Be sure to clean your email list regularly and maintain a healthy one.
- Emails can bounce back because ESPs perceive your domain as illegitimate. To avoid this, send emails only from authenticated domains with DKIM and SPF.
- Check the content of your emails to ensure they don’t contain spammy words, symbols, or broken images.
- Use double opt-in for new subscribers. This ensures you’re continually collecting active email addresses, keeping your email list clean.
The biggest one remains your email list, though. Analyze your bounce reports to see the error messages returned. These messages will help you classify bounced emails as hard or soft, which will give you clues as to why these emails bounced so you can start fixing them.
5. Spam Complaint Rates
This metric tells you how many recipients mark your email as spam out of the total number of people who got your email. The industry benchmark for spam complaint rate is 0.1 percent. Anything above 0.3 percent calls for quick and effective measures to avoid landing on an IP blocklist. Here are some measures you can take:
- Ensure everyone on your list opted-in voluntarily. This means confirming your recipients’ permission to send them emails. Some subscribers may need reminding about how they became part of your list. Add a note above your email that tells them why they’re hearing from you.
- Segmentation can help you personalize your emails better. The more relevant and valuable your emails are, the less likely subscribers will report it as spam.
- Spammy words or characters in subject lines are a surefire way to get your email sent to the spam folder. Ensure that no such words appear in your subject lines or email bodies.
- Allow subscribers the option to unsubscribe from anywhere and at any time freely. If subscribers can’t unsubscribe, the next option they’d most likely take is reporting your emails as spam.
- Use spam checkers to assess the possibility of recipients reporting your email as spam.
Set up a feedback loop (FBL) as part of your spam complaint-tracking strategy. With FBL, you receive a notification whenever someone reports your email as spam. This is beneficial because it identifies recipients you shouldn’t email in the future.
6. Email Click-Through Rates
This measures how many people clicked a CTA or hyperlink within your email out of the number of people who received your email. To calculate CTR, divide the number of people who clicked a link in the email by the number of emails delivered and multiply by one hundred.
MailChimp says the average email click-through rate across industries is 2.91%. If your email campaigns generate low click-through rates, you can:
- Make your email content more scannable so recipients can read quickly and easily pick out links.
- Avoid using multiple CTAs. When recipients are unsure which CTA to click, they may close the email.
- Design your CTAs to be visible and prominent. Avoid using ghost CTAs, which tend to blend in with the background.
- Use words like today and now to create a sense of urgency. However, this only works well if subscribers feel that they could lose something if they don’t click.
- Send different variations of your emails to various audiences and see which performs better. If an email resonates with your target audience, they will likely take the desired action.
Some email marketing platforms don’t have a feature that tracks the CTR of individual links, so it can be difficult when you have multiple links within your email. In such cases, you may need to utilize UTMs to track the specific CTA that’s most important to you.
7. Click to Open Rates
Click-to-open rates (CTOR) give you the percentage of people who opened your email and clicked a link within it. You can find the CTOR percentage by dividing the number of clicks by the number of opens and multiplying by 100. Anything less than 10 to 20 percent CTOR may require reviewing some of your email strategies.
You can also use the tips I outlined earlier for improving click-through to improve your CTOR. Keep your email content brief and scannable. More importantly, use dynamic content to ensure the most critical information is visible to your recipients.
8. Revenue Per Email
Revenue per email (RPE) measures the monetary value of each email to your business. You can calculate revenue per email by dividing your email campaign's total revenue by the total number of emails sent.
A good way to benchmark is to compare the amount invested with the returns of your email campaign. Revenue should be equal to the investment, at the very least. If revenue falls below investment, that indicates the need to improve the effectiveness of subsequent campaigns. You can increase revenue by:
- Drilling down on audience segmentation and personalization. The better you tailor your offers to buyer preferences, the better your chances of getting them to buy.
- Creating more email workflows outside your usual promotional campaigns. This allows you to increase revenue by targeting buyers on special days such as birthdays or Mother's Day. You can also send cart abandonment and company anniversary discounts.
- Take advantage of cross-selling and up-selling opportunities. Use your email campaigns to recommend products to your subscribers based on their previous purchases.
- Split test your CTAs, especially because it’s the part that encourages recipients to take action. Determine the number of CTAs to use and which CTA resonates more.
Tracking RPE on a campaign-to-campaign basis provides insights into campaign performance only in the short term. You want to go further by tracking RPE over an extended period. Analyzing individual email campaigns allows you to identify trends and long-term patterns that may not be visible.
9. Email Conversion Rate
This metric measures the percentage of recipients who responded to the call to action, which is usually a core goal of an email campaign. The email conversion rate can be calculated by dividing the total number of conversions by the number of emails delivered and multiplying by one hundred.
The average conversion rate for email marketing is between 2 to 5 percent. But fear not if you’re not hitting those numbers. You can continue to improve with these tips:
- Don’t be afraid to use active CTAs such as ‘Shop now’ in your copy.
- Use social proof where possible.
- Write catchy subject lines and preview texts that tell the reader why they should engage with your email.
- To drive conversions, add incentives such as free events, bonus content, and coupons. You can also use surveys or A/B testing to determine which offers your customers prefer the most.
Email conversion tracking can be tricky because it is less standardized than other metrics and KPIs. You need to define your conversion points based on the goal of your email marketing campaign.
10. Email List Growth Rate
This metric calculates the rate at which your email list increases (or decreases) over a specified period relative to your initial email list size. You can use this formula to calculate your email list growth rate:

Your subscriber list is steadily growing if your calculations show a 1-3% monthly growth rate. But if it falls below 0.5 percent per month, you may need to fine-tune some of your targeting and engagement tactics. You can improve your subscriber growth by:
- Using more valuable lead magnets, such as exclusive discounts and behind-the-scenes glimpses, to entice more people to join your email list.
- Promoting your email list on your social media channels to get more people to opt in.
- Reviewing the copy, visual, and placement of your opt-in form. Ensure it is prominently placed on your website and that the copy is short and clear.
- Adding social proof in your sign-up form is crucial because it tells potential subscribers that others trust you. Social proof in this context could be a quote from one of your subscribers or simply displaying the size of your audience.
Notably, a slowing growth rate doesn’t always mean you’re doing something wrong. If you operate in a seasonal industry, for example, your email list growth rate can fluctuate during off-seasons. That’s why you also need to monitor the unsubscribe rate. Together, both metrics give you a better picture.
11. Email Forwards Rate
An email's forwarding or sharing rate indicates how often your subscribers forward or share your emails with others. Email forwards rate can be calculated by dividing the number of emails forwarded by the total number of emails delivered and multiplying by one hundred.
The forward rate is crucial because it indicates that your content resonates and has earned you some brand advocates. You can get more subscribers to forward your emails by:
- Creating and sharing offers and content that are super engaging, fun, and shareable.
- Making your content even more relevant to your subscribers. The more relevant and valuable your content is, the more likely your subscribers will share it with friends and family.
- Offering discounts to your subscribers to encourage forwarding and sharing. You can personalize this by finding out which incentive works best for each segment.
If you see an upward spike in the forwarding and sharing of your email content, identify what you recently changed that led to that improvement. It should guide your iterations on future campaigns.
12. Subscriber Acquisition Cost
This metric tells you the cost of acquiring each new subscriber joining your list. You calculate subscriber acquisition cost (SAC) by dividing the total spend of an email campaign by the number of new subscribers.
SAC is vital because the metric helps you determine your return on investment after an email campaign. It shows whether you need to reduce the cost of acquiring one subscriber. Making that decision will also require considering your average lifetime subscriber value.
13. Subscriber Lifetime Value
The subscriber lifetime value (SLV) determines the average value of an email subscriber, considering the length of time they spend on your subscriber list. It can be calculated by dividing email marketing revenue for a specified period by the number of active subscribers and multiplying by the average lifespan of a subscriber.
SLV is one of the most crucial metrics to measure because it allows you to:
- Decide how much you can spend on acquiring new subscribers.
- Decide how much you’re willing to invest into retaining subscribers.
- Determine how to allocate your email marketing budget to maximize returns.
In digital marketing, ROI is always a central goal. Having a set value for each subscriber helps you measure ROI better. This is even more useful when you feed the value of each subscriber into your email analytics tool or any other automation tool in your email marketing tech stack. The tool can help determine how much to invest or budget based on each subscriber's worth.
14. Inactive Subscribers Rate
This metric measures the number of inactive subscribers out of the total number of subscribers. You consider a subscriber inactive if they haven’t engaged with your email over a long period, usually between six to twelve months.
Inactive subscribers aren’t entirely lost, though. You can re-engage them using specific tactics, such as:
- Identifying inactive subscribers and crafting targeted emails customized to help renew their interest.
- Taking a different approach by sending various types of emails. You could send an invitation to be part of a contest or event.
- Sending them a survey alongside an incentive such as a coupon card in exchange for their participation. The survey would aim to find out what they think of you. This may give you more insights on how to get them to engage with your email.
If you still have inactive subscribers after re-engaging, remove those and focus on your engaged subscribers. You’ve increased engagement and pruned your list to stay healthy.
15. Relapse Rate
This tells you how often a subscriber stops engaging with your email after a successful re-engagement campaign. You can measure the relapse rate by dividing the number of relapsed subscribers by the total number of active subscribers within your determined engagement period, typically six months.
One way to reduce the relapse rate is to reduce the number of emails you send to relapsed subscribers, which can reduce the risk of making them unsubscribe altogether. Another is to send a survey asking them how they feel about your emails and what you could do better.
16. Engagement Over Time Rate
This gives you a report of your email campaign's overall activities (usually opens and clicks) over a specified period. This allows you to:
- View trends of openings and clicks within a particular period.
- Determine the best time to send emails to your subscribers.
- Reward the most engaged contacts with discounts or exclusive offers.
You can also use this report to create new segmentation criteria based on engagement and other shared characteristics. This will enable you to get even more targeted in your email campaigns.
17. Deliverability Rate
Deliverability rate measures the percentage of emails your subscribers’ servers receive without sending them back as a soft or hard bounce. Calculate your email deliverability rate using the formula:

I recommend maintaining a deliverability rate of at least 85 percent to get the most out of your email marketing strategies. If it falls too much below that, you can improve your email deliverability rate by:
- Cleaning and maintaining a quality email list.
- Using a dedicated IP address and domain name.
- Keeping a consistent schedule because recipients and ESP both tend to appreciate that.
- Ensuring that only recipients subscribed to your list receive your emails.
Thankfully, there are tools that can help ensure deliverability by checking if your domain is on an anti-spam database that ESPs generate. You can also use seed testing for a trial run before sending the email to your subscribers.
18. Churn Rate
In email marketing, this refers to the percentage of people leaving your email list within a period. There are two types of churn:
- Voluntary Churn refers to subscribers who voluntarily unsubscribed or made a spam complaint.
- Involuntary Churn refers to subscribers who are not reading your emails even though they continue to receive them.
You can calculate churn using this formula:
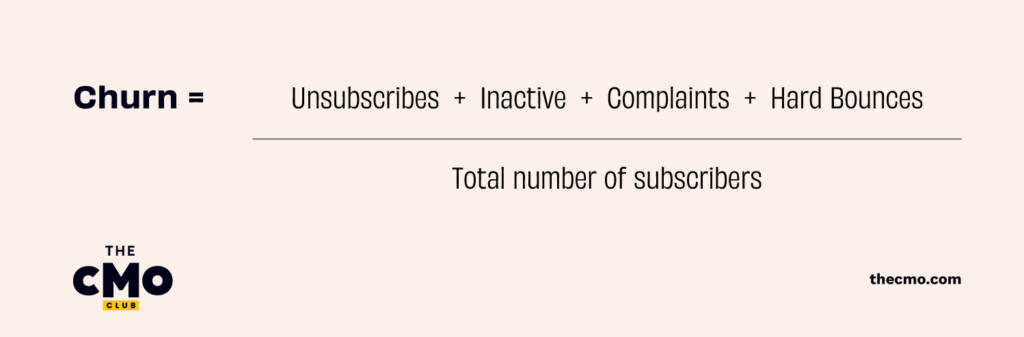
The average churn rate is between 6 to 8%. Here are some ways to reduce customer churn for email:
- Ensure that the people on your email list want to be there. Switch to using double opt-in forms if you’re not using them already.
- Give your subscribers the option of managing how often they want to hear from you. Most people consider this option first before unsubscribing.
- Find out what your subscribers want directly from them through a survey. People tend to stay on when they’re receiving relevant content.
- Put more into making your content more engaging. Tell stories and use captivating infographics and other relevant visual elements.
Interestingly, email churn rate is one of those problems you can preempt by keeping a close eye on other metrics. Fatigue and loss of interest contribute significantly to churn. The signs are usually there long before a subscriber decides to drop out of your list. Open rate, spam complaint rate, and click-through rate can give clues when a subscriber is losing interest or getting tired of your emails.
19. Sign-up Rate Per Channel
Your sign-up rate per channel metric measures the percentage of people who sign up to your email list from each channel in response to your email campaign.
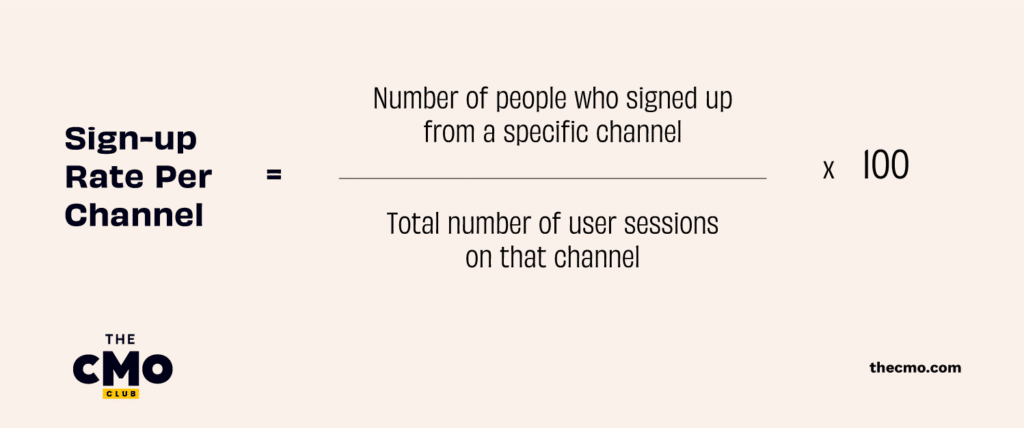
For channels with sign-up rates lower than 2 percent, you can improve them by:
- Studying what worked for other channels and implementing it.
- A/B testing sign-up forms and buttons to find what resonates the most.
- Writing copies that make customers feel they’ll miss something if they don’t sign up.
The sign-up rate of each channel heavily depends on the quality of traffic on that channel. If the people frequenting the channel are separate from your target audience, sign-up will naturally be low. So, be sure to put sign-up forms in front of your ideal targets.
20. Revenue Per Subscriber
This metric gives you the average monetary revenue of each individual subscriber. To calculate RPS, divide the total revenue accrued from your email campaign by the total number of subscribers on your email list. You can increase revenue from your email list by:
- Growing your subscriber base further. More subscribers means you have more buyers.
- Make subscriber retention a priority. Loyal subscribers simply generate more revenue.
- Increasing subscriber spending via premium subscriptions.
Overall, sustainably increasing revenue per subscriber ties back to your content. Individualized content connects you with your recipients and builds trust. Subscribers who trust your brand are more likely to part with their money because of your product or service.
How to Use Email Engagement Metrics to Improve Your Email Campaigns
After every email campaign, your marketing team would want to know what they can do better to improve ROI. Engagement metrics allow you to track how recipients respond to your email campaigns, giving you strategic insights into improving your approach in the following areas:
- Target the Right Audience: As marketing budgets get leaner, you must direct your campaigns to people most likely to convert. Through your engagement metrics, you can identify which segment of your audience:
- Purchases your product or service more
- Shows more buying intent (and might need a little more nudging to buy)
- And engages with your emails frequently
Based on this data, you can design campaigns for specific audiences based on their interests, where they are in the sales process, or previous responses to your campaign. With this type of precise targeting, you’re more likely to improve your conversion rates.
- Optimize Your Budget: Expected returns from an email campaign often determine the size of the marketing budget. But instead of estimating a budget blindly, you can use data from your email engagement metrics to optimize your budget.
These metrics provide you with data on:
- What each email and subscriber is worth to you
- How much it costs to acquire each subscriber
- And the value of each subscriber for the duration of their time on your list
With this data, you have reliable benchmarks that can help guide how much you spend acquiring new subscribers in subsequent campaigns.
- Optimize Your Email Copy: Your email copy is one of the main details of your email marketing campaign. It’s the part that gets recipients to open your email and even take action. Analyze positive and negative engagement metrics to understand what recipients like and dislike. This tells you which part of your email copy works and which areas require further optimization. For example, if a CTA on a promotional email prompts minimal conversion, then you may need to come up with more CTA variations and test to find which works best.
- Optimize Your Email Template/Structure/Design: Your email template, structure, and design all contribute to your email campaign's readability and visual appeal. Each design decision can impact how your subscribers receive your email campaign.
Thanks to engagement data, you won’t have to make these decisions in the dark. To improve your CTA buttons, for example, analyze click-through rates to get a good idea of which your audience prefers.
Track Your Engagement Metrics For Profitable Email Campaigns
Engagement is the heartbeat of your email campaign. Tracking your engagement metrics helps you understand how your target audience interacts with your emails. So, before I wrap up, let’s quickly highlight the most important engagement metrics to track:
- Unique open rate
- Click-through rate
- Click to open rate
- Conversion rate
- Revenue per email/subscriber
Looking for more resources on email marketing? Be sure to subscribe to The CMO newsletter for expert insights and recommendations.


